Spectroscopic Diagnosis of Propagating disturbances in coronal loops: Waves or flows?
Abstract
The analysis of multiwavelength properties of propagating disturbances (PDs) using Hinode/EIS observations is presented. Quasi-periodic PDs were mostly interpreted as slow magnetoacoustic waves in early studies, but recently suggested to be intermittent upflows of the order of 50150 km s-1 based on the Red-Blue (RB) asymmetry analysis of spectral line profiles. Using the forward models, velocities of the secondary component derived from the RB analysis are found significantly overestimated due to the saturation effect when its offset velocities are smaller than the Gaussian width. We developed a different method to examine spectral features of the PDs. This method is assuming that the excessive emission of the PD profile against the background (taken as that prior to the PD) is caused by a hypothetic upflow. The derived LOS velocities of the flow are on the order of 1030 km s-1 from the warm (11.5 MK) coronal lines, much smaller than those inferred from the RB analysis. This result does not support the flow interpretation but favors of the early wave interpretation.
1 Introduction
Propagating bright disturbances (PDs) in coronal loops were first observed by SOHO/EIT (Berghmans & Clette 1999), and then by TRACE (De Moortel et al. 2000). Now SDO/AIA shows this phenomenon everywhere on the Sun from active regions to quiet Sun, and coronal holes (Tian et al. 2011c, b). Whether they are flows or slow magnetoacoustic waves is under strong debate. The right interpretation is very important for our understanding of the coronal heating and acceleration of the solar wind. The wave interpretation has dominated for a long time until the recent discovery of persistent upflows near the loop footpoints by Hinode/EIS (e.g Warren et al. 2011). Now increasing studies tend to agree with the interpretation by intermittent upflows (McIntosh & De Pontieu 2009; Tian et al. 2011a). The main evidence is based on the association of PDs with the underlying upflows, and the other evidence is the correlation of PDs with the blueward asymmetry and line width broadening of EIS spectra. However, this puzzle is still far from being clearly understood for several reasons.
Observations have shown that the phenomena of upflows and PDs are closely related, but also appear different. 1) Upflows are continuous, whereas PDs are quasi-periodic (Nishizuka & Hara 2011). 2) Upflows have the higher speed at the loop base, whereas PDs can reach high altitudes at a nearly constant speed. 3) Upflows are progressively larger at higher temperature up to 2 MK (Del Zanna 2008), whereas PDs are the most obvious in typical coronal temperature (11.5 MK) lines. 4) Wang et al. (2009) interpreted the PDs as slow magnetoacoustic waves, because the observed Doppler velocity and intensity variations have small amplitudes and show an inphase relationship, whereas De Pontieu & McIntosh (2010) suggested that they can be explained by weak, quasi-periodic high-speed upflows on the order of 50150 km s-1. The motivation of this study is to examine this flow scenario using both the RB asymmetry analysis and a new proposed method.
2 Observations
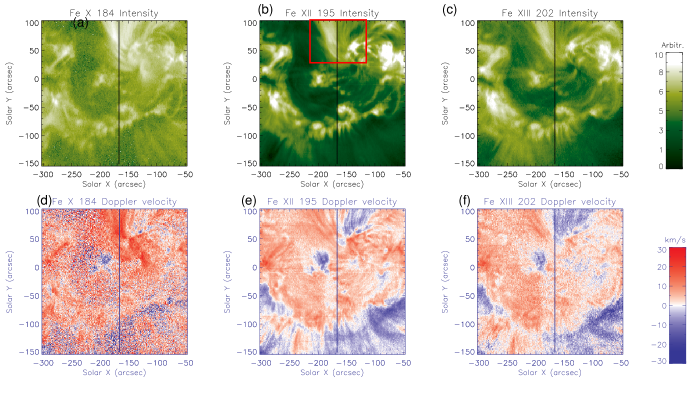
The EIS observations were obtained on 2007 February 1 in AR 10940. Wang et al. (2009) first analyzed the propagating disturbances in Fe xii 195.12 Å, and found the 12 and 25 min periodicities. De Pontieu & McIntosh (2010) analyzed the PDs in Fe xiii 202.04 Å and Fe xiv 274.20 Å using the ‘Red Minus Blue’ line asymmetry technique. Figure 1 shows the raster images of Fe x 184.53 Å, Fe xii 195.12 Å, and Fe xiii 202.04 Å, and their Doppler velocity maps. The upward PDs are observed in a bundle of fanlike coronal loops. The bright fanlike loops show redshifts (downflow) in Fe x, while the bright part shows redshifts and the weak part shows blueshifts in Fe xii and Fe xiii.
3 The Saturation Effect of the RB technique
The RB technique was developed by De Pontieu et al. (2009) to quantify the line asymmetry. The RB asymmetry is defined as the emission difference between the red and blue wings integrated over the same wavelength range. By calculating the RB asymmetry at different velocity offsets, a RB profile is obtained, from which parameters of the asymmetry such as velocity offset, line width, and relative amplitude can be derived. Martínez-Sykora et al. (2011) quantitatively studied the properties of the RB asymmetry using both simple forward models and 3-D MHD simulations.
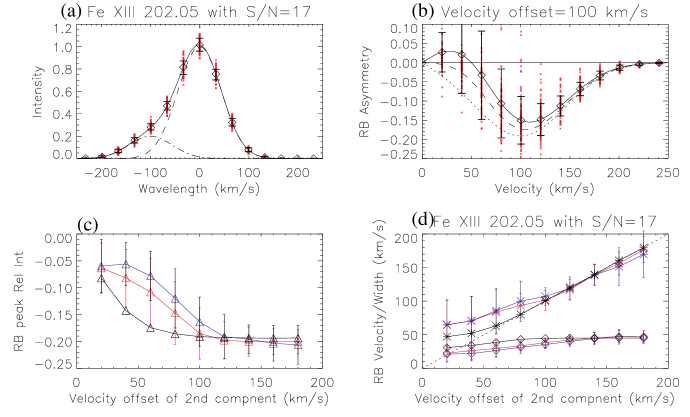
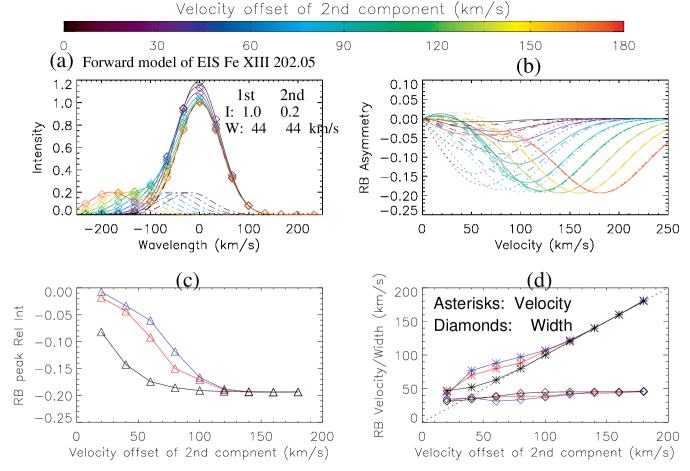
Figure 2 shows the forward models of the RB asymmetry profiles calculated using three ways (called RBS, RBP, and RBD), which are similar to those used in Tian et al. (2011b). RBS is calculated with the line centroid derived from the single Gaussian fit to the line core, RBP with the line centroid taken as the spectral peak position, and RBD with the line centroid derived from the double Gaussian fit (in the models taken as the exact centroid position of the primary component). It shows that the derived RB velocity tends saturated for the small flow velocity (Fig. 2d). This effect results from two reasons. 1) The spectral line has a certain width. When the velocity offset is close to the Gaussian width, a non-negligible amount of emission from the secondary component contributes to the red wing of the primary component, thus distorts the RB profile. 2) When the velocity offset is small, the determination of the line centroid for the primary component becomes unreliable for any methods. The derived line centroid position is largely deviated from the true one. The saturation effect leads to the flow amplitude underestimated and the flow velocity overestimated significantly.
The saturation effect becomes more serious for data with the noise. Figure 3 shows the forward models including Poisson noises based on the S/N of EIS data. The derived RB velocities have large uncertainties for small velocity offsets especially in the case with the small S/N. The simulations for 6 coronal lines show that for an upflow with the velocity offset of 20 km s-1, the RB velocities from RBS and RBP are 5575 km s-1. The consequences of the saturation effect are, 1) Due to the large instrumental line broadening, the RB velocity derived from EIS data will be never below 50 km s-1. 2) The so-called RB-guided double Gaussian fit will be misguided to overestimate the upflow velocity when it is actually small, leading to a biased conclusion that upflow velocities are always on the order of 50150 km s-1, independent on the temperature.
4 Spectral Signature of the Propagating Disturbances
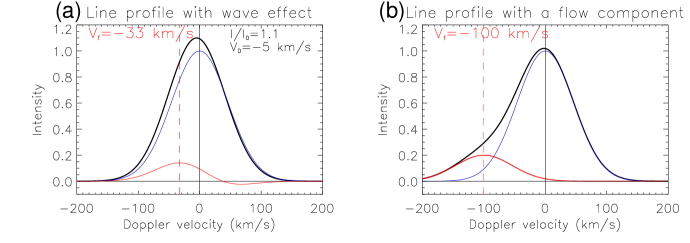
We suggest a more simple method to examine whether the bright PDs are intermittent flows. If they are, we take the line profile from the time between two PDs as the background, and subtract it from the PD line profile, then the obtained remnant emission should come from the transient flow. The advantage of this method is whatever the background profile is (symmetrical or asymmetrical), as long as it is slowly-varying, after being removed the left emission should be the transient component that makes the PDs. Figure 4 compares the modeled line profiles between the wave and flow cases. In the wave case, the PD profile is modeled by blueshifting the background profile by 5 km s-1 and increasing the peak intensity by 10%. The obtained remnant profile has a peak at 33 km s-1 in the blue wing, and shows weak negative intensities in the red wing since the wave causes the line core blueshifted in the compressive phase. In the flow case the PD line profile is modeled by adding a high-speed (100 km s-1) upflow component, showing a clear blueward asymmetry. We expect that the remnant line profile should not have negative values in the flow case.
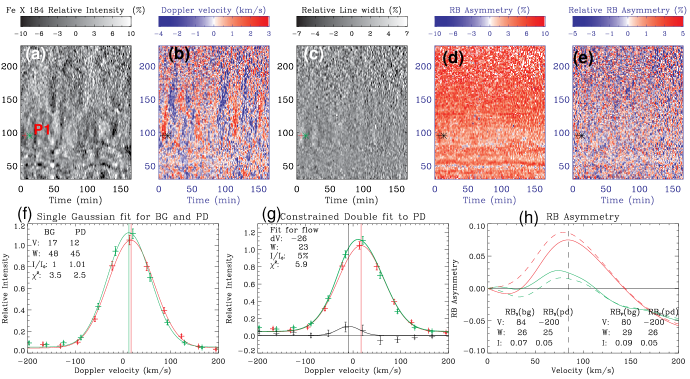
Figure 5 shows the analysis of the PDs in Fe x 184 Å. The PDs in intensity are weak due to the small S/N, but are obvious in Doppler shifts, which are similar to those seen in Fe xii 195.12 Å (Wang et al. 2009), showing the upward propagating features. This is inconsistent with the downflows as indicated by Doppler redshifts and redward asymmetries of Fe x line profiles if the PDs are upflows. Instead, the remnant profile shows the peak with a blueshift of 26 km s-1 and the negative values in the red wing (Fig. 5g), which are consistent with the expected features from the wave model (Fig. 4a). The analysis of the remnant profiles for the PDs in Si x 258, Fe xii 195, and Fe xiii 202 Å shows the similar results which reveal no evidence for the high-speed (100 km/s) transient upflows. Therefore, our results support the early interpretation of PDs by the slow magnetoacoustic wave.
5 Discussion and Conclusions
Using the line-profile difference analysis, we find only small (1030 km s-1) hypothetic upflows in Fe xFe xiii and Si x. Considering the apparent speed of the PDs of 100 km s-1 (Wang et al. 2009), if they are flows the inclination of magnetic fields along which the PDs are seen would be 73∘-84∘, much larger than the typical values measured from observations (Marsh et al. 2009) or the field extrapolations (Tian et al. 2011b). Tian et al. (2011a); Nishizuka & Hara (2011) suggested the presence of quasi-periodic upflows at the base of loops based on the blueward asymmetry of the line profiles and its correlation with the line width broadening. This suggests that propagating slow-mode waves at higher locations may be driven by fast upflows at the loop’s footpoint which are generated by tiny heating events (nanoflares). Using 3-D MHD simulations, Ofman et al. (2011) showed that the injection of periodic upflows can produce persistent upflows and excite propagating slow-mode waves in the loop simultaneously.
In summary, we find that the blueward asymmetries of EIS spectra are largely overestimated due to the saturation effect using the forward models including the photon noise. This may lead to a biased conclusion that upflow velocities are temperature-independent. The propagating disturbances are the most obvious seen in typical (11.5 MK) coronal lines. The RB analysis shows no evidence that the PD line profiles have an obvious increase in large (100 km s-1) blueward asymmetries compared to the background profile. This result is consistent with the derived small (1030 km s-1) ‘hypothetical’ upflows from the line-profile difference analysis, thus supporting the slow-wave interpretation of PDs.
Acknowledgments
LO was supported by NASA grants NNX08AV88G, NNX09AG10G, and NNX10AN10G. TW was supported by NASA grants NNX08AE44G and NNX10AN10G.
References
- Berghmans & Clette (1999) Berghmans, D., & Clette, F. 1999, Solar Phys., 186, 207
- De Moortel et al. (2000) De Moortel, I., Ireland, J., & Walsh, R. W. 2000, A&A Lett., 355, 23
- De Pontieu & McIntosh (2010) De Pontieu, B., & McIntosh, S. W. 2010, ApJ, 722, 1013
- De Pontieu et al. (2009) De Pontieu, B., McIntosh, V. H., S. W.and Hansteen, & Schrijver, C. J. 2009, ApJ Lett., 701, 1
- Del Zanna (2008) Del Zanna, G. 2008, A&A Lett., 481, 49
- Marsh et al. (2009) Marsh, M. S., Walsh, R. W., & Plunkett, S. 2009, ApJ, 697, 1674
- Martínez-Sykora et al. (2011) Martínez-Sykora, J., De Pontieu, B., Testa, P., & Hansteen, V. 2011, ApJ, 743, 23
- McIntosh & De Pontieu (2009) McIntosh, S. W., & De Pontieu, D. 2009, ApJ Lett., 706, 80
- Nishizuka & Hara (2011) Nishizuka, N., & Hara, H. 2011, A&A Lett., 737, 43
- Ofman et al. (2011) Ofman, L., Wang, T. J., , & Davila, J. M. 2011, ApJ, submitted, 0, 0
- Tian et al. (2011a) Tian, H., McIntosh, S. W., & De Pontieu, B. 2011a, ApJ Lett., 727, 37
- Tian et al. (2011b) Tian, H., McIntosh, S. W., De Pontieu, B., et al. 2011b, ApJ, 738, 18
- Tian et al. (2011c) Tian, H., McIntosh, S. W., Rifal Habbal, S., & He, J.-S. 2011c, ApJ, 736, 130
- Wang et al. (2009) Wang, T. J., Ofman, L., Davila, J. M., & Mariska, J. T. 2009, A&A Lett., 503, 25
- Warren et al. (2011) Warren, H. P., Ugarte-Urra, I., Young, P. R., & Stenborg, G. 2011, ApJ Lett., 727, 58