The bias of the submillimetre galaxy population: SMGs are poor tracers of the most massive structures in the Universe
Abstract
It is often claimed that overdensities of (or even individual bright) submillimetre-selected galaxies (SMGs) trace the assembly of the most-massive dark matter structures in the Universe. We test this claim by performing a counts-in-cells analysis of mock SMG catalogues derived from the Bolshoi cosmological simulation to investigate how well SMG associations trace the underlying dark matter structure. We find that SMGs exhibit a relatively complex bias: some regions of high SMG overdensity are underdense in terms of dark matter mass, and some regions of high dark matter overdensity contain no SMGs. Because of their rarity, Poisson noise causes scatter in the SMG overdensity at fixed dark matter overdensity. Consequently, rich associations of less-luminous, more-abundant galaxies (i.e. Lyman-break galaxy analogues) trace the highest dark matter overdensities much better than SMGs. Even on average, SMG associations are relatively poor tracers of the most significant dark matter overdensities because of ‘downsizing’: at , the most-massive galaxies that reside in the highest dark matter overdensities have already had their star formation quenched and are thus no longer SMGs. At a given redshift, of the 10 per cent most-massive overdensities, only per cent contain at least one SMG, and less than a few per cent contain more than one SMG.
keywords:
cosmology: theory – cosmology: large-scale structure of Universe – galaxies: clusters: general – galaxies: high-redshift – methods: numerical – submillimeter: galaxies.1 Introduction
Submillimetre-selected galaxies (SMGs; see Casey et al. 2014 for a recent review), with typical infrared (IR) luminosities of L⊙, represent the rarest and most extreme examples of star forming galaxies. The of an SMG implies an immense star formation rate, typically M⊙ yr-1, assuming that there is not a significant contribution to from deeply obscured AGN. SMGs allow us to probe the mechanisms behind most intense star formation events in the Universe and can elucidate the highest SFRs sustainable in a galaxy. Because of their extreme nature, SMGs provide laboratories to test the limits of hydrodynamical simulations of galaxies (e.g. Narayanan et al., 2010; Hayward et al., 2011; Hayward, 2013).
Massive starburst galaxies appear to grow in the most massive halos (Hickox et al., 2012), thus making them potential tracers for the highest-redshift proto-clusters (e.g. Capak et al., 2011; Walter et al., 2012). Thus, observations of bright SMGs should probe their environment and trace significant overdensities that can be interpreted in the context of large-scale structure simulations. Therefore, SMGs set critical constraints on cosmological models.
Interest in SMG associations has grown in recent years as increasing numbers of SMG associations have been detected (e.g. Blain et al., 2004; Chapman et al., 2005, 2009; Geach et al., 2005; Daddi et al., 2009; Dannerbauer et al., 2014; MacKenzie et al., 2014; Smail et al., 2014). Furthermore, Clements et al. (2014) have demonstrated that some Planck sources trace overdensities of dusty star-forming galaxies, and they suggested that such observations can be used to investigate the epoch of galaxy cluster formation. However, this claim relies on the assumption that overdensities of dusty star-forming galaxies correspond to galaxy clusters in the process of formation.
There is some observational evidence that calls this claim into question: in their study of the GOODS-N field, Chapman et al. (2009) found an association of 8 SMGs at . The associated structure was only a typical overdense region, as indicated by the well-sampled optical spectroscopy in this region, that would not form a virialized cluster by . Moreover, Blain et al. (2004) found that the clustering length of SMGs is consistent with that of evolved ‘extremely red objects’ (EROs) at and clusters, which would suggest that the descendants of SMGs would tend to be found in rich cluster environments; however, this interpretation implies a comoving space density of clusters that is at least an order of magnitude greater than that observed. These results suggest that perhaps associations of SMGs trace particularly active phases in relatively modest-mass overdensities rather than the highest overdensities and thus have a relatively complex clustering bias.
To test this possibility, we have performed a counts-in-cells analysis on the Hayward et al. (2013a, hereafter H13) simulated SMG catalogues to investigate the relationships of SMGs and more modestly star-forming galaxies to the underlying dark matter structure. We first investigate the clustering biases of SMGs and Lyman-break-galaxy (LBG) analogues. We then study the properties of individual associations of SMGs and LBG analogues.
2 Methods
To analyze the bias in the SMG population, we use the mock SMG catalogues of H13, which were generated by assigning galaxy properties to dark matter haloes from a cosmological collisionless dark matter simulation using subhalo abundance matching and then assigning submm flux densities using a fitting function derived from the results of performing radiative transfer on idealized hydrodynamical simulations. We will summarize the H13 methodology here, and we refer the reader to H13 for full details.
Using halo catalogues from the Bolshoi simulation (Klypin, Trujillo-Gomez, & Primack 2011; Behroozi et al. 2013b, c), we constructed mock lightcones by starting at eight random locations within the simulation and selecting haloes along a randomly oriented sightline with an 84’ x 84’ (1.96 deg2) field of view from to . We calculated cosmological redshifts, including the effects of halo peculiar velocities. We then assigned stellar masses () and SFRs using the redshift-dependent stellar mass–halo mass and SFR–halo mass relations of Behroozi, Wechsler, & Conroy (2013a), which include scatter at fixed halo mass and redshift. We included a simple model for satellite quenching: satellite SFRs were reduced by a factor equal to their current subhalo mass divided by the peak mass in their subhalo’s mass accretion history. We assigned dust masses () to the haloes using the empirically based method of Hayward et al. (2013b). Finally, we assigned 850-m flux densities () using the following fitting function, which was derived based on the results of performing dust radiative transfer on hydrodynamical simulations of idealized disc galaxies and mergers (Hayward et al., 2011, 2013b):
| (1) |
where we incorporated the scatter in the relation of 0.13 dex (Hayward et al., 2011) when assigning . Note that because scales sublinearly with both SFR and , the predicted values are relatively insensitive to the model details. Furthermore, the – relation predicted in this manner agrees well with that observed (Davies et al., 2013).
Throughout this work, we refer to mock galaxies with mJy as SMGs (the median SFR for sources with mJy is ) and those with mJy as LBGs (this range corresponds to median SFR values of ). We study the bias of SMGs and LBGs and identify SMG and LBG associations (or redshift spikes; e.g. Chapman et al. 2005, 2009) using a simple counts-in-cells analysis (e.g. Adelberger et al., 1998). Specifically, we divide each of the 8 mock catalogues into cells with angular dimensions 10 arcmin 10 arcmin and depth ; the results are similar if we use cells with side lengths equal to twice these values. We use a subset of 10,000 of these cells for calculating the clustering bias and for making comparisons to the properties of SMG and LBG associations; we refer to these cells as ‘random cells’. To identify associations, we start with the same cells. However, to ensure that we do not divide potential associations by using a fixed grid, we shift the cells by 1-arcmin intervals 10 times and define an SMG (LBG) association as the galaxies contained in the cell that contains the maximum number of SMGs (LBGs). We ensure that we do not count a single association multiple times. We calculate total dark matter masses for each cell by summing the dark matter masses of all haloes of mass (because the Bolshoi simulation is incomplete below this halo mass) contained in the cell.
As discussed in detail in H13, the H13 model does not include the effect of starbursts (i.e. the extended tail to high SFR at a given stellar mass and redshift). Because one would expect that interaction-induced starbursts would most affect the SFRs of SMGs in highly overdense regions and thus potentially alter our results, we have extended the H13 model by including a model for interaction-induced starbursts. For each galaxy, we check whether it has a neighboring galaxy with stellar mass within a factor of 3 of its own (such that the pair would constitute a ‘major’ merger) that is located within a physical distance of . If so, the SFRs of both galaxies are boosted by a factor of . If the separation is less than , we instead boost the SFRs by a larger factor, . We experimented with different reasonable parameter values, as judged based on the results of idealized hydrodynamical simulations of mergers (e.g. Cox et al., 2008; Torrey et al., 2012; Hayward et al., 2014), and found that the results were qualitatively unaffected even for the extreme scenario of kpc, , kpc, and . However, it is important to note that the catalogues are incomplete for mergers with small separations (Behroozi et al., 2013b), which would result in an underestimate of the number of interacting galaxies. Nevertheless, this incompleteness likely does not affect our results because although interactions could boost the submm fluxes of some galaxies and increase the clustering signal on kpc scales, the clustering on larger scales should be unaffected. In all figures, we show the results for the original H13 model, but the corresponding plots for the boosted models are similar.
Note that unlike H13, we have not incorporated the effects of blending of multiple galaxies into a single submm source in this work, although theoretical arguments (Hayward et al. 2011, 2012, 2013b; H13) and observations (e.g. Karim et al., 2013; Hodge et al., 2013) suggest that blending significantly affects the single-dish-detected SMG population. The reason is that the sizes of the associations are much greater than the beam sizes of single-dish submm telescopes (see below). Thus, although the detailed results could be affected by blending, our conclusions would be unchanged if blending were incorporated. Furthermore, we wish to analyze how well individual submm-bright galaxies, which would be resolved by e.g. the Atacama Large Millimeter Array, rather than blended submm sources (which depend on the beam size of the instrument used to detect them and are thus a less general population than resolved sources) trace dark matter structures.
3 Results
For each cell, we calculate the number overdensity of SMGs () and LBGs () using the following equation:
| (2) |
where is the number of galaxies in a cell and is the mean number of galaxies per cell. We also calculate the dark matter mass overdensity of each cell,
| (3) |
where is the mass of dark matter in a cell and is the mean dark matter mass per cell.
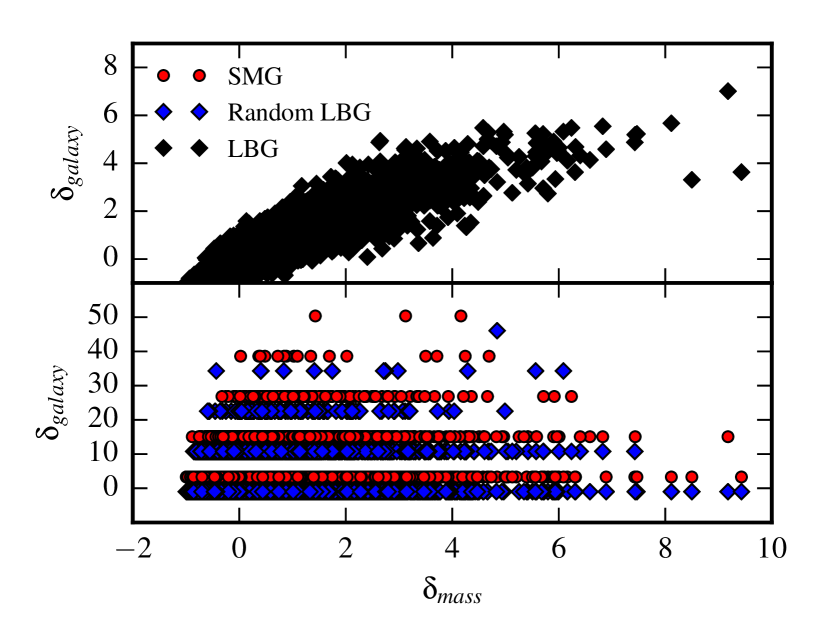
Fig. 1 shows the overdensity of SMGs ( mJy; red circles), LBGs (0.1 mJy 1 mJy; black diamonds) and a random subset of LBGs selected to have number density equal to that of the SMGs (blue diamonds) vs. overdensity of dark matter, , for the random cells. For the total LBG population, and are tightly correlated, which indicates that LBG overdensities are good tracers of dark matter overdensities. The slope of the best-fitting linear relation (i.e. the bias, ) is , and the mean squared error (MSE) is 0.1. For the SMGs and random subset of LBGs, there is a correlation between and , but it exhibits significant scatter. The bias values are and for the SMGs and LBGs, respectively, and the MSE values are 17 and 16. The fact that the SMGs and random LBGs exhibit similar scatter indicates that Poisson noise due to the rarity of SMGs is the reason for the complicated relationship between and for this population. Thus, although SMGs are slightly more biased than LBGs, SMG overdensities are poor tracers of the underlying dark matter overdensities. This effect may explain the results of Blain et al. (2004) discussed above.
[ caption = Demographics of SMG associations, center, notespar ]lccc \tnote[a]Number of SMGs in a cell. \tnote[b]Percentage of SMGs in such associations. \tnote[c]Median mass of such associations at . \tnote[d]Median pairwise separations of SMGs in such associations. \FL\tmark[a] & Percentage\tmark[b] Mass\tmark[c] Separation\tmark[d] \NN () (Mpc) \ML1 64 – \NN2 23 7.6 \NN3 10 6.1 \NN4 2 5.2 \NN5 0.8 4.3 \NN6 0.2 4.6 \LL
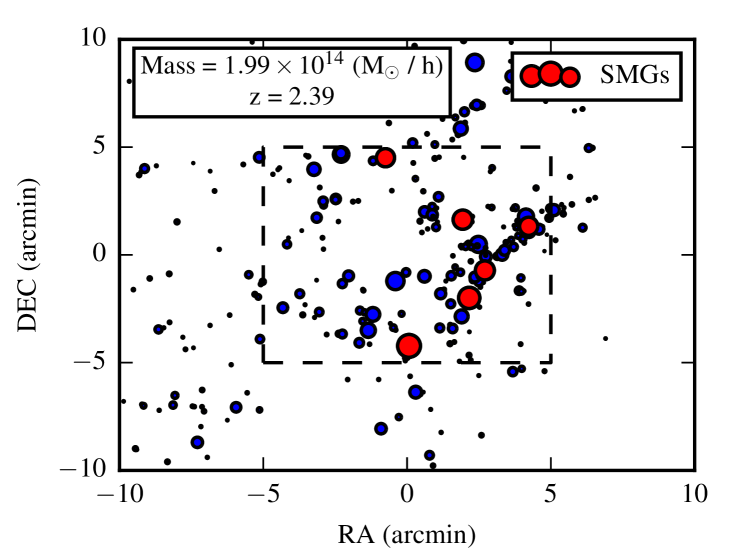
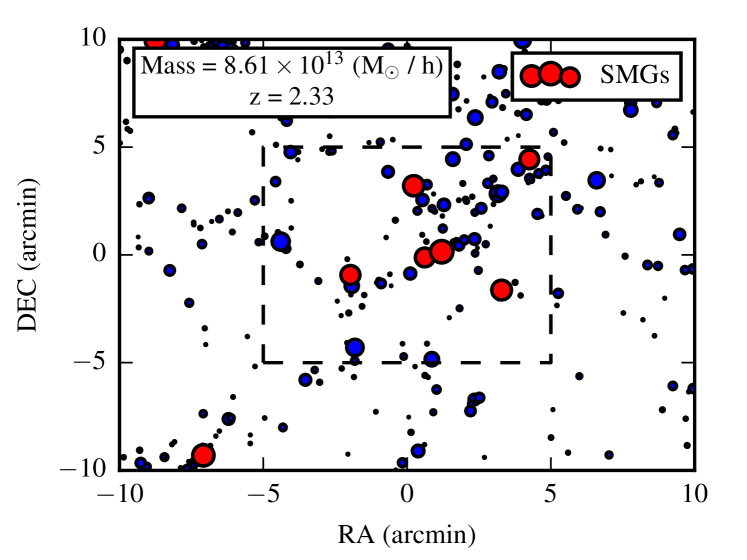
We now investigate the properties of individual SMG and LBG redshift associations in detail. Table 3 presents the fraction of SMGs in associations and the median separation of the SMGs in the different types of associations. Typical SMGs are not in associations, but a substantial minority (36 per cent) are. Only a few per cent of SMGs are located in rich associations of four or more SMGs. The richer associations exhibit lower median separations, which suggests that these associations correspond to higher overdensities (which will be confirmed below). Fig. 2 shows the spatial distributions of the SMGs and LBGs in two mock SMG associations. The associations each contain 6 SMGs. The spatial distributions of the galaxies exhibit clear filamentary structures, which reflect the underlying structure of the ‘cosmic web’. Note that incorporating blending (using a typical beam of arcsec) would tend to increase the submm fluxes of the LBGs and blend the SMGs with LBGs, but it would not blend any of the bright SMGs. Thus, a blended version would potentially contain additional bright SMGs and therefore be comparable to observed SMG associations (e.g. Chapman et al., 2009; Dannerbauer et al., 2014).
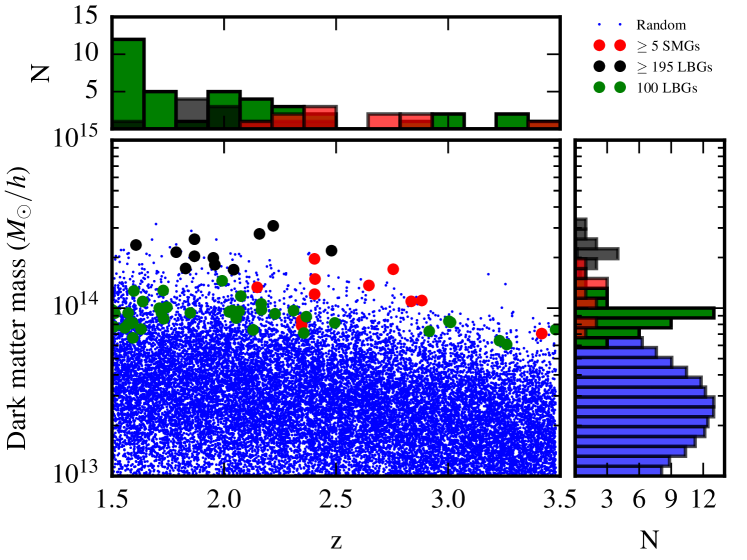
Our goal is to understand how well SMG associations trace the highest dark matter overdensities. To do so, it is instructive to compare the total dark matter mass in individual cells that are identified as SMG or LBG associations with the values for randomly selected cells. If SMG associations trace the most significant overdensities, these cells should contain more dark matter mass than other cells at a given redshift. The left panel of Fig. 3 shows the total dark matter in a given cell versus the redshift of the cell for cells that contain SMGs (red circles), the 10 richest LBG associations ( LBGs in a cell; black circles), cells that contain exactly 100 LBGs (green circles), and a subset of randomly selected cells (blue points). The redshift and dark matter mass distributions are shown next to the respective axes.
It is immediately clear that the SMG associations do not trace the most significant dark matter overdensities, although they do trace relatively high overdensities. Compared with the richest LBG associations, which should be considered analogous to observed associations (i.e. redshift spikes) of LBGs, the SMG associations tend to have lower dark matter masses (a median of for the SMG associations compared with for the LBG associations) and are located at higher redshifts (the median values for the SMG and LBG associations are 2.4 and 2.0, respectively). Furthermore, there are many randomly selected cells that have dark matter masses that are comparable to or even greater than the values for the SMG associations, whereas the richest LBG associations more faithfully trace the cells with the largest dark matter masses.
For comparison, we show more-modest LBG associations that contain exactly 100 LBGs (green circles). As expected, these LBG associations trace less massive substructures than the richest LBG associations. The median dark matter mass of the 100-LBG associations is similar to that of the SMG associations, , but the 100-LBG associations span a broader range of redshifts.
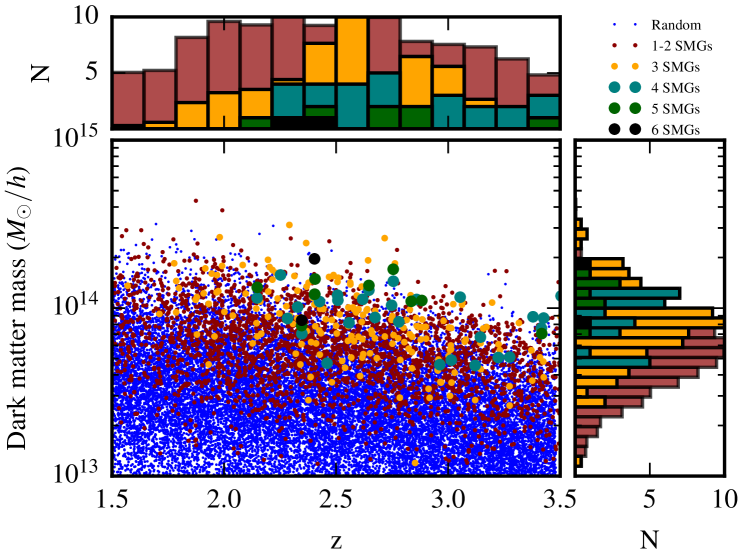
The right panel of Fig. 3 shows the total dark matter mass in a cell versus redshift of the cell for cells that contain one or more SMGs (coloured according the number of SMGs). This figure demonstrates multiple interesting results: first, many of the highest dark matter overdensities at a given redshift contain no SMGs (the blue points with dark matter mass ). At a given redshift, of the 10 per cent most-massive overdensities, only per cent contain at least one SMG, and less than a few per cent contain more than one SMG. Consequently, finding dark matter overdensities using SMGs as signposts will cause one to miss many of the highest overdensities. Second, cells with lower numbers of SMGs tend to have less dark matter. Finally, the minimum mass necessary for a cell to host an SMG is , which is consistent with the results of inferences from the clustering of real SMGs (Hickox et al., 2012).
4 Summary and Discussion
We have used mock SMG catalogues to demonstrate that SMG associations are poor tracers of the highest overdensities of dark matter. At higher redshifts (), the richest SMG associations trace some of the highest overdensities because the most-massive galaxies in those regions are still forming stars rapidly. However, such associations are rare, and the majority of the highest overdensities do not host a single SMG, let alone an SMG association. Consequently, SMG associations are highly incomplete tracers of the highest overdensities even at . The situation is worse at : many of the most-massive galaxies, which reside in the highest dark matter overdensities, have already had their star formation quenched. (Independently of redshift, the halos with the highest ratio of SFR to halo mass are those with halo masses of at that redshift; e.g. Behroozi et al. 2013a; Moster et al. 2013; Sparre et al. 2015.) Consequently, the dark matter overdensities are less likely to contain SMGs.
In our model, galaxy SFRs are assigned using a redshift-dependent SFR–halo mass relation and a model for satellite quenching. The parameters of the model are constrained by fitting to a wide range of observations (Behroozi et al., 2013a). Consequently, the fact that some fraction of massive galaxies are quenched even at is not a prediction. The utility of our model is that it can be used to determine the consequences of quenching/downsizing for the clustering of the SMG population. Furthermore, because we determine the submm flux densities of our galaxies self-consistently using a fitting function derived from radiative transfer calculations, there is not a monotonic mapping between SFR and submm flux density (a galaxy with a relatively modest SFR can still be submm-bright if it has sufficiently high dust mass). Thus, the results are specific to the SMG population rather than just the most rapidly star-forming galaxies (cf. Davé et al. 2010). Finally, our model explicitly accounts for the stochasticity that is inherent in the SMG selection because bright SMGs are an extreme population; thus, one may select a galaxy as an SMG because it is in a short-lived phase of elevated SFR (perhaps due to an interaction) or because it has an especially high submm flux density for its SFR and dust mass (because of e.g. an especially extended geometry). GN20 could be a real-Universe example of the latter. Consequently, Poisson noise contributes to the scatter in the value of at a given and causes some of the most significant overdensities to contain few or no bright SMGs. Moreover, our model suggests that some the brightest SMGs in the Universe may lie in relatively isolated massive dark matter halos, consistent with observational findings (Chapman et al., 2015).
A few other theoretical works have investigated the clustering of the SMG population. Davé et al. (2010) studied the properties of the most rapidly star-forming galaxies, which they considered SMG analogues, in a cosmological hydrodynamical simulation. Because of the tight, monotonic SFR–stellar mass relation for star-forming galaxies in their simulation, they effectively selected the most-massive star-forming galaxies in their simulation. Consequently, they found that their simulated SMGs were highly clustered and biased, with a correlation length comoving Mpc and bias of .
Cowley et al. (2015b) analyzed the clustering of SMGs in the current Durham semi-analytical model (Cowley et al. 2015a; Lacey et al., in preparation). In this model, bright ( mJy) SMGs at exhibit a correlation length of Mpc and a bias of . Both the correlation length and bias are almost independent of (at least for mJy), which is qualitatively consistent with our results (i.e. galaxies in high overdensities are not necessarily submm-bright). Interestingly, similar results were obtained for a previous version of the model in which the physical nature of the SMGs was qualitatively very different (Almeida et al., 2011).111In the current model, SMGs are predominantly starbursts driven by disk instabilities, and a mildly top-heavy initial mass function is used in starbursts. In the previous model, SMGs were predominantly very gas-rich galaxies undergoing starbursts driven by minor mergers, and a flat IMF was assumed for starbursts. However, the current model better matches the angular power spectrum of cosmic infrared background (CIB) anisotropies Cowley et al. (2015b) than did the previous model, which suggests (perhaps unsurprisingly) that the CIB may provide more insight into the nature of SMGs than clustering does.
Granato et al. (2014) performed dust radiative transfer on simulated (proto-)clusters at to determine whether they could reproduce the properties of the Planck sources of Clements et al. (2014). They found that their simulated (proto-)clusters had lower total SFRs than inferred from observations. This tension suggests that associations of dusty galaxies should be investigated further both in terms of theory and observation.
It is worthwhile to clarify why we have claimed that SMGs are ‘poor tracers’ of high overdensities. In our model, the -SMG associations each lie in one of the most-massive cells at their respective redshifts. In this sense, SMG associations do trace high overdensities. However, such associations are uncommon (there are 11 in our deg2 mock catalogue), which is consistent with the fact that only a few overdensities of bright SMGs have been reported in the literature (Tamura et al., 2009; Chapman et al., 2009; Dannerbauer et al., 2009; Ma et al., 2015). Moreover, at , almost none of the highest overdensities contain SMGs despite a large fraction of the SMG population being located at . Thus, searching for high overdensities using SMG associations as beacons would result in a very incomplete sample at best.
Overall, our results urge caution when interpreting SMG associations in the context of large-scale structure. Because of their rarity, Poisson noise causes significant scatter in the SMG overdensity at fixed dark matter overdensity (i.e. SMGs stochastically sample the highest overdensities). Consequently, although the highest-redshift SMG associations trace some of the highest dark matter overdensities at those redshifts, most of the highest overdensities do not host SMG associations. At lower redshifts (), the situation is worse: the highest overdensities tend to contain only a few SMGs at most, and the majority do not contain a single SMG. Thus, if one wishes to identify protoclusters, the complicated bias of SMGs makes them less-than-ideal beacons.
Acknowledgements
We thank Neal Katz for useful discussion and Phil Hopkins for comments on the manuscript. We thank the anonymous referee for a constructive report that
helped improve the manuscript. CCH is grateful to the Gordon and Betty Moore
Foundation for financial support and acknowledges the hospitality of the Aspen Center for Physics, which is supported by the National Science
Foundation Grant No. PHY-1066293. PSB was supported by a Giacconi Fellowship provided through the Space Telescope Science Institute,
which is operated by the Association of Universities for Research in Astronomy under NASA contract NAS5-26555.
References
- Adelberger et al. (1998) Adelberger K. L., Steidel C. C., Giavalisco M., Dickinson M., Pettini M., Kellogg M., 1998, ApJ, 505, 18
- Almeida et al. (2011) Almeida C., Baugh C. M., Lacey C. G., 2011, MNRAS, 1312
- Behroozi et al. (2013a) Behroozi P. S., Wechsler R. H., Conroy C., 2013a, ApJ, 770, 57
- Behroozi et al. (2013b) Behroozi P. S., Wechsler R. H., Wu H.-Y., 2013b, ApJ, 762, 109
- Behroozi et al. (2013c) Behroozi P. S., Wechsler R. H., Wu H.-Y., Busha M. T., Klypin A. A., Primack J. R., 2013c, ApJ, 763, 18
- Blain et al. (2004) Blain A. W., Chapman S. C., Smail I., Ivison R., 2004, ApJ, 611, 725
- Capak et al. (2011) Capak P. L. et al., 2011, Nature, 470, 233
- Casey et al. (2014) Casey C. M., Narayanan D., Cooray A., 2014, PhysRep, 541, 45
- Chapman et al. (2015) Chapman S. C. et al., 2015, arXiv:1503.02195
- Chapman et al. (2009) Chapman S. C., Blain A., Ibata R., Ivison R. J., Smail I., Morrison G., 2009, ApJ, 691, 560
- Chapman et al. (2005) Chapman S. C., Blain A. W., Smail I., Ivison R. J., 2005, ApJ, 622, 772
- Clements et al. (2014) Clements D. L. et al., 2014, MNRAS, 439, 1193
- Cowley et al. (2015a) Cowley W. I., Lacey C. G., Baugh C. M., Cole S., 2015a, MNRAS, 446, 1784
- Cowley et al. (2015b) Cowley W. I., Lacey C. G., Baugh C. M., Cole S., 2015b, ArXiv e-prints
- Cox et al. (2008) Cox T. J., Jonsson P., Somerville R. S., Primack J. R., Dekel A., 2008, MNRAS, 384, 386
- Daddi et al. (2009) Daddi E. et al., 2009, ApJ, 694, 1517
- Dannerbauer et al. (2009) Dannerbauer H., Daddi E., Riechers D. A., Walter F., Carilli C. L., Dickinson M., Elbaz D., Morrison G. E., 2009, ApJL, 698, L178
- Dannerbauer et al. (2014) Dannerbauer H. et al., 2014, A&A, 570, A55
- Davé et al. (2010) Davé R., Finlator K., Oppenheimer B. D., Fardal M., Katz N., Kereš D., Weinberg D. H., 2010, MNRAS, 404, 1355
- Davies et al. (2013) Davies L. J. M., Bremer M. N., Stanway E. R., Lehnert M. D., 2013, MNRAS, 433, 2588
- Geach et al. (2005) Geach J. E. et al., 2005, MNRAS, 363, 1398
- Granato et al. (2014) Granato G. L., Ragone-Figueroa C., Dominguez-Tenreiro R., Obreja A., Borgani S., De Lucia G., Murante G., 2014, arXiv:1412.6105
- Hayward (2013) Hayward C. C., 2013, MNRAS, 432, L85
- Hayward et al. (2013a) Hayward C. C., Behroozi P. S., Somerville R. S., Primack J. R., Moreno J., Wechsler R. H., 2013a, MNRAS, 434, 2572 (H13)
- Hayward et al. (2012) Hayward C. C., Jonsson P., Kereš D., Magnelli B., Hernquist L., Cox T. J., 2012, MNRAS, 424, 951
- Hayward et al. (2011) Hayward C. C., Kereš D., Jonsson P., Narayanan D., Cox T. J., Hernquist L., 2011, ApJ, 743, 159
- Hayward et al. (2013b) Hayward C. C., Narayanan D., Kereš D., Jonsson P., Hopkins P. F., Cox T. J., Hernquist L., 2013b, MNRAS, 428, 2529
- Hayward et al. (2014) Hayward C. C., Torrey P., Springel V., Hernquist L., Vogelsberger M., 2014, MNRAS, 442, 1992
- Hickox et al. (2012) Hickox R. C. et al., 2012, MNRAS, 421, 284
- Hodge et al. (2013) Hodge J. A. et al., 2013, ApJ, 768, 91
- Karim et al. (2013) Karim A. et al., 2013, MNRAS, 432, 2
- Klypin et al. (2011) Klypin A. A., Trujillo-Gomez S., Primack J., 2011, ApJ, 740, 102
- Ma et al. (2015) Ma C.-J. et al., 2015, ArXiv e-prints
- MacKenzie et al. (2014) MacKenzie T. P. et al., 2014, MNRAS, 445, 201
- Moster et al. (2013) Moster B. P., Naab T., White S. D. M., 2013, MNRAS, 428, 3121
- Narayanan et al. (2010) Narayanan D., Hayward C. C., Cox T. J., Hernquist L., Jonsson P., Younger J. D., Groves B., 2010, MNRAS, 401, 1613
- Smail et al. (2014) Smail I. et al., 2014, ApJ, 782, 19
- Sparre et al. (2015) Sparre M. et al., 2015, MNRAS, 447, 3548
- Tamura et al. (2009) Tamura Y. et al., 2009, Nature, 459, 61
- Torrey et al. (2012) Torrey P., Cox T. J., Kewley L., Hernquist L., 2012, ApJ, 746, 108
- Walter et al. (2012) Walter F. et al., 2012, Nature, 486, 233