Probing First Galaxies and Their Impact on the Intergalactic Medium through the 21-cm Observation of the Cosmic Dawn with the SKA
Abstract:
We present an overview of the theory of high-redshift star and X-ray source formation, and how they affect the 21-cm background. Primary focus is given to Ly pumping and X-ray heating mechanisms at cosmic dawn, opening a new observational window for high-redshift astrophysics by generating sizable fluctuations in the 21-cm background. We describe observational prospects for power spectrum analysis and 3D tomography (imaging) of the signature of these early astrophysical sources by SKA1-LOW and SKA2.
1 Introduction
The early phase of the Epoch of Reionization (EoR) or Cosmic Dawn (CD) is, by definition, believed to have started with the formation of the first stars, even though the EoR may also have been fuelled initially by somewhat unconventional radiation sources such as annihilating dark matter clumps (e.g. Spolyar et al. 2009). The first stars are believed to have formed within minihalos (halos with , or ) and to have been massive, emitting a sufficient amount of UV radiation to ionize the surrounding hydrogen and helium. These stars were born at zero metallicity, with their formation predominantly regulated by cooling, and thus they are also Population III (Pop III) stars. Until recently the conventional view, from high-resolution numerical simulations, was of massive () stars forming in isolation (e.g. Abel et al. 2002; Bromm et al. 2002; Yoshida et al. 2006): one Pop III star per minihalo. This paradigm has undergone recent revision due to newer simulations in which smaller-mass () stars form binary systems (Turk et al. 2009; Stacy et al. 2010; Greif et al. 2011a), although the universality of this result is unclear (see Hirano et al. 2014 for a wide spectrum of Pop III stars in minihalos). At any rate, a change in the initial mass function (IMF) of Pop III stars affects the hardness of the spectral energy distribution (SED) of these stars, and thus the CD and EoR modelling as well. Stellar binaries may evolve into X-ray binaries that may, if efficient, result in a smoother ionization structure of the intergalactic medium (IGM) than that by UV sources, due to a much longer mean free path than that of typical UV photons (e.g. Haiman 2011; Mesinger et al. 2013 and references therein). Furthermore, the interstellar medium heated by supernova explosions can cool through a combination of Bremsstrahlung and metal line cooling, producing soft (keV) X-rays that can efficiently heat the high-redshift IGM (Pacucci et al. 2014).
The theory of the formation and evolution of the first stars, therefore, is crucial in modelling CD and even the EoR, because the metallicity built up after the death of Pop III stars will give way to the formation of Population II (Pop II) stars, believed to be the main drivers of reionization. A major feedback that affects their formation is the dissociation of molecules – cooling agents – inside minihalos by Lyman-Werner band radiation (e.g. Haiman et al. 2000; for recent simulations with this effect in Mpc box see e.g. Ahn et al. 2012 and Fialkov et al. 2013). Stars would not have formed either in minihalos that were embedded in photoionized gas (), since the increase in pressure would have suppressed minihalo gas accretion (Jeans-mass filtering).
There also appeared a noteworthy discovery having to do with the nature of large scale fluctuations. Tseliakhovich & Hirata (2010) used a peak-background split scheme to study the nonlinear evolution of the baryon/dark-matter velocity offset, which was seeded at the recombination epoch, and found that hydrodynamics at scales relevant to minihalo formation should have been affected (see more details of its astrophysical impact in the subchapter by Maio). The typical offset is found to be e.g. km/s at , corresponding to , when minihalos were already abundant. While determination of the halo mass and environmental dependence of this effect awaits more detailed study, simulations already show an increase in the threshold mass for star formation and a delay in halo collapse (Stacy et al. 2011; Greif et al. 2011b; O’Leary & McQuinn 2012). More importantly, this nonlinear effect may shock-heat the gas globally, introducing a new feature into the power spectrum that corresponds to the relative velocity fluctuations (McQuinn & O’Leary 2012). When the global shock-heating is efficient, this new feature could even dominate over the power spectrum of linear density perturbations and amplify the baryon acoustic oscillation (BAO) feature. Due to the uncertainties in the efficiency of this shock-heating, however, the actual amplitude of the power spectrum due to relative velocity fluctuations is still uncertain.
From an observational perspective on CD and the EoR, especially in terms of 21-cm power spectrum analysis, it is convenient to mark three prominent epochs: (1) the Ly-pumping epoch, when the IGM is strongly coupled to through Wouthysen-Field effect with a high Ly intensity, (2) the X-ray heating epoch, when the IGM is gradually heated to beyond by X-ray heating and (3) the EoR, when H II bubbles in cosmological scales form in a patchy way. It is generally believed that CD commences with the Ly-pumping epoch, followed by the X-ray heating epoch, and finally occurs the EoR, whose sequence is rather robust unless 1-2 order-of-magnitude changes in the fiducial astrophysical parameters are allowed (Furlanetto 2006; McQuinn & O’Leary 2012; Mesinger et al. 2014). Very conveniently, the early phase of each epoch boosts the spatial fluctuation of , sequentially dominated by the patchiness in the Ly intensity, the IGM temperature, and the ionized fraction, respectively, extending the observational window to very high redshifts.
While challenging, it should be possible to observe individual objects via tomography, which may be as small as the first galaxies. When UV sources are embedded in an IGM colder than the CMB, a “Ly sphere” forms around the radiation source and a strong 21-cm absorption trough forms. When UV sources are accompanied by X-ray sources, the central, heated region is seen in emission, which is still surrounded by an absorption trough or an absorption plateau (e.g. Tozzi et al. 2000; Cen 2006; Chuzhoy et al. 2006; Chen & Miralda-Escudé 2008; Alvarez et al. 2010). A simulation of the formation and evolution of Pop III and II stars in a rare density peak, together with the X-ray binaries, shows that this ubiquitous feature will be observable by SKA2-LOW with 1000-hour integration, and marginally by SKA1-LOW (Ahn et al. 2014) with very aggressive integration at (Section 3).
2 Power Spectrum Analysis
Because many independent modes with similar wavenumbers () are averaged over to form the 3D power spectrum, , power spectrum analysis has higher sensitivity than imaging in general. In addition, nature cooperates in such a way that three important physical processes – Ly pumping, X-ray heating and patchy reionization – may sequentially boost 21-cm fluctuations to give a roughly constant S/N ratio over redshift, even though the foreground increases rapidly towards high redshift (e.g. Mesinger et al. 2014). Overall, the signal and the foreground noise grow roughly at a similar rate to yield S/N, although the S/N ratio should eventually become very small () at (Pritchard & Loeb, 2008).
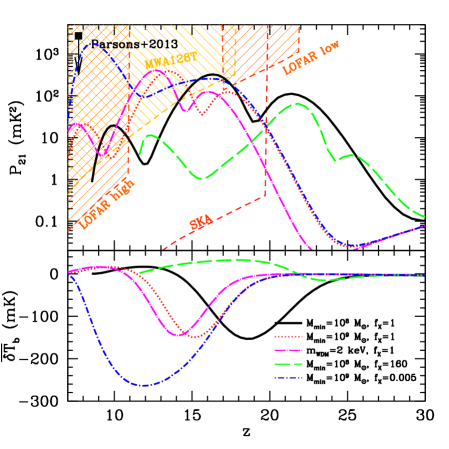
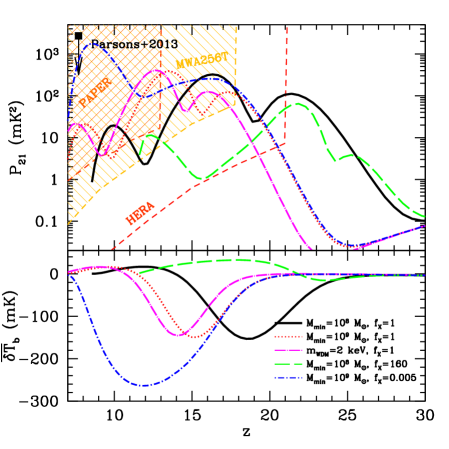
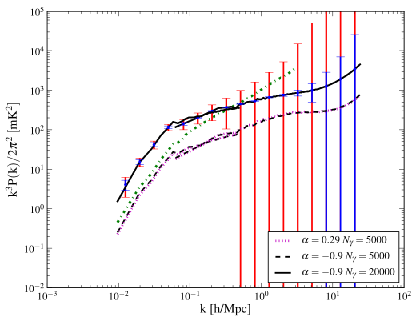
The very first light from astrophysical sources to which the IGM is exposed is the stellar continuum below the hydrogen Lyman limit, or photons with energy , because ionizing photons (photons above the Lyman limit) are quickly absorbed by the neutral hydrogen and helium around while continuum photons are not. However, there is always some fraction of this continuum that is absorbed in Lyman series resonances as photons redshift over cosmological distances (e.g. Ahn et al. 2009). After absorption, cascades over the energy levels and multiple scattering of reemitted photons will convert about of those absorbed photons to Lyman- photons (Hirata 2006; Pritchard & Furlanetto 2006). Even in the presence of density inhomogeneities, a point source produces a nearly spherical profile (Vonlanthen et al. 2011) that shows a step-wise feature decreasing more steeply than (Pritchard & Furlanetto 2006). As usually assumed, the IGM is still much colder than the CMB, and thus the regions where the Ly pumping becomes strong ( ) will show strong absorption, or . Source clustering and the steep radial profile of the Ly intensity around each source are the dominant sources of fluctuations in at earliest times. Soon thereafter, saturation occurs, and fluctuations decrease as sources grow in abundance and everywhere (Fig. 1). Changes in the spectral energy distribution (SED) of sources can affect the resulting power spectrum as demonstrated by Santos et al. (2011) (Fig. 2), while other systematic effects such as the star formation efficiency might make the prediction somewhat degenerate.
In many models, the Ly pumping epoch is followed by the X-ray heating epoch. X-ray photons have a much longer mean free path than UV photons, and partially ionize the IGM by leaving behind energetic electrons as they traverse cosmological distances. These electrons can then ionize, excite, and heat the IGM. During the early phase of the X-ray heating epoch, the overall ionization level caused by X-rays is usually very small unless the X-ray emissivity is very high (see e.g. Mesinger et al. 2013). Thus the dominant contribution from X-rays to fluctuations in is inhomogeneous heating, which will boost the power spectrum again (Fig. 1). Another contribution to fluctuations is due to inhomogeneous Ly pumping from excited hydrogen atoms (see e.g. Chen & Miralda-Escudé 2008), though its contribution is usually subdominant compared to the Ly pumping induced by stellar UV photons (but see e.g. Ahn et al. 2014 for a significant contribution when X-ray source formation is very efficient). It is usually expected that X-ray heating epoch produces the highest peak in the large-scale power spectrum in its redshift evolution (Fig. 1). Later, X-ray heating will become very efficient everywhere in the Universe such that and but with the ionization state still low, once again saturating the fluctuations and resulting in a significant decrease in the amplitude of the power spectrum (Fig. 1). This rise, peak and fall in the power spectrum amplitude results in the second “bump” seen in figure 1. Note that this provides the best window for high-z cosmology, because becomes proportional to the baryon density and nearly insensitive to other fluctuations. In addition, separating the matter power spectrum from that of the radiation fields, utilizing the impact by the peculiar motion (or the so-called -decomposition scheme which is very similar to that used in galaxy survey programs), may be possible (McQuinn et al. 2006; Mao et al. 2012; see also the subchapter by Pritchard).
Finally comes the main EoR, in most models. The power spectrum is boosted again, due to the patchiness of H II regions where and neutral regions where is proportional to the baryon density. Final saturation and power spectrum suppression occurs as bubbles overlap and the EoR approaches its final phase (e.g. Iliev et al. 2012), to generate the final bump in the power spectrum evolution (Fig. 1). Of course, one should allow more model variants. Currently, the X-ray emissivity at CD and during the EoR is still largely unknown, other than the weak constraint coming from the soft X-ray background (e.g. Dijkstra et al. 2004; McQuinn 2012), the QSO absorption lines and the reionization histories of H I and He II (McQuinn 2012). This allows a wide model variation in the X-ray heating epoch, and thus the 3-bump feature in the power spectrum (Fig. 1) is not ubiquitous among reionization models if extreme cases are allowed (Pritchard & Loeb 2012). The halo mass spectrum responsible for reionization is not well constrained either, allowing models with a significant contribution from minihalos (e.g. Wyithe & Cen 2007; Ahn et al. 2012).
The sweet spot for power spectrum analysis exists around , guaranteeing a large S/N over a wide range of redshifts while being mostly unaffected by the filtering of low- foreground modes. SKA1-LOW (and the 50% capability of SKA1-LOW as well) has a large enough S/N ratio for observing for with 1000-hour integration, and SKA2-LOW will allow one to achieve similar S/N ratio for even larger ’s with more extended redshift coverage, (Fig. 1; see also Baek et al. 2010 for the evolution of other wavemodes). As is usually the case for CD and the EoR, pushing the observable redshift to or is strongly favored, in order to probe their early phases.
3 Tomography
As mentioned in Section 2, imaging is more difficult than power spectrum analysis. While the power spectrum contains a lot of information on the underlying astrophysics and cosmology, one should note that the 3D tomography (imaging) is indeed a more direct observation because one cannot invert to obtain the actual image unless the 21cm field is Gaussian (see also the subchapter by Mellema).
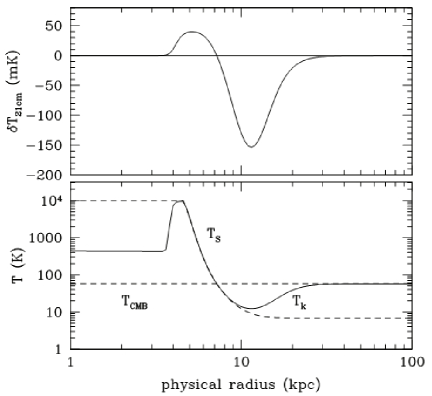
Imaging can probe physical properties of radiation sources. One interesting feature is that due to the step-wise decrease of Ly intensity (or Ly pumping) in addition to the geometrical dilution, , the radial profile of the 21-cm signal around an isolated source will also exhibit a step-wise variation, or multiple “rings” (Vonlanthen et al. 2011; Fig. 3a). Detecting the multiple-ring feature from one radiation source remains, however, very difficult even with SKA2-LOW, and while stacking many such profiles might allow the detection of the rings, one should know the source redshift accurately, because stacking sources from other redshift planes will quickly smear out the ring feature.
A more notable and traceable feature from an isolated source is (unless the IGM is saturated due to strong X-ray heating) varying even more steeply than . This is due to the step-wise variation of Ly pumping rate, resulting in strong absorption nearby and weak absorption further away. This “Ly blob” should be ubiquitous around isolated sources before the full saturation of Ly pumping occurs everywhere, which is analogous to individual H II regions in the patchy reionization process before the full overlap occurs (Fig. 3a).
It becomes even more interesting when the UV source is accompanied by an X-ray source. Typical emissivity of X-ray sources associated with UV (stellar) sources is relatively small (compared to proposed Population III X-ray binaries), and the corresponding X-ray heating zone (where ) is smaller than the Ly blob when the IGM were colder than the CMB before exposure. In addition, the central region will be ionized mostly by UV sources, such that is zero at the center, positive outside, and negative even further outside (Fig. 3b). Note that probing the signature of individual objects is likely to be possible in only a relatively narrow range of frequency (redshift), since rapid growth in the abundance of galaxies will soon wash out such a signature.
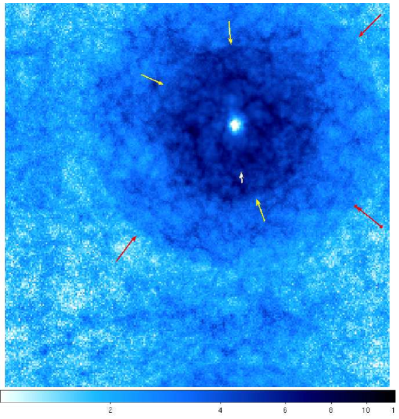
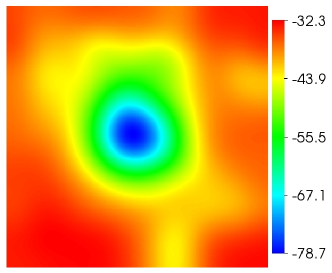
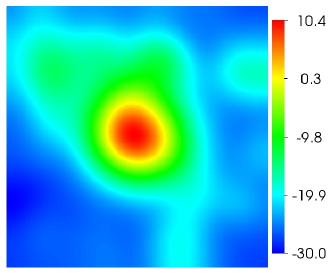
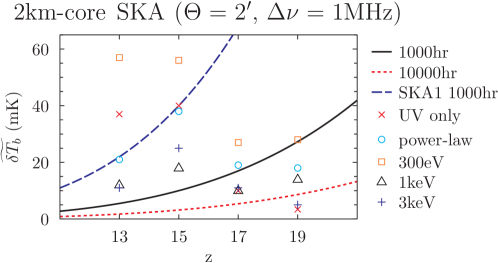
This can occur even when there is a strongly clustered set of sources: Xu et al. (2014) simulated the formation of Population III and II stars and X-ray binaries inside a high-density peak (“Rarepeak”) in the early Universe, and Ahn et al. (2014) postprocessed the simulated data and obtained a 21-cm map which shows a much more extended profile than that of a single object (Fig. 4a, b). A similar prediction for the spatially extended profile also exists for high-z QSO systems, very sparsely spaced in the Universe (Tozzi et al. 2000). In case of the Rarepeak, SKA2-LOW performing 1000-hour integration of a tracked field with the and smoothing filter will enable its (their) detection regardless of the model variation, ranging from the all-absorption trough case (without X-ray binaries) to the fully X-ray heated case (with efficient X-ray heating) with a high S/N ratio (Fig. 4c).
As it is easy to estimate the number density of such peaks a priori, one can forecast the odds to find those objects inside a dedicated field of observation. For Rarepeak, which is a density peak when the linear density field is filtered at comoving scale, its number density is roughly . A tracking volume of FOV(SKA1-LOW) (where FOV denotes the field of view), which covers the redshift range , will host about 600 of those high-density peaks. Thus detecting the Ly-blob feature of these objects at through the SKA2-LOW 1000-hour integration is bound to succeed, while with the SKA1-LOW array configuration, about a 16000-hour integration is required to achieve the same sensitivity. Alternatively, we may target the few cases which can be marginally detected by SKA1-LOW with a 1000-hour integration with the same smoothing scheme (Fig. 4). While lower-redshift detections become much easier, at that time the distinct isolated feature may be erased by signals from other, more abundant density peaks if similar emissivity is assumed. In either case, since the exact epoch when this occurs is model-dependent, it is necessary to explore a wider range of the astrophysical parameter space than has been investigated by Ahn et al. (2014) and still consider the possibility to observe individual objects at lower redshifts by SKA1-LOW. It is also advisable to carry out imaging with SKA1-LOW even when it has reached 50% capability of its final phase, because again there may exist objects whose size and signal strength are large enough to be successfully imaged. For example, AGN+galaxy systems (Tozzi et al., 2000) or even rarer peaks than have been studied by Ahn et al. (2014) may appear in such an imaging observation, although a relatively low-redshift range, , may be adequate due to the low sensitivity expected.
Aside from the high-redshift nature of these early stars/galaxies, the unique feature of the composite H II region + X-ray heated region + Ly blob is not something one expects from the main EoR imaging. The main EoR imaging will focus mostly on large H II bubbles () with before filtering, and the neutral region will simply fluctuate according to the underlying density fluctuation. If so, tomography will tell us about source properties during the peak of EoR (see the subchapter by Mellema and the subchapter by Iliev), and cosmological information during the early phase of EoR (see the subchapter by Pritchard).
4 Conclusion
We have briefly reviewed theories of high-redshift astrophysics and their observational aspects during CD, when the first galaxies formed. The first galaxies significantly affect the IGM, leading to signatures that will be detectable through the observation of the 21-cm background. With new developments in the theory of first-star formation, the number of feasible models of this early epoch is ever increasing. These new developments include the initial mass function of Pop III stars, the spectral energy distribution of stars and X-ray sources, the byproduct of stars, and dynamical/radiative feedback effects, to name a few. SKA1-LOW and SKA2-LOW have the capability of probing first galaxies and their impact on the IGM through power spectrum analysis and imaging.
SK1-LOW will be able to observe the signature of these objects mostly through the 21-cm power spectrum, with better sensitivity and thus deeper target-redshift than most SKA precursors. Three prominent epochs, which are the Ly pumping epoch, X-ray heating epoch, and the main EoR will be observed as three distinct evolutionary phases in the amplitude of the 21-cm power spectrum in the wavenumber range around . The shape of the power spectrum in a wide dynamic range of might be able to tell us about the properties of the early objects, such as their SED.
SKA2-LOW will be able to carry out imaging, as well as the power spectrum analysis at higher sensitivity than SKA1-LOW. Imaging will help to constrain source properties much better than power spectrum analysis, because of model degeneracy and loss of information are inherent in the power spectra. Clustered sources of UV and X-ray sources may show their unique signature of the composite absorption and emission of 21-cm lines against the CMB, as long as their angular scale becomes large enough to achieve high S/N with SKA2-LOW. For serendipity, however, it is advised to carry out imaging also with SKA1-LOW.
There exists tension between high-redshift astrophysics and cosmology. Even at CD, the 21-cm signal of an astrophysical origin may swamp that of a cosmological origin. Nevertheless, there exists the possibility that the cosmological signal may be boosted significantly, if mechanical energy conversion occurs on cosmological scales (McQuinn & O’Leary, 2012). In either case, the best window for cosmology lies at the highest redshift range planned for SKA ().
References
- Abel et al. (2002) Abel, T., Bryan, G. L., & Norman, M. L. 2002, Science, 295, 93
- Ahn et al. (2012) Ahn, K., Iliev, I. T., Shapiro, P. R., Mellema, G., Koda, J., & Mao, Y. 2012, ApJL, 756, L16
- Ahn et al. (2009) Ahn, K., Shapiro, P. R., Iliev, I. T., Mellema, G., & Pen, U. 2009, ApJ, 695, 1430
- Ahn et al. (2014) Ahn, K., Xu, H., Norman, M. L., Alvarez, M. A., & Wise, J. H. 2014, ArXiv e-prints 1405.2085
- Alvarez et al. (2010) Alvarez, M. A., Pen, U.-L., & Chang, T.-C. 2010, ApJL, 723, L17
- Baek et al. (2010) Baek, S., Semelin, B., Di Matteo, P., Revaz, Y., & Combes, F. 2010, A&A, 523, A4
- Bromm et al. (2002) Bromm, V., Coppi, P. S., & Larson, R. B. 2002, ApJ, 564, 23
- Cen (2006) Cen, R. 2006, ApJ, 648, 47
- Chen & Miralda-Escudé (2008) Chen, X., & Miralda-Escudé, J. 2008, ApJ, 684, 18
- Chuzhoy et al. (2006) Chuzhoy, L., Alvarez, M. A., & Shapiro, P. R. 2006, ApJL, 648, L1
- Dijkstra et al. (2004) Dijkstra, M., Haiman, Z., & Loeb, A. 2004, ApJ, 613, 646
- Fialkov et al. (2013) Fialkov, A., Barkana, R., Visbal, E., Tseliakhovich, D., & Hirata, C. M. 2013, MNRAS, 432, 2909
- Furlanetto (2006) Furlanetto, S. R. 2006, MNRAS, 371, 867
- Greif et al. (2011a) Greif, T. H., Springel, V., White, S. D. M., Glover, S. C. O., Clark, P. C., Smith, R. J., Klessen, R. S., & Bromm, V. 2011a, ApJ, 737, 75
- Greif et al. (2011b) Greif, T. H., White, S. D. M., Klessen, R. S., & Springel, V. 2011b, ApJ, 736, 147
- Haiman (2011) Haiman, Z. 2011, Nature , 472, 47
- Haiman et al. (2000) Haiman, Z., Abel, T., & Rees, M. J. 2000, ApJ, 534, 11
- Hirata (2006) Hirata, C. M. 2006, MNRAS, 367, 259
- Hirano et al. (2014) Hirano, S., Hosokawa, T., Yoshida, N., Umeda, H., Omukai, K., Chiaki, G., & Yorke, H. W. 2014, ApJ, 781, 60
- Iliev et al. (2012) Iliev, I. T., Mellema, G., Shapiro, P. R., Pen, U.-L., Mao, Y., Koda, J., & Ahn, K. 2012, MNRAS, 423, 2222
- Mao et al. (2012) Mao, Y., Shapiro, P. R., Mellema, G., Iliev, I. T., Koda, J., & Ahn, K. 2012, MNRAS, 422, 926
- McQuinn (2012) McQuinn, M. 2012, MNRAS, 426, 1349
- McQuinn & O’Leary (2012) McQuinn, M., & O’Leary, R. M. 2012, ApJ, 760, 3
- McQuinn et al. (2006) McQuinn, M., Zahn, O., Zaldarriaga, M., Hernquist, L., & Furlanetto, S. R. 2006, ApJ, 653, 815
- Mellema et al. (2013) Mellema, G., Koopmans, L. V. E., Abdalla, F. A., Bernardi, G., Ciardi, B., Daiboo, S., de Bruyn, A. G., Datta, K. K., Falcke, H., Ferrara, A., Iliev, I. T., Iocco, F., Jelić, V., Jensen, H., Joseph, R., Labroupoulos, P., Meiksin, A., Mesinger, A., Offringa, A. R., Pandey, V. N., Pritchard, J. R., Santos, M. G., Schwarz, D. J., Semelin, B., Vedantham, H., Yatawatta, S., & Zaroubi, S. 2013, Experimental Astronomy, 36, 235
- Mesinger et al. (2014) Mesinger, A., Ewall-Wice, A., & Hewitt, J. 2014, MNRAS, 439, 3262
- Mesinger et al. (2013) Mesinger, A., Ferrara, A., & Spiegel, D. S. 2013, MNRAS, 431, 621
- O’Leary & McQuinn (2012) O’Leary, R. M., & McQuinn, M. 2012, ApJ, 760, 4
- Pacucci et al. (2014) Pacucci, F., Mesinger, A., Mineo, S., & Ferrara, A. 2014, MNRAS, 443, 678
- Pritchard & Furlanetto (2006) Pritchard, J. R., & Furlanetto, S. R. 2006, MNRAS, 367, 1057
- Pritchard & Loeb (2008) Pritchard, J. R., & Loeb, A. 2008, Phys. Rev. D , 78, 103511
- Pritchard & Loeb (2012) Pritchard, J. R., & Loeb, A. 2012, Reports on Progress in Physics, 75, 086901
- Santos et al. (2011) Santos, M. G., Silva, M. B., Pritchard, J. R., Cen, R., & Cooray, A. 2011, A&A, 527, A93
- Spolyar et al. (2009) Spolyar, D., Bodenheimer, P., Freese, K., & Gondolo, P. 2009, ApJ, 705, 1031
- Stacy et al. (2011) Stacy, A., Bromm, V., & Loeb, A. 2011, ApJL, 730, L1+
- Stacy et al. (2010) Stacy, A., Greif, T. H., & Bromm, V. 2010, MNRAS, 403, 45
- Tozzi et al. (2000) Tozzi, P., Madau, P., Meiksin, A., & Rees, M. J. 2000, ApJ, 528, 597
- Tseliakhovich & Hirata (2010) Tseliakhovich, D., & Hirata, C. 2010, Phys. Rev. D , 82, 083520
- Turk et al. (2009) Turk, M. J., Abel, T., & O’Shea, B. 2009, Science, 325, 601
- Vonlanthen et al. (2011) Vonlanthen, P., Semelin, B., Baek, S., & Revaz, Y. 2011, A&A, 532, A97
- Wyithe & Cen (2007) Wyithe, J. S. B., & Cen, R. 2007, ApJ, 659, 890
- Xu et al. (2014) Xu, H., Ahn, K., Wise, J. H., Norman, M. L., & O’Shea, B. W. 2014, ApJ, 791, 110
- Yoshida et al. (2006) Yoshida, N., Omukai, K., Hernquist, L., & Abel, T. 2006, ApJ, 652, 6