The cost of attack in competing networks
Abstract
Real-world attacks can be interpreted as the result of competitive interactions between networks, ranging from predator-prey networks to networks of countries under economic sanctions. Although the purpose of an attack is to damage a target network, it also curtails the ability of the attacker, which must choose the duration and magnitude of an attack to avoid negative impacts on its own functioning. Nevertheless, despite the large number of studies on interconnected networks, the consequences of initiating an attack have never been studied. Here, we address this issue by introducing a model of network competition where a resilient network is willing to partially weaken its own resilience in order to more severely damage a less resilient competitor. The attacking network can take over the competitor nodes after their long inactivity. However, due to a feedback mechanism the takeovers weaken the resilience of the attacking network. We define a conservation law that relates the feedback mechanism to the resilience dynamics for two competing networks. Within this formalism, we determine the cost and optimal duration of an attack, allowing a network to evaluate the risk of initiating hostilities.
I Introduction
Recent research carried out on competing interacting networks Bascompte09 ; Bascompte14 ; Aguirre ; dsouza ; Arenas ; Schweitzer does not take into account the fact that real-world networks often compete not only to survive but also to take over or even destroy their competitors Thebault . For example, in international politics and economics, when one country imposes economic sanctions on another, feedback mechanisms can cause the country imposing the sanctions to also be adversely affected. The decision by a wealthier country to keep military spending at a high level long enough to exhaust its poorer competitor can also contribute to its own exhaustion Richardson . Similarly, in warfare, any attack depletes the resources of the attacking force and can elicit a counter-attack from the competing force Shakarian . Also, in nature, an incursion between species can alter the dynamics of predator-prey interaction Scheffer01 .
Although, these competing interactions are a widespread real-world phenomenon, current studies analyze only effects of attack on attacked networks, but disregarding its effect on the external attacking network. For example, for both single and interactive networks, existing studies on network robustness report that every network, regardless of the size and architecture, eventually can be destroyed Podobnik15 ; Albert00 ; Cohen00 ; Reis_nphys14 ; buldyrev_n10 ; Dorogovtsev ; PodobnikNSR2015 . But, what then prevents a network from attacking a weaker competitor or, what is the optimal moment for initiating or ending an attack? In order to identify the factors that inhibit a network from attacking and demolishing a weaker competitor and to determine the optimal moment and duration of an attack, we develop a theoretical framework that quantifies the cost of an attack by connecting the feedback mechanisms and resilience dynamics between two competing dynamic networks with differing levels of resilience May2014 ; plosscheffer .
II Theoretical framework
We introduce a general methodology that can be applied to networks of any size and structure. First, as an illustrative example, we describe two competing Barabási-Albert (BA) networks Barabasi99 which we designate network S and network W. This model differs from the single network BA model in that the two interconnected networks have both intra-network and inter-network links EPL12 . One real-world example of this kind of network interaction is firms in an economic network that link with other firms both domestically and abroad.
Using the preferential attachment (PA) rule Barabasi99 ; EPL12 ; Perc14 , we generate networks S and W starting with nodes in each network. At each time step we add a new node that connects with existing nodes in network S and with existing nodes in network W, where the probability of each connection depends on the total node degrees in networks S and W. Similarly, using the PA rule we connect a new node in network W with nodes inside network W and with nodes in network S.
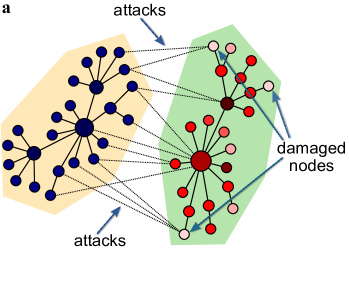
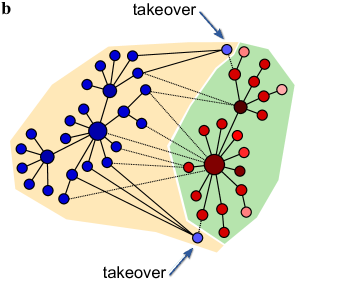
In a broad class of real-world networks, nodes can fail either due to inherent reason Antonio04 or because their functionality depends on their neighborhood Watts02 ; Antonio04 . Hence, any node in either of the two networks, e.g., a node inside network S with neighbors in its own network and neighbors in network W, can fail at any moment, either internally—independent of other nodes—with a probability or externally with a probability . Node externally fails with a probability when, similar to the Watts model Watts02 , the total fraction of its active neighbors is less than or equal to a fractional threshold which is equal for all nodes in both networks. The larger the value, the less resilient the network. We assume that one of the two networks is more resilient than the other, distinguishing between strong network S and weak network W. We do so by assigning different fractional thresholds to the strong and weak networks, and , respectively, with . As in Ref. Antonio04 , we assume that an internally-failed node in network S or network W recovers from its last internal failure after a period . Consecutive failures of the same node stretch the effective failure times and introduce heterogeneity into the distribution of inactivity periods. Since in real-world networks it is dangerous for nodes to be inactive, we allow the strong network to take over nodes in the weak network when a node spends more time in internal failure than , where is a constant. Figure 1 qualitatively shows the interaction process.
III Results
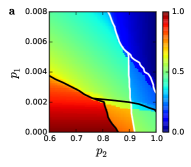
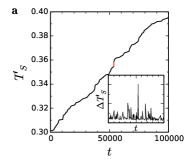
We quantify the current collective state of the strong and weak networks in terms of the fraction of active nodes, and , respectively Antonio04 ; Pod14 ; Pod14_2 . We assume that initially on both networks have internal and external failure probability values of and , respectively. Figure 2(a) shows a two-parameter phase diagram for each network in which the hysteresis is composed of two spinodals separating two collective states, i.e., the primarily “active” and the primarily “inactive.” Figure 2(b) shows that increasing the value of leads to catastrophic first-order phase transitions in both networks. When each network recovers (i.e., when is decreased to previous values), the fraction of active nodes returns to an upper state. Nevertheless, the critical point in the recovery is well beyond the point at which the network collapses. Figure 2(b) also shows (solid line) that the initial choice of parameters makes network S more resilient to network fluctuations in the value of and that the fluctuation needed to initiate the collapse of network S () is much larger than the fluctuation needed to initiate the collapse of network W (). Furthermore, network W is closer to a critical transition than network S.
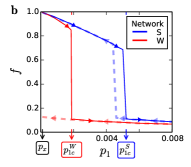
Because network S has a higher resilience than network W and can more easily withstand fluctuations, S could induce the collapse of W by increasing , but only if the fraction of its active links is not dramatically reduced. Figure 2(b) shows how when network S attacks network W by increasing to the weak network becomes abruptly dysfunctional. Figure 2(b) also shows that when the values of are reset to their pre-attack levels the collapse of network W is permanent (red dashed line) and, if it ceases its attack, the recovery of network S is complete and all of its inactive nodes are reactivated (see blue dashed line Figure 2(b)). Similarly, when economic sanctions in a financial system are lifted the weak economies are not restored but the strong economics recover after suffering little damage.
Figure 2(c) shows a modified competing network structure in which there are two interconnected Erdős-Reny networks ER with inter-network links randomly chosen. Although this structure quantitatively differs from the phase diagram of competing BA networks, the same kind of transition occurs in the random configuration. This indicates the generality of these critical transitions in competing networks. We obtain similar results when degree-degree correlations are introduced between the links connecting both networks. Figure 2(d) shows nodes in the strong network linking with nodes in the weak network only when they are of similar degree (i.e., “assortative mixing” NW ). As in the other configurations, the better position of the attacker enables the strong network to destroy the weak one and then return safely to its initial state.
III.1 Mean field theory
Using mean-field theory we analytically describe the attack-and-recovery process between two interconnected networks with random regular topologies where all nodes within the same network have the same degree. We assume that each node in network S is linked with nodes in its own network and nodes in network W. Similarly, each node in network W is linked with nodes inside network W and nodes in network S. In both networks the fraction of failed nodes is , where is the fraction of functional nodes. We can approximate the values of at each network by
| (1) | |||||
| (2) |
where Antonio04 denotes the average fraction of internally failed nodes and denotes the probability that a node in network S has externally failed,
| (3) | |||||
Here represents the absolute threshold of network S simply related to the fractional threshold as : a node in network S can externally fail with a probability only when the number of active neighbors in both network S and network W is less than or equal to . Similarly, we obtain for network W by replacing S with W, and vice versa, in Eq. (3). Finally, we set network S to be more resilient than network W, by setting .
The analytical results of Fig. 3(a) indicate that when network S increases the internal failure probability and so in an effort to damage network W it also causes partial damage to itself. Although it first seems that increasing reduces more active nodes in network S than in network W, when the fraction of active nodes in network W drops sharply and eventually . This attack strategy by network S is thus effective. If , however, network S undergoes a first order transition that leads to collapse, a situation that network S clearly must avoid.
Inspecting the recovery of the previous internal failure probability values after the attack we find that the fraction of active nodes in both networks exhibit a hysteresis behavior. Note that when the transition at is surpassed neither network is able to restore its functioning to the levels previous to the attack.
The analytical results indicate that attacking network S is effective only for certain values of . Thus network S should increase only as long as the damage to network W continues to be greater than the damage to itself, i.e., only when . Figure 3(b) shows the region in which attacks by network S are effective by showing the fraction of failed nodes in both networks in a two-dimensional phase space as the value of is increased. Two solid lines with a slope of one indicate the region in which an attack by network S is effective. When the slope of function is greater than one (the region between the two shaded lines), increasing produces more damage in network W than in network S and is thus an effective attack strategy.
In order to measure the effect of capturing nodes from a competitor network and how takeovers can modify the resilience properties of a network, we design a model in which network S is again more resilient than network W () and where node of network W is taken over by network S if its internal failure time exceeds , where is a certain failure time and a constant. Note that the longer a node in network W remains inactive (i.e., the higher the value of ), the higher the probably that it will be acquired by network S. Real-world examples of this mechanism include sick or disabled prey in an ecological system Errington ; PLOS or countries whose economic systems remain in recession for too long a period.
III.2 Take over and conservation laws
To evaluate the acquisition costs in both networks we define network wealth (capital) as proportional to two variables: the total number of links in the network—as defined in conservation biology Costanza ; Hunter —and the resilience of the network. Note that if two networks have the same number of links but different resiliencies their wealth is not equal. Note also that when network S acquires a node of degree from network W the overall resilience of network S decreases because it has acquired a weaker node. Thus network S pays a instantaneous, collective cost through a feedback mechanism that decreases its resilience from an initial threshold to a new threshold .
One of the important issues in dynamic systems that have a critical point as an attractor is whether a conservation of energy is required in local dynamic interactions Bak ; dsouza13 ; Markovic . To quantify how threshold changes in competing networks, we define a conservation law that relates the feedback mechanism to the resilience dynamics as
| (4) |
Here is the size of the strong network, its average degree, and the degree of the node that has been taken over. Thus, we assume that the more important the acquired node (i.e., the larger its degree ), the greater the cost to the resilience of network S, making it more vulnerable to future attacks. As a result, when a predator (strong) network S increases its size and its degree , its acquisition cost, , will decrease.
Here we quantify how threshold of the stronger network changes in competing networks where we assume that threshold of the weaker network does not change because every node has the same threshold. The stronger network S has the initial number of nodes , the average degree . After a multiple takeovers, where took over nodes , , …, with degrees , , …, , respectively, by using Eq. (4) we obtain
| (5) |
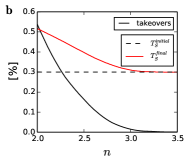
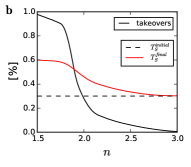
Figure 4(a) shows that when network S acquires nodes in network W the threshold of network S is increasingly affected as time passes. In this example, a node in network W is taken over by network S when the node is in failure state longer than time steps, where and . Note that as network S acquires weak nodes, its threshold increases and it becomes more vulnerable. Figure 4(b) shows the interplay between the time required to acquire a node and the threshold . Note that as increases, takeovers become increasingly rare and the final threshold of network S approaches its initial resilience, here .
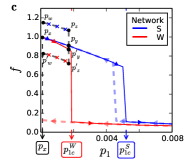
Figure 4(c) shows that, if the example in Figure 2(b) is extended to include a takeover mechanism, a fraction of active nodes in network S—measured relative to the initial number of nodes in each network—reaches values higher than one, with a peak at . Note that when attacks cease (e.g., when, in an economic system, sanctions are lifted) decreasing the value of , , the fraction of active nodes in network S increases but network W is left irreversibly damaged (see the closed hysteresis ).
III.3 Threshold diversity in competing networks
Thus far we have studied competing interconnected networks in which there is only one threshold characterizing each network. However, in real-world interconnected networks commonly the functionality of a node in a given network is not equally sensitive on the neighbors in its own and the other network. To this end, we assume that node in network S can externally fail with probability if the fraction of the active neighbors of node in network S is equal to or lower than some threshold , or if the fraction of the active neighbors of node in network W is equal to or lower than some threshold . We similarly define external failure in the less resilient network W by replacing threshold with . The functioning of each node is thus dependent on its neighbors in network S and network W, but with different sensitivities—different resilience to external fluctuations
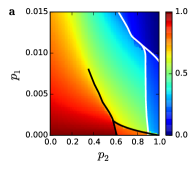
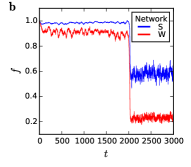
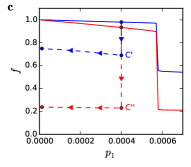
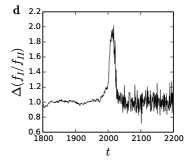
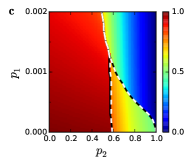
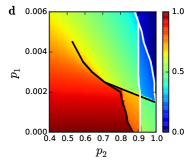
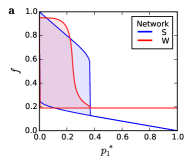
Figure 5(a) shows, for a given set of parameters, a two-parameter phase diagram of competing networks, a model that incorporates the threshold separation for external failure but excludes takeover and feedback mechanisms. This model resembles that in Fig. 2 but utilizes different configurations. Suppose network S spontaneously activates at time but, due to differences in the variables characterizing network S and network W, initiates a substitution mechanism, not a takeover. Thus each time node in network W spends a time period in an inactive mode that exceeds the substitution time —e.g., in ecology, a time period without food— is replaced by a new node from network S. Figure 5(b) shows the fraction of active nodes in each network calculated relative to the initial number of nodes at time . Fractions of active nodes of both networks exhibit a catastrophic discontinuity (a phase flip) at , which is characteristic of a first-order transition. Since both networks are interdependent, substituting nodes from the less resilient network W affects the functionality of network S even more dramatically than that shown in Fig. 2. Thus beyond some threshold we expect that additional weakening of network W will also permanently damage network S. This demonstrates how dangerous an attacking strategy can be for an attacker in a system of interdependent networks, e.g., between countries that are at the same time competitors and economics partners.
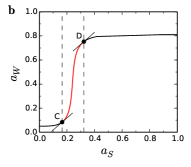
Figure 5(c) shows that when the attacks and substitutions cease, the fractions of active nodes in network S and network W reach points and , respectively. If the probability of internal failure spontaneously decreases during the recovery period, because of network interdependence the functionality of network S is not substantially improved. The triumph of network S over network W has its price. In ecology, for example, although the population of each species tends to increase, a dominance strategy is risky, e.g., the extinction of a key species can trigger, through a cascade mechanism Mold86 ; buldyrev_n10 , the extinction of many other species Estes .
Figure 5(d) shows the change in the ratio between the fraction of active nodes in network S and network W as a function of time. This ratio can serve as an early-warning mechanism Dakos that indicates when attacks should be stopped. Optimally, the stopping time for attacks will be when the ratio reaches its maximum.
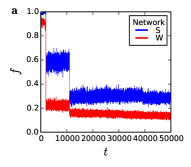
Finally, Fig. 6(a) shows that when the feedback mechanism (the cost of taking over) defined in Eq. (4) is included, the fraction of active nodes in each network exhibits an even richer discontinuous behavior than in Fig. 5(c), where the cost was excluded. After 50,000 steps, because of the decrease in network S’s resilience after each substitute, the final fraction of active nodes in network S is substantially smaller than the corresponding fraction in Fig. 5(c) (i.e., when the cost is excluded). At the same time, Fig. 6(b) shows that an increase in the takeover time decreases the fraction of substitutes.
IV Summary
In conclusion, we have presented a theoretical framework based on resilience, competition, and phase transitions to introduce a cost-of-attack concept that relates feedback mechanisms to resilience dynamics defined using a linear conservation law. Our model for competing networks can be applied across a wide range of human activities, from medicine and finance to international relations, intelligence services, and military operations.
We focus on a specific context where one more resilient network attacks the less resilient competitor network. The model assumptions about the structure and dynamics for two interactive networks with competing interactions and different resilience levels have to be adjusted in regard to different real world scenarios (see the electronic supplementary material, S4).
The ability to measure attacker network resilience and its attack cost is crucial because every weakening of the resilience reduces the probability of the network survival under future attacks. For example, in political socio-economic systems a network-based approach for overcoming competing countries could be more effective by applying economical sanctions than carrying out military actions. Interdependent links established between countries during prosperous times can facilitate sanctions (intentional fluctuations) that are used as a weapon when more resilient countries try to overcome less resilient countries. They can also facilitate the global propagation of economic recessions (spontaneous fluctuations). During long economic crises these interdependent links can become fatal for less resilient countries, whose weakness is enhanced by being underdogs in a global network-of-networks and, at the same time, whose resources can be captured by more powerful countries.
Although, our proposed framework is suited for representing the most simplest case of bilateral economic interdependence between just two countries (networks), it provides the basis for more general scenarios of alliances of more countries (networks). The concept of alliance where some countries unite in order to attack some other alliance is especially interesting when there is heterogeneity in resilience of allied attacker countries. For example, economically most dominant countries can increase their dominance at the expense of their partners in the alliance or they can, on the other hand, depend on the alliance’s weakest country (see the supplementary material, S4 A).
In addition to the intentional fluctuations characteristic of human societies, our methodology can also be applied to a broad class of complex systems in which spontaneous fluctuations occur, from brain functioning to ecological habitats and climate fluctuations Nowak_11 ; Adger ; Cavoglave ; Lange ; Hunter ; Estes ; Vespignani12 ; Guido13 . The methodology is based on specific structure, dynamics and mechanisms of the model of networks with competing interactions and different resilience levels, that have to be adjusted for different systems and contexts of application (see the supplementary material, S4).
Acknowledgments
We thank Jacobo Aguirre and David Papo for discussions.
Author contributions
B.P., D.H., T.L., M.P., J.M.B. and H.E.S. conceived and designed the research. B.P., D.H., T.L. carried out the numerical simulations, analysed the results and developed the theory. All authors discussed the results and contributed to the text of the manuscript.
Funding Statement
B.P. work was partially supported by the University of Rijeka. M.P. acknowledges support from the Slovenian Research
Agency (Grant P5-0027), and from the Deanship of Scientific Research, King Abdulaziz University (Grant 76-130-35-HiCi).
J.M.B. acknowledges financial support of MINECO (project FIS2013-41057-P).
The Boston University work was supported by ONR Grant N00014-14-1-0738, DTRA Grant HDTRA1-14-1-0017 and NSF Grant CMMI 1125290. The authors declare no competing financial interests.
References
- (1) Bastolla, U. et al. The architecture of mutualistic networks minimizes competition and increases biodiversity. Nature 458, 1018-1020 (2009).
- (2) Rohr, R. P., Saavedra, S. & Bascompte, J. On the structural stability of mutualistic systems. Science 345, 416 (2014).
- (3) Aguirre, J., Papo, D. & Buldú, J. M. Successful strategies for competing networks. Nat. Phys. 9, 230-234 (2013).
- (4) D’Souza, R. M. Complex network: A winning strategy. Nat. Phys. 9, 212-213 (2013).
- (5) Kivela, M., Arenas, A., Barthelemy, M., Gleeson, J.P., Moreno, Y. & Porter, M. Multilayer networks. J. Complex Networks 2, 203-271 (2014).
- (6) Scholtes, I. et al. Causality-driven slow-down and speed-up of diffusion in non-Markovian temporal networks. Nat. Commun. 5, 5024 (2014).
- (7) Thebault, E. & Fontaine, C. Stability of ecological communities and the architecture of mutualistic and trophic networks. Science 329, 853-856 (2010).
- (8) Richardson, L. F. The Mathematical Psychology of War. Nature 135, 830-831 (1935).
- (9) Shakarian, P., Lei, H. & Lindelauf, R. Power Grid Defense Against Malicious Cascading Failure. arXiv 1401.1086v1 (2014).
- (10) Scheffer, M. et al. Catastrophic shifts in ecosystems. Nature 413, 591-596 (2001).
- (11) Podobnik, B. et al. Predicting the Lifetime of Dynamic Networks Experiencing Persistent Random Attacks. Sci. Rep. 5, 14286 (2015).
- (12) Albert, R., Jeong, H. & Barabási, A. L. Error and attack tolerance of complex networks. Nature 406, 378-382 (2000).
- (13) Cohen, R., Erez, K., ben-Avraham, D. & Havlin, S. Resilience of the internet to random breakdowns. Phys. Rev. Lett. 85, 46264628 (2000).
- (14) Reis, S. D. S. et al. Avoiding catastrophic failure in correlated networks of networks, Nat. Phys. 10, 762-767 (2014).
- (15) Buldyrev, S. V. et al. Catastrophic Cascade of Failures in Interdependent Networks. Nature 464, 1025-1028 (2010).
- (16) Dorogovtsev, S. N. & Goltsev, A. V. Critical phenomena in complex networks. Rev. Mod. Phys. 80, 1275-1335 (2008).
- (17) Podobnik, B. et al. Predicting the Lifetime of Dynamic Networks Experiencing Persistent Random Attacks. Sci. Rep. (accepted for publication).
- (18) May, R. Networks and webs in ecosystems and financial systems. Phil. Trans. Soc. A 371, 20120376 (2013).
- (19) Downing, A. S., van Nes, E. H., Mooij, W. M. & Scheffer, M. The Resilience and Resistence of an Ecosystem to a Collapse of Diversity. PloS One 7, e46135 (2012).
- (20) Barabási, A. -L. & Albert, R. Emergence of scaling in random networks. Science 286, 509-512 (1999).
- (21) Podobnik, B., Horvatic, D., Dickison, M. & Stanley, H. E. Preferential attachment in the interaction between dynamicly generated interdependent networks, EPL 100, 50004 (2012).
- (22) Perc, M. The Matthew effect in empirical data. J. R. Soc. Interface 11, 20140378 (2014).
- (23) Majdandzic, A. et al. Spontaneous recovery in dynamical networks. Nat. Phys. 10, 34-38 (2014).
- (24) Watts, D. J. A simple model of global cascades on random networks. Proc. Natl. Acad. Sci. USA 99, 5766-5771 (2002).
- (25) Podobnik, B. et al. Network Risk and Forecasting Power in Phase-Flipping Dynamic Networks. Phys. Rev. E 89, 042807 (2014).
- (26) Podobnik, B. et al. Systemic risk in dynamical networks with stochastic failure criterion. EPL 106, 68003 (2014).
- (27) Erdős, P. & Rényi, A. On random graphs. I. Publ. Math. 6, 290-297 (1959).
- (28) Newman, M. E. J. Assortative mixing in networks. Phys. Rev. Lett. 89, 208701 (2002).
- (29) Errington, P.L. Predation and vertebrate populations. Q. Rev. Biol. 21, 144-177 (1946).
- (30) Genovart, M. et al. The young, the weak and the sick: evidence of natural selection by predation. PloS One. 5, e9774 (2010).
- (31) Hunter, M. L. Fundamentals of conservation biology. (Oxford: Blackwell Science, 1996).
- (32) Costanza, R. et al.. The value of the world’s ecosystem services and natural capital. Nature 387, 253-260 (1997).
- (33) Bak, P., Tang, C. & Wiesenfeld, K. Self-organized criticality: an explanation of 1/f noise. Phys. Rev. Lett. 59, 381-384 (1987).
- (34) Noel, P. A., Brummitt, C. D. & D’Souza, R. M. Controlling Self-organizing Dynamics on Networks Using Models that Self-Organize. Phys. Rev. Lett. 111, 078701 (2013).
- (35) Markovic, D. & Gros, C. Power laws and self-organized criticality in theory and nature. Phys. Rep. 536, 41-74 (2014).
- (36) Mold, J. W. & Stein, H. F. The cascade effect in the clinical care of patients. New England Journal of Medicine 314, 512-514 (1986).
- (37) Estes, J. A., Duggins, D.O. & Rathbun, G. B. The ecology of extinctions in kelp forest communities. Conservation Biology 3, 252-264 (1989).
- (38) Dakos, V. et al. Slowing down as an early warning signal for abrupt climate change. Proc. Natl. Acad. Sci. USA 105, 14308-14312 (2008).
- (39) Adger, W. N. et al. Social-ecological resilience to coastal disasters. Science 309, 1036-1039 (2005).
- (40) Thompson, J. N. The geographic mosaic of coevolution. (University of Chicago Press, 2005).
- (41) De Lange, H. J., Sala, S., Vighi, M. & Faber, H. J. Ecological vulnerability in risk assessment. A review and perspectives: Science of the total Environment 408, 3871-3879 (2010).
- (42) Nowak, M. A. & Highfield, R. SuperCooperators: Altruism, Evolution, and Why We Need Each Other to Succeed. (Simon and Schuster, 2011).
- (43) Vespignani, A. Modelling dynamical processes in complex socio-technical systems Nat. Phys. 8, 32-39 (2012).
- (44) Battiston, S., Caldarelli, G., Georg, C., May, R. & Stiglitz J. Complex derivatives. Nat. Phys. 9, 123-125 (2013).
Supplementary material: The cost of attack in competing networks
S1 Resilience dynamics in finance
Here we demonstrate that the resilience dynamics in finance can be presented in terms of a conservation (linear) law, where the threshold is controlled by an asset-debt ratio. Recall that in our model a node externally fails with a certain probability when the total fraction of its active neighbors is equal to or lower than the fractional threshold . The larger the value, the less resilient the network. In quantifying the impact of a perturbation (attack) on the network, we shall demonstrate that the more severe the attack, the larger the impact on the network resilience.
Suppose a bank has an interbank asset invested equally in each of its neighboring banks. Bank has also some asset , considered as a stochastic variable. Following Refs. Gai10 ; EPL12S , we define a bank to be solvent (active) when , i.e., when the bank’s assets exceed its liabilities, . Here represents the fraction of inactive neighboring banks that can withstand and still function properly. Note that this is related to threshold as , since we assume that the number of incoming links is equal to the number of outgoing links, . The larger the value, the more stable the bank. Suppose that for each bank there is a linear dependence between , , and the network degree —e.g., that and . Then a bank is inactive when () or when at least 50% of its neighboring banks are inactive. Let us assume next that increases due to an external perturbation . Then the new threshold is equal to
| (6) |
or
| (7) |
If the external perturbation is negative (positive), or alternatively, the asset increases (decreases) (Eq. (6)), the threshold increases (decreases) and the resilience decreases (increases). The larger the number of neighbors (), the smaller the change in the network resilience. Note that if the external perturbation attacking one node is shared not only by its neighbors but by the entire network with nodes, then is replaced by as in Eq. (4) in the paper. Note that if we replace the linear dependence between assets and degree with a non-linear (power-law) dependence, e.g., , where is a constant parameter, we obtain a similar relationship to Eq. (7), .
S2 Resilience dynamics in interconnected networks
We focus on a mean field approximation of the level of external and internal failures between nodes for two interconnected networks. Every node has an internal failure probability Antonio04S —assumed, for reasons of simplicity, to be the same in both networks, . If each node in network S has links with nodes in its own network and links with nodes in network W, here we define that there must be more than nodes in network S and nodes in network W if the nodes in S are to function properly. In contrast, if the number of inactive nodes in network S is , the probability that the node in network S will externally fail is . Similarly, if the number of inactive nodes in network W is , the probability that the node in network S will externally fail is . To simplify we can use . We denote the time averaged fractions of failed nodes in network S and network W as and , respectively. Using combinatorics, we calculate the probability that a node in network S will have a critically damaged neighborhood among its neighbors in S to be . Similarly, we calculate the probability that a node in network S will have a critically damaged neighborhood among its neighbors in W to be . The probability that a node will fail externally due to failures in network S (network W) is (). If we denote the internal failures in network S by A, and the external failures by B, and the external failures in network W by C, then the probability that a randomly chosen node in S will fail is . If we assume that A, B, and C are not mutually exclusive, but interdependent events, we come to
| (8) | |||||
| (9) |
where , and as in Ref. Antonio04S node recovers from an internal failure after a time period . Similarly, from the above equation we obtain the fraction of failed nodes in network W (either internally or externally failed) by interchanging S and W.
S3 Coupled BA interdependent networks with equal connectivity but different threshold
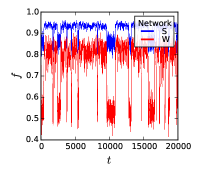
We now focus on two interdependent BA networks with equal connectivity but different threshold, where . Fig. S1 shows that for each of the two interconnected networks the fraction of active nodes simultaneously jumps from a stable state to another one. Phase-flipping is obtained by setting the network close to a critical point that is reported for a single network in Ref. Antonio04S . Since the threshold in network S is substantially smaller than in network W, and so S is more resilient than network W, the fraction of active nodes in network S is larger than the fraction of active nodes in network W. Thus the volatile phase-flipping in network functionality is more dangerous for network W than for network S. The fractions, as a function of time, can approximately model the populations of preys and predators and so be related to the periodic solutions of the Lotka-Volterra (predator-prey) equations Nowak_11S .
S4 Applicability of the model to real world scenarios
Most real world systems are composed of networks which interact with each other in different ways. In our model we focus on a specific context where one more resilient (strong) network (attack initiator) attacks the less resilient (weaker) competitor network (attack target). The proposed model depends on the structure of two interactive competing networks and the defined dynamics between initiating an attack against a competitor network and the consequences that might weaken the attack initiator resilience. Within this framework assumptions about the structure and dynamics for two interactive networks with competing interactions and different resilience levels have to be adjusted in regard to different real world scenarios.
For the structure of interactive networks we use multilayer network model distinguishing between intra-network and inter-network connections. Although in our analysis we focused on specific architectures of intra-network and inter-network connections, in general they can be arbitrarily chosen depending on real world examples. Each competing network is formed by the intra-network connections between its own nodes, while interactions between competing networks are determined by inter-network connections between nodes from two opposing competitor networks. We also assumed static intra-network and inter-network connections, while in different real world examples these connections can also change through time and depend on different spatial and temporal attributes.
When we represent both an attacker or attacked system as a network, we must also decide which attributes and level of details of the system are of interest for a specific real-world scenario. A single node in network represents a particular component of a system or aggregated set of similar components, while the consequences of an attack are described by an active or an inactive node’s state. The global collective state of both the attacker and the attacked network is measured by the total fraction of active nodes in each network. Finally, the interpretation of node’s activity and inactivity depends on the application context of different real world attack scenarios.
In order to explain the general network vulnerability to global cascades of local and external node failures/inactivations caused by attack consequences, we model node dynamics by a cascade contagion model with stochastic internal and external activation/inactivation process Antonio04S , inspired by the Watts threshold model Watts02S where each node has a probability to internally fail/inactivate independently of other nodes. At the same time, the probability to externally fail/inactivate if a fraction of its active intra-network and inter-network neighbors is less than or equal to a specified fractional threshold. This fractional threshold can be interpreted as the network resilience to failures due to interdependencies, the larger the value of the fractional threshold, the less resilient the network.
We assume that the attacker network has a higher resilience than an opponent network and that it is willing to partially weaken its own resilience in order to more severely damage a less resilient competitor. Attack concept and also its influence on resilience dynamics of the attacker is based on causing critical fraction of active neighbors for nodes from an opponent network, and using takeover and substitution mechanisms for them after their long inactivity. However, this concept is highly context-dependent and its mechanisms have to be properly mapped in regard to different real work scenarios.
As the attacker network has higher resilience than an opponent network it can induce the implicit indirect attack by increasing the probability of internal failures/inactivations of its nodes causing critical fraction of active neighbors for nodes from an opponent network. In addition, takeover and substitution mechanisms define direct attack on an opponent network. Takeover mechanism is related to the explicit attack on an opponent network with the same type of nodes as the attacker network and the explicit reduction of the attacker network resilience by increasing its fractional threshold. On the other hand, the substitution mechanism represents the explicit attack on an opponent network with implicit reduction of the attacker network resilience by having nodes whose state is more dependent on nodes form the opponent networks.
Although we focus on the most simplified scenario of two interactive competing networks where just one and more resilient network can attack a less resilient opponent network, the introduced framework provides the basis for more general scenarios of alliances of more different networks with also different interaction types between them (e.g. competing intra-specific/network, antagonistic, mutualistic) and strategies for attack as well as defense. How many new parameters have to be introduced for this scenario also depends highly on the context of the study of interest. We can observe each network collective state and resilience dynamics separately or depending on their affiliation while a specific attack or defense strategy is taking place.
How successful our network model might be when applied in practice depends first on how capable we are in estimating model parameters and mapping them to real-world context. As described before our model is structured with the architecture of intra-network and inter-network connections which define networks structure and constraints for an interaction, and with parameters for cascade dynamics including internal and external failure probabilities, the fractional threshold and the limit for inactivity period. We show how these parameters can be mapped to two real world scenarios from ecology and political socio-economy application domains.
S4.1 Socio-economic system: competing inter-firm network of countries under economic sanctions
Here we demonstrate how our modeling framework is mapped to a specific political-socio-economic scenario where one country imposes economic sanctions or similar political-economic attack/action against another country. In this regard we explain interpretation of model parameters, intra/inter-network architecture and activation/inactivation dynamics. A critical aspect of political-economic attack/action is the economic costs endured not only by the targeted country, but also by the sender country (the one making the action). Although, we are focusing here on the most simplest case of bilateral economic interdependence between just two countries, such actions can also bring to economic consequences to other third parties like neighbours countries of the target or its trading partners, but as well as senders. Economic sanctions are deliberate, government-inspired withdrawal, or threat of withdrawal, of customary trade or financial relations and are most effective when aimed against friends and close trading partners as these countries have more to lose than countries with which the sender has limited or adversarial relations.
Interdependent links established between countries during prosperous times can facilitate sanctions (intentional fluctuations) that are used as a weapon when more resilient countries try to overcome less resilient countries. They can also facilitate the global propagation of economic recessions (spontaneous fluctuations). During long economic crises these interdependent links can become fatal for less resilient countries. Similarly, when economic sanctions are lifted for the weaker economies is much harder to restore than for the stronger economics which recover after suffering little damage.
In order to explain the economic cost for the country imposing the sanctions, we first specify state of the country’s economic system by collective activity of individual firms which are part of the country economy. Firms are connected to each other directly or indirectly through their business transactions (i.e. obtaining materials from suppliers, delivering goods/products to services or R&D cooperation). Economic network of each country is represented by inter-firm network assuming that intra-network connections specify cooperative interactions between firms of same country, and inter-network connections specify interactions between firms in different countries that are subjected to the bilateral economic relation between two countries.
As many firms borrow from and lend to each other, and in particular when these firms are speculative and dependent on the credit flow, shocks to the liquidity of some firms may cause the other firms to also experience financial difficulties Pod14S . The way how geographically localized shock propagate through such inter-firms networks determines country resilience to the shock experienced by their corresponding firms. These dynamic vulnerabilities of firms can be related to the fractional threshold parameter that can be controlled by its asset-debt ratio where activity/inactivity of a firm is determined by its solvency (see S1. Resilience dynamics in finance).
The attack concepts is related to inducing the implicit indirect attack by increasing probability of internal failures/inactivations of its firms causing target country firms to become insolvent. In addition, takeover mechanisms define attack on the target country economy by taking over their firms which are insolvent for some critical time.
The extension of our modeling framework from bilateral economic interdependence between just two inter-firm networks of competing countries to more general scenarios of network alliances where some countries unite in order to attack some other alliance is especially interesting when we introduce the resilience heterogeneity of allied attacker countries. The resilience heterogeneity of allied attackers can induce opposing interests and attack strategies between partners as well as provide descriptions of scenarios where economically most dominant countries increase their dominance relative to other countries and at the expense of their partner countries in the alliance or where, on the other hand, economically strong countries depend on alliance’s weakest country. For example, suppose two countries, I and II imposing economic sanctions at the third country, III, where I is more resilient than II and both I and II are more resilient than III. A country resilience can be different since II is more linked with III than I. When the sanctions are lifted, the relative resilience between I and II can be increased making I even more dominant than before the sanctions. But on the other hand due to the interdependencies between allied countries, i.e. countries I and II, attack strategy of I is dependent also on the state of II.
S4.2 Ecological system: competing animal social networks under predator-prey interactions
Here we demonstrate how our modeling framework is mapped to two competing animal social networks under predator-prey interactions. We explain possible choices and an interpretation for intra/inter-network structures and activation/inactivation dynamics for a specific scenario where individuals from one predator species attack individuals from one prey species. A predator is an animal that hunts and kills other animals (its preys) for food. An interpretation of predators and preys internal or external activity depends on the given context of the study of interest and the interpretation of their intra/inter-network connections.
The intra-network structure for attacking (predator) and attacked (prey) networks can be represented by corresponding socio-spatial network of their individuals Pinter-Wollman13 ; Farine15 ; Wilson15 ; Kurvers2014 . While, inter-network connections, i.e. connections between predator and prey individuals, determine which predator individuals can come in close contact with which prey individuals to hunt them based on spatial and temporal factors. Interactions between animal individuals are highly dependent on their spatial proximity. Thus determining the structure of social animal network also depends on given spatial context Pinter-Wollman13 . Recent technological innovations in tracking devices and reality mining approaches are starting to enable remote monitoring and collection of detailed information of behaviors of individual animals at high spatial and temporal resolution Wilmers2015 ; Krause2013 ; Handegard12 .
A structure of social network between animal individuals influence diversity of social behaviors such as finding and choosing a sexual partner, making movement decisions, engaging in foregoing or anti-predator behavior which is manifested at the population level in the form of habitat use, mating systems, information or disease transmission. Social interactions between individuals of same species can differ in their type (competitive, cooperative, sexual), frequency and duration. Animals modify their social interactions in response to changes in external conditions such as climate, predation pressure, and social environment Pinter-Wollman13 . Although, interactions among animals are dynamic, many animal social network studies examine static structures.
For a simplified predator-prey interaction scenario we can assume static cooperative interactions and that there are no competing interactions between individuals of the same species, i.e. infraspecific competition is not taken into account. Cooperating interactions between individuals play an important role in the spreading of information within the network affecting an access to resources and the probability of predation of an individual. For example, individuals that have large number of intra-network connections can be better in discovering new food patches.
With that interpretation of the intra-network and inter-network connections, we can model predators coordinated attack by their activation dynamics. In this context it is reasonable to assume that a node in attacked (prey) network will externally fail (be killed by predators) if there is enough activated predators (i.e. fraction of active inter-neighbors larger then given threshold) that are in close range of the prey (i.e. those connected with inter-network connections). As usual, prey can also externally fail (die or migrate) if its fraction of active intra-neighbors is equal or smaller then the fractional threshold. In this context we can interpret internal and external failure/activation probabilities, and the limit for inactivity period for predators as their opportunity, exigency and willingness to hunt prey together in certain time. While those parameters in prey’s case can be interpret as a way how prey sustains predators attacks or keeps a certain habitat patch active with its own species through reproduction. Prey organisms that are difficult to find, catch, kill or consume will survive and reproduce.
The explained attack concept is in contrast to the indirect attack concept where inactive/failed states of attacker nodes cause external failure of attacked network nodes. This assumption is reasonable in a scenario where inter-network connections represent prey dependencies on its predators, i.e. where for each prey there is a needed fraction of active predators for them to survive because the active predators balance the population size of a prey (see also section S3. Coupled BA interdependent networks with equal connectivity but different threshold). In that scenario, predators and prey depend on each other in that the predators rely on prey as food source, but in turn they also keep prey population against over-population which could cause decrease of their food source. Beside that, in some cases prey species can even facilitate its own predator Aguera15 . A possible context that relies on predator and prey interdependence is explanation of how a disease or other internal disturbances in predator population can effect prey population dynamics and vice versa.
In contrast to socio-economic scenario of competing network of countries’ firms, takeover mechanism is not suitable attack concept for scenario of predator-prey interactions where we model interaction between social network of different node types, but substitution mechanism is suitable to represent additional level of predation influence on prey population. In general predation influences organisms at two ecological levels. At the level of the individual, the prey organism has an abrupt decline of its lifetime reproductive success, because it will never reproduce again, and at the level of the community, predation reduces the number of individuals in the prey population. Accordingly, the direct cost for strong predator which easily hunts and kills its prey is generally negligible, but indirect cost can be manifested through the fact that each reduction in prey abundance impedes finding a next prey. On the other hand, the direct cost is noticeable for intraguild predators, predators that kill and eat other predators of different species at the same trophic level Barraquand13 ; Borrelli15 .
Classical models of predator-prey population dynamics, often considered as the basic building blocks of larger, food-web models, explain how tropic interactions lead to oscillatory population cycles. These models assume well-mixed population where all pairs of individuals have equal probabilities of interacting with each other which corresponds to a complete graph structure. This means that the encounter rate between predators and prey is expressed in a mass-action fashion, i.e. as a product of prey and predator landscape densities Barraquand13 . Our model can describe mechanistic approach of predator-prey interactions within structured population of individuals of two animal species.
Animal social networks are harder to determine and observe than human social networks as animal network data must be collected by direct observation of interactions between individual animals Wilmers2015 ; Krause2013 . For some large herding species it may be possible to count every individual, but for many species this is not possible. In cases when is too time consuming to collect animal network data at individual level due to difficulties of capturing and identifying individuals, it can be useful to observe categories of individuals and consider interactions between them. Since spatial proximity is significant factor for establishing and maintaining cooperation between individuals, we can observe interactions between predators and prey through patches they occupy Kondoh15 ; Macdonald15 .
While in social animal networks, one node represents just a single individual of a given species and each edge represents some form of interaction between two individuals, in food webs and ecological network studies a node typically represents a species while connections between nodes represent different types of interactions between species. Species may interact with each other through antagonism (prey-predator, host-parasitoid, or host-parasite interaction), competition, or mutualism Ings09 . Food webs can provide initial blueprints of inter-connections between animal socio-spatial networks when extending our modeling framework from interaction between just two species networks to more general scenario of network alliances where several predator and/or prey networks can cooperate or compete between each other. For example, in the case when two prey species have a common predator, one prey species can lead to indirect exclusion of the other species or the case where two predators alone compete for a single prey species, one species is always excluded by the other, even in the presence of a top predator.
References
- (1) Gai, P. & Kapadia, S. Contagion in financial networks. Proc. R. Soc. A 466, 2401–2423 (2010).
- (2) Podobnik, B., Horvatic, D., Dickison, M., & Stanley, H. E. Preferential attachment in the interaction between dynamically generated interdependent networks. EPL 100, 50004 (2012).
- (3) Majdandzic, A., Podobnik, B., Buldyrev, S. V., Kenett, D. Y., Havlin, S., & Stanley, H. E. Spontaneous recovery in dynamical networks. Nature Phys. 10, 34–38 (2014).
- (4) Nowak, M. & Highfield, R. SuperCooperators: Altruism, evolution, and why we need each other to succeed. (New York: Simon and Schuster, 2011).
- (5) Watts, D. J. A simple model of global cascades on random networks. Proc. Natl. Acad. Sci. USA 99, 5766–5771, (2002).
- (6) Podobnik, B., Majdandzic, A., Curme, C., Qiao, Z., Zhou, W.-X., Stanley, H., & Li, B. Network risk and forecasting power in phase-flipping dynamical networks. Phys. Rev. E 89, 042807 (2014).
- (7) Pinter-Wollman, N. et al. The dynamics of animal social networks: analytical, conceptual, and theoretical advances. Behavioral Ecology 47, 1–14 (2013).
- (8) Farine, D. R. & Whitehead, H. Constructing, conducting and interpreting animal social network analysis. Journal of Animal Ecology 84, 1144–1163 (2015).
- (9) Wilson, A. et al. Social networks in changing environments. Behavioral Ecology and Sociobiology 69, 1617–1629 (2015).
- (10) Kurvers, R. H., Krause, J., Croft, D. P., Wilson, A. D. & Wolf, M. The evolutionary and ecological consequences of animal social networks: emerging issues. Trends in Ecology & Evolution 29, 326–335 (2014).
- (11) Wilmers, C. C., Nickel, B., Bryce, C. M., Smith, J. A., Wheat, R. E. & Yovovich, V. The golden age of bio-logging: how animal-borne sensors are advancing the frontiers of ecology. Ecology 96, 1741–1753 (2015).
- (12) Krause, J. et al. Reality mining of animal social systems. Trends in Ecology & Evolution 28, 541–551 (2013).
- (13) Handegard, N., Boswell, K., Ioannou, C., Leblanc, S., Tjostheim, D. & Couzin, I. The dynamics of coordinated group hunting and collective information transfer among schooling prey. Current Biology 22, 1213–1217 (2012).
- (14) Aguera, A., van de Koppel, J., Jansen, J. M., Smaal, A. C. & Bouma, T. J. Beyond food: a foundation species facilitates its own predator. Oikos, (2015).
- (15) Barraquand, F. & Murrell, D. J. Scaling up predator–prey dynamics using spatial moment equations. Methods in Ecology and Evolution 4, 276–289 (2013).
- (16) Borrelli, J. J. et al. Selection on stability across ecological scales. Trends in Ecology & Evolution 30, 417–425 (2015).
- (17) Kondoh, M., Mougi, A., Ushimaru, A. & Nakata, K. Adaptive movement and food-chain dynamics: towards food-web theory without birth-death processes. Theoretical Ecology, 1–11 (2015).
- (18) Macdonald, D. W. & Johnson, D. D. P. Patchwork planet: the resource dispersion hypothesis, society, and the ecology of life. Journal of Zoology 295, 75–107 (2015).
- (19) Ings, T. C. et al. Ecological networks – beyond food webs. Journal of Animal Ecology 78, 253–269 (2009).