Detection of a methanol megamaser in a major-merger galaxy
Abstract
We have detected emission from both the E (36.2 GHz) class I and E (37.7 GHz) class II methanol transitions towards the centre of the closest ultra-luminous infrared galaxy Arp 220. The emission in both the methanol transitions show narrow spectral features and have luminosities approximately 8 orders of magnitude stronger than that observed from typical class I methanol masers observed in Galactic star formation regions. The emission is also orders of magnitude stronger than the expected intensity of thermal emission from these transitions and based on these findings we suggest that the emission from the two transitions are masers. These observations provides the first detection of a methanol megamaser in the 36.2 and 37.7 GHz transitions and represents only the second detection of a methanol megamaser, following the recent report of an 84 GHz methanol megamaser in NGC1068. We find the methanol megamasers are significantly offset from the nuclear region and arise towards regions where there is H emission, suggesting that it is associated with starburst activity. The high degree of correlation between the spatial distribution of the 36.2 GHz methanol and X-ray plume emission suggests that the production of strong extragalactic class I methanol masers is related to galactic outflow driven shocks and perhaps cosmic rays. In contrast to OH and H2O megamasers which originate close to the nucleus, methanol megamasers provide a new probe of feedback (e.g. outflows) processes on larger-scales and of star formation beyond the circumnuclear starburst regions of active galaxies.
1 Introduction
The isotropic luminosity of molecular megamasers (MM) is more than a million times greater than that of masers observed toward Galactic star forming regions. MM emission from hydroxyl (OH) and formaldehyde (H2CO) are observed to trace the enhanced star formation regions in the central molecular zones (CMZ) of luminous infrared galaxies (LIRGs) (Baan 1989; Darling & Giovanelli 2002; Baan et al. 1993). In contrast, H2O MM are exclusively associated either with the circumnuclear accretion discs or jets of active galaxies (Miyoshi et al. 1995) rather than mergers or LIRGs, although kilomasers, which have luminosities of order a thousand times greater than that of typical Galactic masers can be found in LIRGs (e.g., Darling et al. 2008).
The intense maser emission observed from many transitions of methanol (CH3OH) within the Milky Way has been widely used to study the formation and evolution of the most massive stars (e.g. Green et al. 2009; Chen et al. 2014). Galactic methanol maser transitions are empirically divided into two classes (Menten 1991). Class I methanol masers are produced in regions where molecular gas is mildly shocked by processes such as outflows (e.g. Kurtz et al. 2004; Chen et al. 2009, 2011) or expanding Hii regions (Voronkov et al. 2010) . They are pumped through collisional processes. Class II methanol masers are found in the molecular gas close to young high-mass stars and are pumped by far-infrared radiation (Cragg et al. 2005).
Attempts to detect methanol masers in galaxies beyond the Milky Way have had limited success. Extragalactic methanol masers have only been detected in four galaxies, three of these being nearby galaxies – the Large Magellanic Cloud (LMC) and M31 for the 6.7 and/or 12.2 GHz class II transition detections (Green et al. 2008; Ellingsen et al. 2010; Sjouwerman et al. 2010), and NGC 253 for the 36.2 GHz class I transition detection (Ellingsen et al. 2014). The isotropic luminosity from these detected transitions is at most tens of thousands of times higher than observed for typical Galactic masers. Hence they fall several orders of magnitude short of being a megamaser. To date, more than one hundred galaxies exhibiting OH or H2O megamaser emission have been searched for methanol megamaser emission from the class II 6.7 GHz transition, but there are no reported detections (Ellingsen et al. 1994; Phillips et al. 1998; Darling et al. 2003). However, recent detections of methanol maser emission from the class I 36.2 GHz transition towards the centre of the Milky Way (Yusef-Zadeh et al. 2013) and starburst galaxy NGC 253 (Ellingsen et al. 2014) strongly suggests that methanol megamaser emission from this transition may be detectable in the central region of galaxies. This is further supported by the recent report of methanol megamaser emission from the E (84.5 GHz) transition towards the Seyfert galaxy NGC 1068 (Wang et al. 2014).
In this paper we report the first detection of both class I and class II methanol megamaser emission from the 36.2 and 37.7 GHz transitions towards the central region of Arp 220, the closest ultra-luminous infrared galaxy (adopted distance 77.6 Mpc; 1′′ = 376 pc), and an advanced merger system.
2 Observations
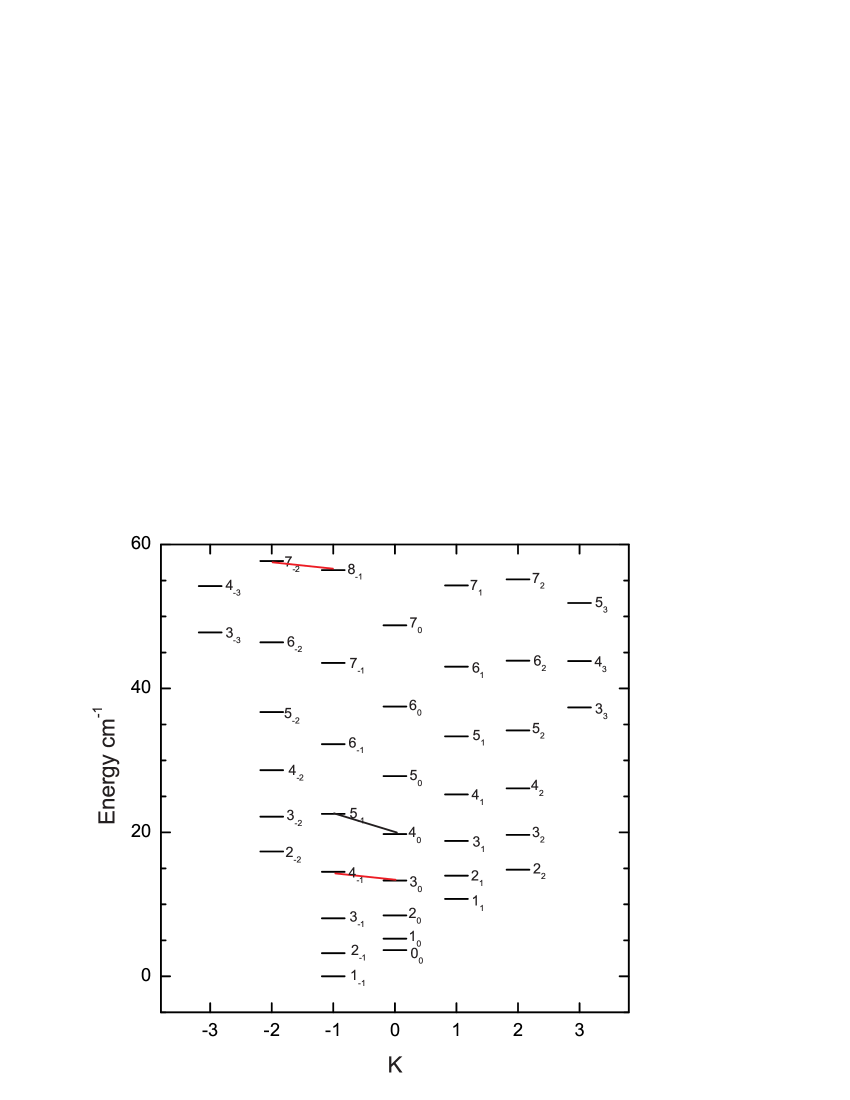
The observations were made using the ATCA in the H168 array configuration (baseline lengths between 61 and 192 m) on 2014 March 26. The synthesised beam width for the observations at 36 GHz was approximately . The data were collected using the Compact Array Broadband Backend (CABB; Wilson et al. 2011) configured with GHz bands, centered on frequencies of 35.3 and 37.3 GHz respectively. The two bands cover the rest frequencies of the E class I and E class II transitions of methanol which are at frequencies of 36.169265 and 37.703700 GHz, respectively (Müller et al. 2004). Figure 1 shows a rotational energy level diagram of E-type methanol with the targeted transitions marked. Each of the CABB bands has 2048 spectral channels each of 1 MHz bandwidth, corresponding to a velocity width of 8.3 km s-1. The observing strategy involved three cycles of 10 minutes onsource on Arp 220 (pointing centre 15:34:57.2 +23:30:12 (J2000)) interleaved with 2 minute observations of a phase calibrator (1548+056). Thus a total onsource time of 30 minutes on Arp 220 were made. PKS B1938-634 and PKS B1921-293 were observed as the amplitude and bandpass calibrators, respectively.
The data reduction was performed with MIRIAD using the standard techniques for ATCA observations. Atmospheric opacity correction was undertaken and the accuracy of the absolute flux density calibration is estimated to be 30%. Continuum emission from the central region of Arp 220 was used to produce a model for a number of iterations of phase-only self-calibration. The data for the 36.2 and 37.7 GHz methanol transitions was extracted from the self-calibrated dataset through continuum subtraction and imaged at a spectral resolution of 20 km s-1. The resulting RMS noise in a single spectral channel for the 36.2 and 37.7 GHz methanol transitions was 4 mJy beam-1.
In addition, observations which adopted the same CABB configuration setup and observing strategy as used in the March observations were also made in a Directors’ time allocation on 2014 May 16 with the 1.5D array configuration (baseline lengths between 107 and 1469 m; corresponding to a synthesised beam width of ). A further 70 minutes on-source on Arp 220 were obtained.
3 Results
Continuum emission was detected towards the center of Arp 220 as a point source with an integrated intensity of 33.3 mJy at H168 array observations. This measured intensity is similar to that ( 60 mJy) recently measured at 32 GHz with the JVLA (Barcos-Muñoz et al. 2014) within a factor of 2. Using the data collected from this array, we imaged the barycentric velocity range 4600–6200 km s-1 for both the 36.2 and 37.7 GHz methanol transitions with a velocity resolution of 20 km s-1. Other molecular species within the central region of Arp 220 (e.g., CO and HCN) show emission over a velocity range from 5000 – 5900 km s-1 (e.g., Martín et al. 2011; Greve et al. 2009). We summed the spectral channels within this velocity range to construct the integrated emission in the two methanol transitions. Figure 2 shows both the 36 GHz continuum emission and integrated methanol emission of two methanol transitions with the optical H+[N ii] 6548, 6583 intensity map (Taniguchi et al. 2012) as the background. The optical H emission is attributed to the ongoing starburst activity. From Figure 2, it can be seen that the majority of the emission from both the methanol transitions are consistent with the distribution of the optical H emission, suggesting that the advanced merger provides the physical conditions required to excite maser emission for the two methanol transitions. Notably, strong H emission is present in the two starburst nuclei of Arp 220, however no significant methanol emission was detected towards the central region of Arp 220 wherein more active starburst activity occurs. We discuss possible reasons for this in Section 4.2.
At the angular resolution () of the ATCA H168 array observations, two significant regions of 36.2 GHz methanol emission were detected. They lie southeast and northwest of the Arp 220 central region. The total extent of the methanol emission region is approximately 20″ which corresponds to 7.5 kpc for an assumed distance of 77.6 Mpc. Three significant regions of 37.7 GHz methanol emission were detected with offsets from the center of Arp 220 ranging from 7–15 ″(corresponding to 3–6 kpc).
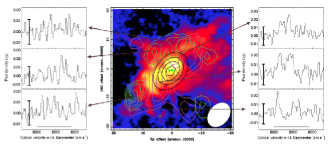
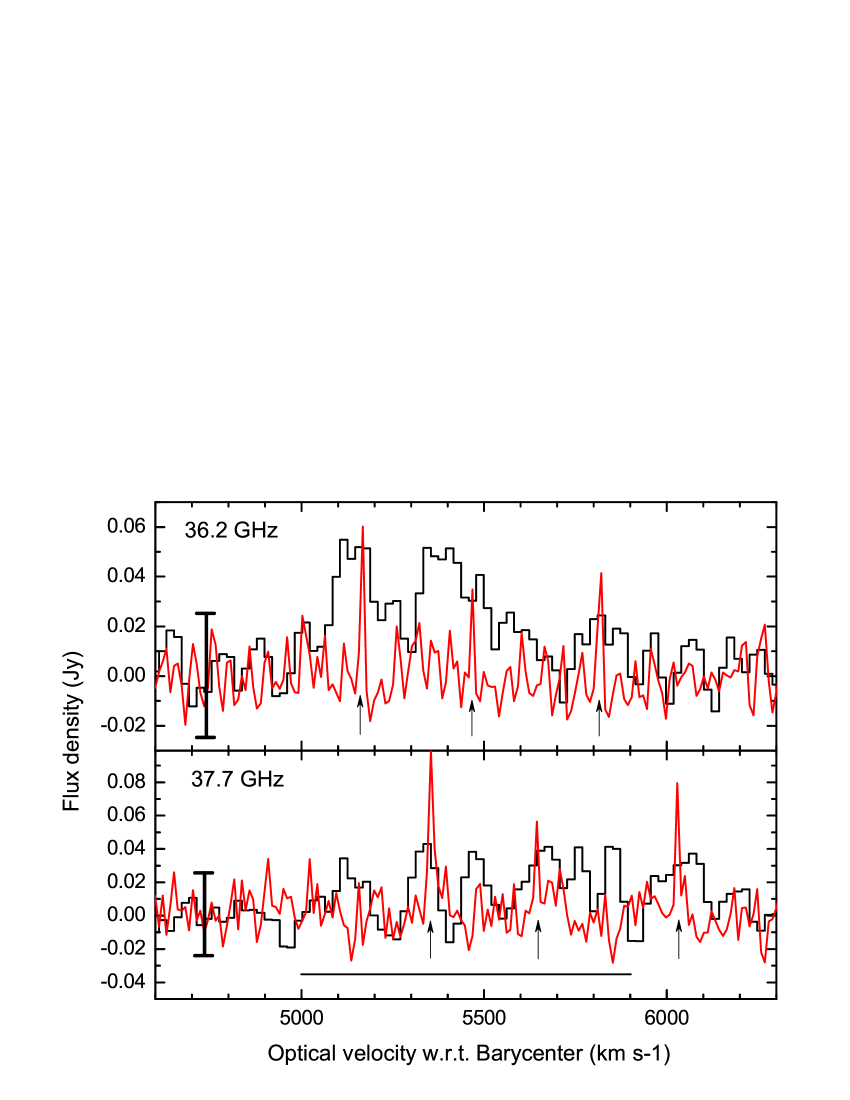
We extracted the integrated spectrum of the two methanol transitions towards the regions where significant emission is observed in the integrated intensity images, and show them in the left and right panels of Figure 2. The integrated spectra for these transitions exhibit spectral features with linewidths of several tens of km s-1 towards each of these significant methanol emission regions. The integrated spectrum over all these emission regions for the 36.2 GHz transition (presented in Figure 3) shows two main broad (110–180 km s-1) spectral components. The spectrum of the 37.7 GHz transition integrated over all emission regions (Fig. 3) shows six narrow (30–60 km s-1) features covering the velocity range of 5000 – 5900 km s-1 (Greve et al. 2009). An additional redshifted feature for the 37.7 GHz transition at a velocity of 6000 km s-1 may correspond to a separate outflow component. We performed Gaussian fitting of these spectral components and the parameters of the fits obtained are listed in Table 1.
| Gaussian Fits | ||||
|---|---|---|---|---|
| Transition | Velocity | FWHM width | Integrated flux | Peak flux density |
| (km s-1) | (km s-1) | (Jy km s-1) | mJy | |
| 36.2 GHz | 5155(14) | 110(28) | 5200(1100) | 44 |
| 5411(18) | 188(42) | 7500(1600) | 37 | |
| 37.7 GHz | 5138(13) | 65(14) | 1.7(7.1) | 24 |
| 5346(7) | 53(15) | 2.4(6.3) | 42 | |
| 5487(7) | 48(18) | 1.9(6.1) | 37 | |
| 5675(11) | 90(28) | 3.6(9.3) | 37 | |
| 5773(7) | 36(16) | 1.4(6.0) | 36 | |
| 5861(5) | 35(15) | 1.7(5.4) | 46 | |
| 6055(13) | 105(30) | 3.5(9.3) | 31 | |
For comparison, the spectra of the two transitions measured from the higher angular () and spectral resolution observations taken in the 1.5D array configuration (see Section 2) are also shown in Figure 3. Their spectra at a velocity resolution of 10 km s-1 were extracted from the uv-data by vector averaging towards the regions where methanol emission was observed in the images obtained from the H168 array observations. The higher angular resolution observations show the presence of narrower spectral components with line widths of less than about 10 km s-1 for the both methanol transitions as they were only detected in channels. The majority of the methanol emission detected for the two transitions in the H168 array observations were not detected in the 1.5D array data. However, because of the limited uv-coverage of the 1.5D array data we can not obtain useful images and can not determine if the non-detection is because the emission is resolved by the longer baseline, or if it is due to atmospheric decorrelation.
4 Discussion
4.1 The nature of the 36.2 and 37.7 GHz methanol emission
Within the Galaxy the 36.2 and 37.7 GHz masers are observed towards star formation regions (see Voronkov et al. 2014; Ellingsen et al. 2011, 2013). Based on the luminosity, narrow line widths ( 10 km s-1) and significant deviation from thermal intensities, Ellingsen et al. (2014) suggest that the 36.2 GHz methanol emission in the central region of NGC 253 are masers. The spectrum of the 36.2 GHz methanol emission detected towards Arp 220 shows much broader spectral features than those in NGC 253, however, they are still 2-3 times narrower than the other thermal molecules detected in Arp 220 which have typical linewidth km s-1 (e.g. Greve et al. 2009). The 37.7 GHz methanol emission in Arp 220 shows narrower spectral features than the 36.2 GHz transition, with typical velocity widths of 50 km s-1. The presence of very narrow spectral features (with line width of a few km s-1) in the two transitions at angular resolutions of around (taken in 1.5D array) provides strong evidence that at least some of the detected emission is from masers.
Adopting the typical excitation conditions (column density cm-2 and excitation temperature 17 K) observed for thermal methanol emission in the central region of Arp 220 (Martín et al. 2011), the predicted integrated intensity for the 36.2 and 37.7 GHz transitions are 8.2 and 0.2 K km s-1, respectively. Whereas the observed integrated intensity of the methanol emission from these two transitions from the ATCA observations (at 7′′ angular resolution) is 280 and 360 K km s-1, respectively, approximately 34 and 1800 times larger than expected if the emission is thermal. This provides further evidence that the emission from these two methanol transitions is produced by masers.
The integrated intensity of the observed 36.2 and 37.7 GHz methanol emission in Arp 220 corresponds to an isotropic luminosity of 2300 L⊙ and 3000 L⊙, respectively. Compared with the isotropic luminosity of typical Galactic methanol masers in the 36.2 and 37.7 GHz transitions of 10-5 L⊙, the emission lines are approximately eight orders of magnitude stronger than typical Galactic class I and class II methanol masers, hence they represent the first detection of methanol megamasers in both the 36.2 and 37.7 GHz transitions. Wang et al. (2014) recently reported the detection of 84.5 GHz methanol emission from NGC 1068 with a luminosity of a few million times that of typical Galactic class I methanol masers. Therefore the luminosity of 36.2 GHz methanol in Arp 220 is two orders of magnitude stronger than that of the 84.5 GHz methanol in NGC 1068. The 84.5 and 36.2 GHz methanol transitions are from the same transition family (see Figure 1) and in most Galactic sources where both have been observed the 36.2 GHz emission is significantly stronger.
4.2 The pumping mechanism for the two type methanol masers
Essentially all of the molecular emission (e.g. CO) detected in previous observations of Arp 220 originates from the CMZ region which has an extent of about 1 kpc and encompasses the two merger nuclei (Sakamoto et al. 2009). But the 36.2 and 37.7 GHz methanol emission in Arp 220 originates predominantly outside the CMZ, and this is similar to the situation observed for the 36.2 GHz methanol transition in NGC 253. The mechanism proposed by Yusef-Zadeh et al. (2013) to explain the 36.2 GHz methanol emission in the Milky Way CMZ is that high cosmic ray intensities (compared to the Galactic disk) play the key role in releasing methanol into the gas phase from cold dust grains and enhance the abundance of methanol, however, once the released into the gas-phase methanol will be rapidly destroyed if the high cosmic ray intensity is too high. Ellingsen et al. (2014) suggested that this mechanism is consistent with the observed distribution of 36.2 GHz methanol emission in NGC 253, with the absence of any emission in the inner 100 pc being due to extreme cosmic ray fluxes. However, at present there is no direct observational evidence to support this speculation.
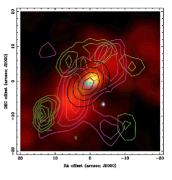
Figure 4 presents the methanol emission overlaid on the X-ray emission image of McDowell et al. (2003). This figure clearly shows that the 36.2 GHz methanol emission is highly correlated with the diffuse X-ray emission in the north-western and east-southern regions, referred to as the X-ray “plume” by McDowell et al. (2003). The central nuclear region hosts higher intensity, more compact X-ray emission, but there is no significant 36.2 GHz methanol emission associated with that gas. We expect the X-ray emission to reflect the cosmic ray intensity in Arp 220. Hence, the observed close correspondence between the 36.2 GHz methanol and diffuse X-ray emission and the anti-correlation with high-energy X-ray emission supports the hypothesis that cosmic ray intensity governs the locations where there is a significant abundance of gas-phase methanol. The X-ray plume in Arp 220 is thought to be the result of a starburst-generated superwind (McDowell et al. 2003). The superwind represents regions with both rapidly outflowing and inflowing shock-heated gas, which may provide the collisional pumping agent for the widespread 36.2 GHz class I methanol emission. The methanol is pumped in the expanding shocks surrounding the X-ray cocoon and the distributed emission results from amplification of background or embedded radio continuum. The shocks within Galactic star formation regions produce class I maser emission distributed on scales of around 1 pc, while the plume region in Arp 220 has a scale two to three orders of magnitude larger.
Within the Milky Way class II methanol masers and OH masers are often co-located on arcsecond scales, although they are not cospatial on milliarcsecond scales (Menten et al. 1992; Li et al. 2012), and both species are pumped by emission at far-infrared (FIR) wavelengths produced by warm dust (Cragg et al. 2005). In Arp 220, the OH and H2CO megamaser emission is observed towards the positions of the two nuclei (see Figs. 2 and 4), and are thought to result from FIR pumping and amplification of background radio continuum (Rovilos et al. 2003; Baan 1985, 1989). There is one previous detection of a class II methanol transition towards Arp 220, with a detection of the 6.7 GHz transition in absorption (rather than as a maser) (Salter et al. 2008). The 37.7 GHz class II methanol emission regions observed in Arp 220 do not spatially correlate with the X-ray structure, but rather surround/straddle the region. As for the 36.2 GHz transition, 37.7 GHz emission arises on much larger scales than the OH and H2CO masers and is significantly offset from the nucleus. The 37.7 GHz emission regions represents the location of cooler and denser gas at the edge of the diffuse X-ray emission, possibly in regions of triggered star formation, which may host gas with enhanced methanol abundance either produced in-situ or driven there by outflows from the plume region. However, existing radio and infrared observations of Arp 220 show no significant counterparts from these regions.
5 Conclusion
We have detected the first 36.2 and 37.7 GHz methanol megasers towards the major merger galaxy Arp 220. The characteristics of the spectral lines and the spatial distribution of the 36.2 and 37.7 GHz methanol megamaser emission is significantly different from that of the megamasers of other species and the thermal molecular emission in Arp 220. The observed methanol megamasers trace larger-scale feedback (e.g. outflows) and star formation in circumnuclear starburst regions of a merger system, in contrast to other species of megamaser which originate close to the nucleus. Therefore, methanol megamasers will trace a different physical environment and provide diagnostic and structural information that is complementary to those of other molecular transitions observed in starbursts and the feedback systems in active galaxies.
6 Acknowledgements
Our results are based on the observations made using the Australia Telescope Compact Array (ATCA), which is part of the Australia Telescope National Facility funded by the Commonwealth of Australia for operation as a National Facility managed by CSIRO. We thank Dr. Taniguchi Y. for his providing optical H line data. XC acknowledges supports from the National Natural Science Foundation of China (11133008 and 11273043), the Strategic Priority Research Program of the Chinese Academy of Sciences (CAS; Grant No. XDA04060701), Key Laboratory for Radio Astronomy, CAS. WAB has been supported as a Visiting Professor of the Chinese Academy of Sciences (KJZD-EW-T01) Shari Breen is the recipient of an Australian Research Council DECRA Fellowship (project No. DE130101270).
References
- Baan (1989) Baan, W.A. 1989, ApJ, 338, 804
- Baan (1985) Baan, W. A. 1985, Nature, 315, 26
- Baan et al. (1993) Baan, W. A., Haschick, A. D., & Uglesich, R. 1993, ApJ, 415, 140
- Barcos-Muñoz et al. (2014) Barcos-Muñoz, L., Leroy, A. K., Evans, A. S., et al. 2014, ApJ, Accepted
- Chen et al. (2014) Chen, X., Ellingsen, S. P., Gan, C. G., et al. 2014, Chin Sci Bull, 59, 1066
- Chen et al. (2009) Chen, X., Ellingsen, S. P., Shen, Z. Q. 2009, MNRAS, 396, 1603
- Chen et al. (2011) Chen, X., Ellingsen, S. P., Shen, Z. Q., Gan, C. G., Titmarsh, A. 2011, ApJS, 196, 9
- Cragg et al. (2005) Cragg, D. M., Sobolev, A. M. & Godfrey, P. D. 2005, MNRAS, 360, 533
- Darling et al. (2008) Darling, J., Brogan, C., & Johnson, K. 2008, ApJL, 685, 39
- Darling & Giovanelli (2002) Darling, J. & Giovanelli, R. 2002, AJ, 124, 100
- Darling et al. (2003) Darling, J., Goldsmith, P., Li, D., & Giovanelli, R. 2003, AJ, 125, 1177
- Ellingsen et al. (2010) Ellingsen, S. P., Breen, S. L., Caswell, J. L., Quinn, L. J., & Fuller, G. A. 2010, 404, 779
- Ellingsen et al. (2011) Ellingsen, S. P., Breen, S. L., Sobolev, A. M., Voronkov, M. A., Caswell, J. L., & Lo, N. 2011, ApJ, 742, 109
- Ellingsen et al. (2013) Ellingsen, S. P., Breen, S. L., Voronkov, M. A., & Dawson, J. R. 2013, MNRAS, 429, 3501
- Ellingsen et al. (2014) Ellingsen, S. P., Chen, X., Qiao, H. Q., Baan, W., An, T., Li, J., & Breen, S. L. 2014, ApJL, 790, 28
- Ellingsen et al. (1994) Ellingsen, S. P., Norris, R. P., Whiteoak, J. B., et al. 1994, MNRAS, 267, 510
- Green et al. (2009) Green, J. A., Caswell, J. L., Fuller, G. A., et al. 2009, MNRAS, 392, 783
- Green et al. (2008) Green, J. A., Caswell, J. L., Fuller, G. A., et al. 2008, MNRAS, 385, 948
- Greve et al. (2009) Greve, T. R., Papadopoulos, P. P., Gao, Y., & Radford, S. J. E., 2009, ApJ, 692, 1432
- Kurtz et al. (2004) Kurtz, S., Hofner, P., & Álvarez, C. V. 2004, ApJS, 155, 149
- Li et al. (2012) Li, J. J., Moscadelli, L., Cesaroni R., et al. 2012, ApJ, 749, 47
- Martín et al. (2011) Martín, S., Krips, M., Martín-Pintado, J., et al. 2011, A&A, 527, 36
- McDowell et al. (2003) McDowell, J. C., Clements, D. L., Lamb, S. A., et al. 2003, ApJ, 591, 154
- Menten (1991) Menten, K. M. 1991, ASP Conf. Ser. 16, 119
- Menten (1992) Menten, K. M., Reid, M. J., Pratap, P., Moran, J. M., & Wilson, T. L., 1992, ApJ, 401, L39
- Miyoshi et al. (1995) Miyoshi, M., Moran, J., Herrnstein, J., et al. 1995, Nature, 373, 127
- Müller (2004) Müller, H. S. P., Menten, K. M., & Mäder, H. 2004, A&A, 428, 1019
- Müller (2004) Müller, H. S. P., Thorwirth, S., Roth, D. A., & Winnewisser, G. 2001, A&A, 370, L49
- Phillips et al. (1998) Phillips, C. J., Norris, R. P., Ellingsen, S. P., & Rayner, D. P. 1998, MNRAS, 294, 265
- Rovilos et al. (2003) Rovilos, E., Diamond, P., Lonsdale, C., Smith, H., & Lonsdale, C. 2003, MNRAS, 359, 827
- Sakamoto et al. (2009) Sakamoto, K., Aalto, S., Wilner, J., et al. 2009, ApJ, 700, L104
- Salter et al. (2008) Salter, C. J., Ghosh, T., Catinella, B. et al. 2008, AJ, 136, 389
- Sjouwerman et al. (2010) Sjouwerman, L. O., Murray, C. E., Pihlström, Y. M., Fish, V. L., & Araya, E. D. 2010, ApJ, 724, L158
- Taniguchi et al. (2012) Taniguchi Y., Matsubayashi, K., Kajisawa, M., et al. 2012, ApJ, 753, 78
- Voronkov et al. (2014) Voronkov, M. A., Caswell, J. L., Ellingsen, S. P., Green, J. A., & Breen, S. L. 2014, MNRAS, 439, 2584
- Vornokov et al. (2010) Voronkov, M. A., Caswell, J. L., Ellingsen, S. P., & Sobolev, A. M. 2010, MNRAS, 405, 2471
- Wang et al. (2014) Wang, J. Z., Zhang, J. S., Gao, Y., Zhang, Z. Y., Li, D., Fang, M., Shi, Y. 2014, NatCo, 5, 5449
- Wilson et al. (2011) Wilson, W. E., Ferris, R. H., Axtens, P., et al. 2011, MNRAS, 416, 832
- Yusef-Zadeh et al. (2013) Yusef-Zadeh, F., Cotton, W., Viti, S., Wardle, M., & Royster, M. 2013, ApJ, 764, L19