ALMA Multi–line Imaging of the Nearby Starburst NGC 253
Abstract
We present spatially resolved (50 pc) imaging of molecular gas species in the central kiloparsec of the nearby starburst galaxy NGC 253, based on observations taken with the Atacama Large Millimeter/submillimeter Array (ALMA). A total of 50 molecular lines are detected over a 13 GHz bandwidth imaged in the 3 mm band. Unambiguous identifications are assigned for 27 lines. Based on the measured high CO/C17O isotopic line ratio (350), we show that 12CO() has moderate optical depths. A comparison of the HCN and HCO+ with their 13C–substituted isotopologues shows that the HCN(1–0) and HCO+(1–0) lines have optical depths at least comparable to CO(1–0). H13CN/H13CO+ (and H13CN/HN13C) line ratios provide tighter constraints on dense gas properties in this starburst. SiO has elevated abundances across the nucleus. HNCO has the most distinctive morphology of all the bright lines, with its global luminosity dominated by the outer parts of the central region. The dramatic variation seen in the HNCO/SiO line ratio suggests that some of the chemical signatures of shocked gas are being erased in the presence of dominating central radiation fields (traced by C2H and CN). High density molecular gas tracers (including HCN, HCO+, and CN) are detected at the base of the molecular outflow. We also detect hydrogen recombination lines that, like their counterparts, show compact, centrally peaked morphologies, distinct from the molecular gas tracers. A number of sulfur based species are mapped (CS, SO, NS, C2S, H2CS and CH3SH) and have morphologies similar to SiO.
Subject headings:
galaxies: formation — galaxies: evolution — individual galaxy (NGC 253) — astrochemistry; ISM — radio lines1. Introduction
Characterizing the physical properties of the molecular gas phase in galaxies, the key phase for star formation (review by Kennicutt & Evans 2012), is among the main drivers in the studies of nearby galaxies. The 12CO line is by far the brightest millimeter–wave molecular line in the interstellar medium (ISM) and has therefore been the main tracer of the molecular medium in both low– and high–redshift studies (e.g., reviews by Bolatto, Leroy & Wolfire 2013 and Carilli & Walter 2013). Even though CO emission is a reasonable tracer of the morphology and mass associated with the molecular ISM, observations of other tracer molecules, that have different critical densities and excitation temperatures, provide key information to constrain the physical processes in the ISM. Studying a whole suite of molecular line tracers sheds light on the chemical state of the ISM, including the gas cooling and ionization balance in the molecular ISM. Ultimately, surveying provides the means by which to characterize molecular cloud conditions that are affected by the galactic environment, including feedback and shocks caused by star formation, and dynamical processes within a galaxy (e.g., Meier & Turner 2005).
Millimeter line surveys of nearby galaxies using single–dish telescopes have shown that their spectra are rich in molecular lines (e.g., Usero et al. 2004, Martin et al. 2006, Costagliola et al. 2011, Snell et al. 2011, Aladro et al. 2011, 2013). However, given the resolution of single–dish telescopes, most of these studies could only provide integrated measurements, making it difficult to investigate spatial changes in chemical properties. Spatially resolved surveys using millimeter interferometers have been limited to only a handful of transitions due to small bandwidths and low sensitivity (e.g., Meier & Turner 2005, 2012, Meier et al. 2014, Martin et al. 2014). These studies demonstrate the presence of strong chemical differentiation can exist within the molecular gas in nearby galaxies and their usefulness for constraining the evolutionary properties of the nucleus.
The newly commissioned ALMA facility is revolutionizing chemical studies of galaxies. Its sensitivity, even in ‘Early Science’ mode is unprecedented, and molecules that are typically significantly fainter than the brightest ones (i.e., CO, HCN, HCO+, CN) can be detected in reasonable integration times. In addition ALMA’s large instantaneous bandwidth of =8 GHz implies that multiple lines (in particular in the 3 mm band where / is highest) are covered in each observation. The study presented here does not intend to discuss the details of every detected line but instead present the data and highlight the rich chemistry provided by ALMA’s new capabilities, in the nearby starburst galaxy NGC 253. This paper complements two other studies of NGC 253 using the same dataset, one describing the molecular outflow revealed in 12CO emission (Bolatto et al. 2013, hereafter B13) and the other constraining the molecular clump properties in the central starburst region using the brightest dense gas tracers available (Leroy et al. 2014, hereafter L14).
The paper is structured as follows: Sec. 2 briefly summarizes the observations, data reduction and data products. In Sec. 3 we present our identification of the rich suite of molecular line emission in the galaxy. We then proceed to sketch a simple picture of the conditions in the central region of NGC 253, by focusing on several groups of key molecular gas tracers (Sec. 4). We conclude by providing a short summary in Sec. 5. Throughout the paper we adopt a distance to NGC 253 of 3.5 Mpc (Rekola et al. 2005), i.e., 1 corresponds to 17 pc at that distance. The systemic velocity of NGC 253 is 250 km s-1 (e.g., Houghton et al. 1997).
2. Observations and Data Reduction
Observations: We have mapped NGC 253 with ALMA in cycle 0 (16 antenna array) in two different frequency setups and configurations. Details regarding the observations and data reduction can be found in B13 and L14 and we here summarize the observational parameters that are most relevant for the current study. Both setups covered an instantaneous bandwidth of 8 GHz each: The first frequency setup, covering 85.6–89.6 GHz (lower side–band, LSB) and 97.4–101.4 GHz (upper side–band, USB), is a central 3–point mosaic along the major axis in the extended configuration (average beam size: 2, 35 pc). This mosaic covers the central 1′ (1 kpc) of NGC 253’s starburst. The second setup covers 99.8–103.7 GHz (LSB) and 111.8–115.7 GHz (USB) and is a 7–point mosaic of NGC 253’s center in the compact configuration. This yields an average beam size of 4 (70 pc) and a field of view of roughly 1.5′ (1.5 kpc).
| Transition | Rest Frequency | Setup | Comments |
|---|---|---|---|
| (GHz) | |||
| 86.054 | ext, LSB | tent. ID | |
| SO(=22-11) | 86.09395 | ext, LSB | |
| H13CN(1–0) | 86.34016 | ext, LSB | |
| HCO(=11,0–00,0) | 86.67076 | ext, LSB | |
| H13CO+(1–0) | 86.75429 | ext, LSB | |
| SiO(2–1; =0) | 86.84696 | ext, LSB | |
| HN13C(1–0) | 87.09085 | ext, LSB | |
| C2H(=1-0;=3/2-1/2) | 87.31690 | ext, LSB | main C2H FS component |
| C2H(1-0;1/2-1/2) | 87.40199 | ext, LSB | secondary C2H FS component |
| 87.567 | ext, LSB | poss. ID: | |
| 87.785 | ext, LSB | tent. ID | |
| 87.853 | ext, LSB | tent. ID | |
| HNCO() | 87.92524 | ext, LSB | |
| H(52) | 88.40569 | ext, LSB | |
| HCN(1–0) | 88.63160 | ext, LSB | |
| HCO+(1–0) | 89.18852 | ext, LSB | |
| 97.720 | ext, USB | tent. ID | |
| CS(2–1) | 97.98095 | ext, USB | |
| 98.525 | ext, USB | tent. ID; blend: () & () | |
| 98.667 | ext, USB | no obvious ID | |
| H(40) | 99.02295 | ext, USB | |
| H(50) | 99.22521 | ext, USB | |
| SO() | 99.29987 | ext, USB | |
| 99.669 | ext, USB | no obvious ID | |
| 99.86651 | ext, USB | ||
| HC3N(11–10) | 100.07640 | ext, USB, comp, LSB | |
| 100.542 | ext, USB, comp, LSB | poss. ID: | |
| 100.612 | ext, USB, comp, LSB | poss. IDs: | |
| 100.632 | ext, USB, comp, LSB | poss. IDs: NH2CN(); | |
| 100.992 | ext, USB, comp, LSB | poss. ID: | |
| CH3SH()A+E | 101.13916 | ext, USB; comp, LSB | |
| 101.180 | ext, USB; comp, LSB | tent. ID | |
| H2CS() | 101.47788 | comp, LSB | ortho-H |
| 101.892 | comp, LSB | tent. ID | |
| 101.988 | comp, LSB | no obvious ID | |
| 102.070 | comp, LSB | tent. ID | |
| CH3C2H() | 102.54798 | comp, LSB | |
| H2CS | 103.04054 | comp, LSB | para: (), (), () |
| C2S() | 103.64075 | comp, LSB | |
| 112.247 | comp, USB | tent. ID | |
| C17O(1–0) | 112.35928 | comp, USB | |
| 112.459 | comp, USB | tent. ID, blend: () & () | |
| CN(1-0;1/2-1/2) | 113.19128 | comp, USB | secondary CN FS group |
| CN(1-0;3/2-1/2) | 113.49097 | comp, USB | main CN FS group |
| 114.218 | comp, USB | poss. IDs: CO(1-0; v=1); | |
| C4H(12-11; 25/2-23/2& 23/2-21/2) | |||
| 114.605 | comp, USB | no obvious ID | |
| 114.952 | comp, USB | ||
| NS(5/2-3/2;7/2-5/2) | 115.15394 | comp, USB | blended with CO |
| CO(1–0) | 115.27120 | comp, USB | Bolatto et al. 2013 |
| NS(5/2-3/2;7/2-5/2) | 115.55625 | comp, USB |
Note. — Note: species in italics represent tentative identifications. In these cases, the frequency listed is the observed one corrected to rest frequency based on the known velocity field and does not reflect the rest frequency of the tentatively identified line. Lines labeled are the ones that we could not securely identify, and in some cases we give possible ID’s in the last column.
Data reduction: All of the calibration and imaging of the data cubes was completed within CASA, including self–calibration to remove residual phase and flux calibration errors. After imaging, much of the remaining analysis was performed with IDL scripts with some use of the Miriad and Matlab software packages. Most of the data presented here is based on the continuum–subtracted cube, where the continuum was defined in those spectral regions where no line emission was evident. Our final cube has 20 km s-1 velocity resolution and a typical RMS of 2.0 mJy beam-1 (extended, LSB: 1.9 mJy, extended, USB: 2.1 mJy, compact, LSB: 2.0 mJy, compact, USB: 3.3 mJy).
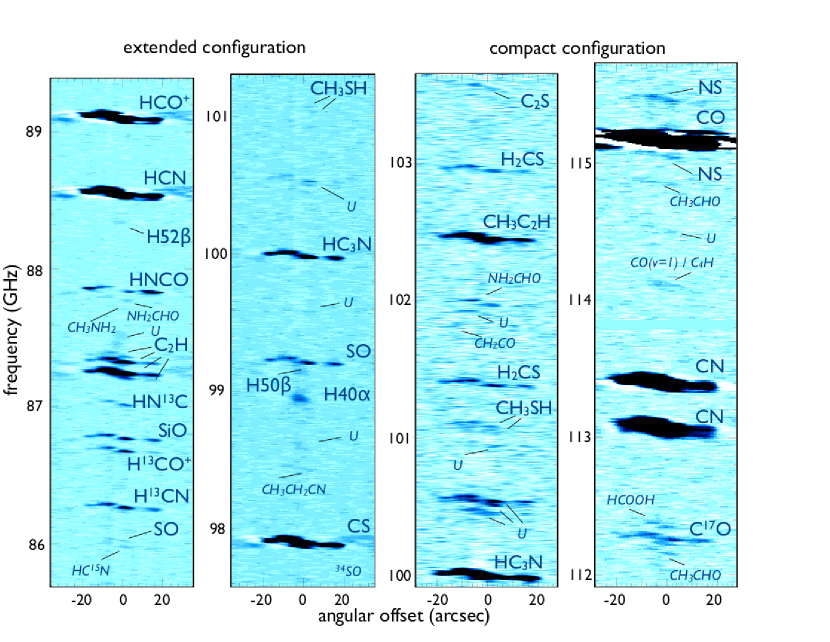
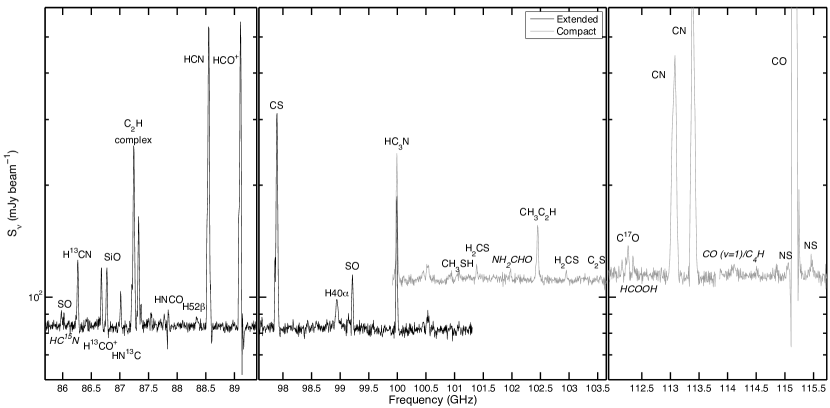
Final data cubes: We display the information in the data cubes in two complementary fashions: through a position–velocity (pV) diagram along the major axis of NGC 253 in Fig. 1; a representation similar to long–slit spectroscopy in optical/NIR astronomy (Fig. 1). The second (Fig. 2) is a single spectrum taken toward a central molecular peak (position 5). As outlined above, the data consist of four final data cubes, the LSB and USB cubes for the extended configuration, and those for the compact configuration. Figs. 1 and 2 also show our line identification (see also Tab. 1), as further discussed in Sec. 3.
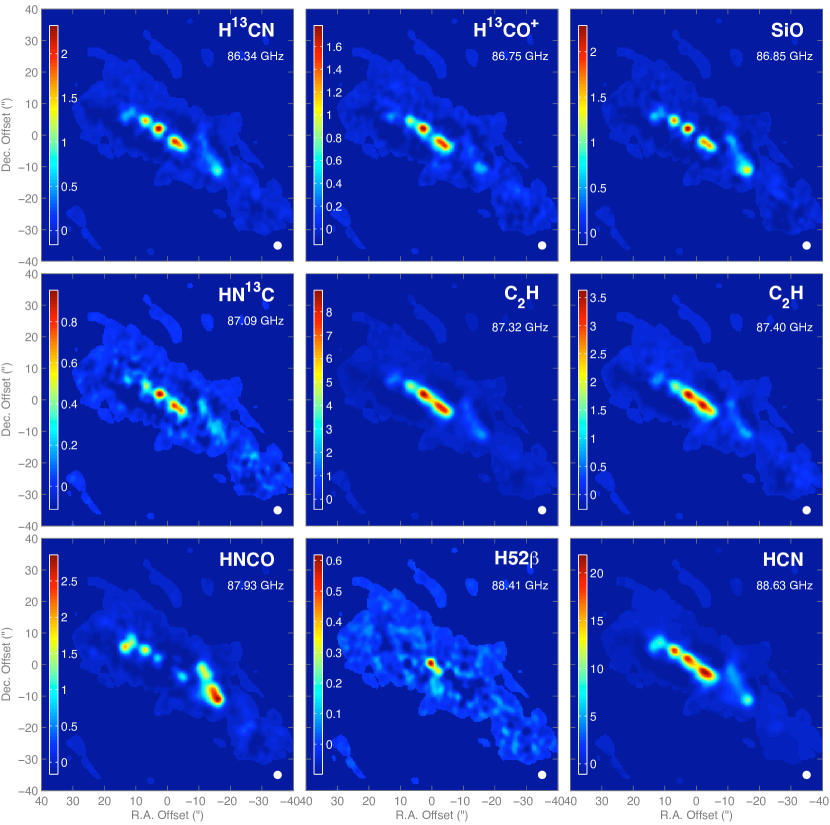
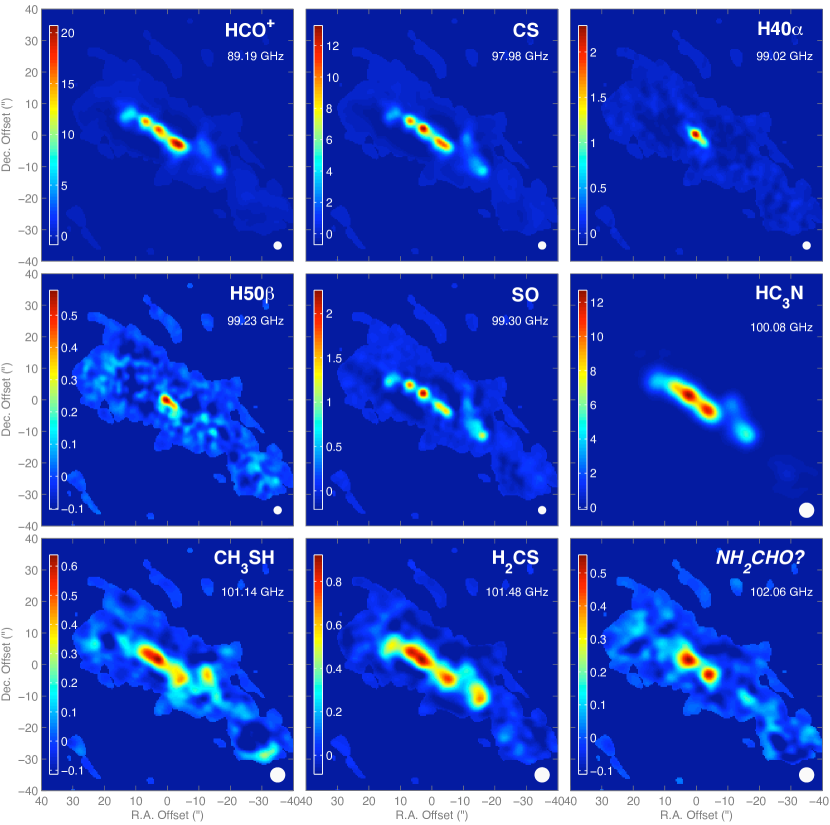
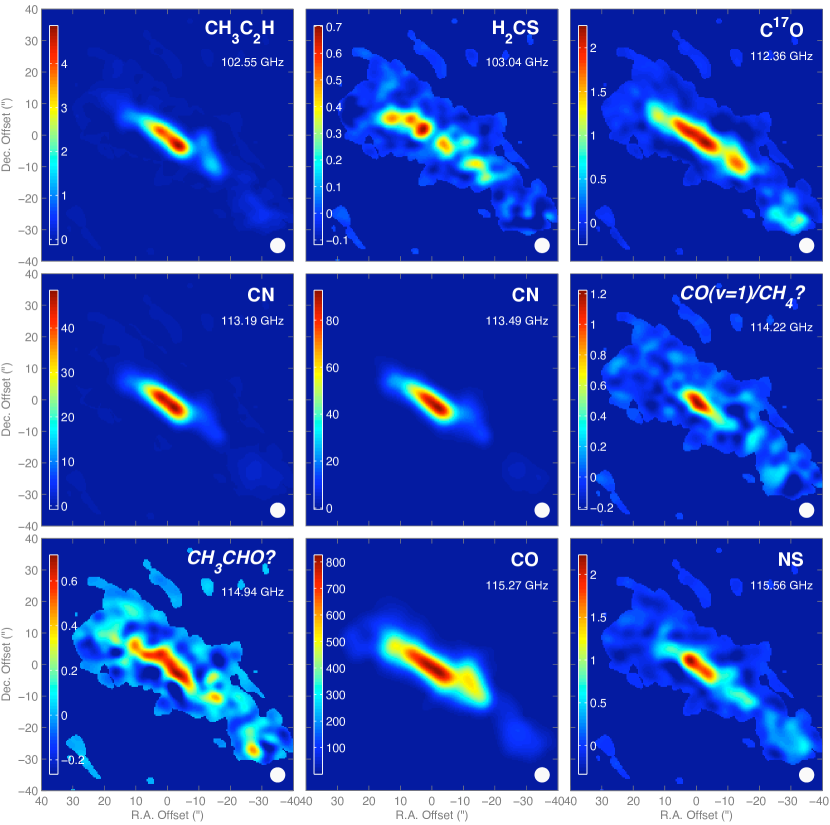
Integrated line maps: We created line cubes for each line, and then blanked those with a mask derived from the CO(1-0) line (by far the brightest line in the bandpass). The integrated intensity map for a given line was then derived by simply adding all data in the respective data cube (without any further flux cutoff). Integrated line maps are corrected for primary beam attenuation and are shown in Fig. 3.
| Region | RA(2000.0) | DEC(2000.0) |
|---|---|---|
| 1 | 00 47 33.041 | -25 17 26.61 |
| 2 | 00 47 32.290 | -25 17 19.10 |
| 3 | 00 47 31.936 | -25 17 29.10 |
| 4 | 00 47 32.792 | -25 17 21.10 |
| 5 | 00 47 32.969 | -25 17 19.50 |
| 6 | 00 47 33.159 | -25 17 17.41 |
| 7 | 00 47 33.323 | -25 17 15.50 |
| 8 | 00 47 33.647 | -25 17 13.10 |
| 9 | 00 47 33.942 | -25 17 11.10 |
| 10 | 00 47 34.148 | -25 17 12.30 |
| Map | 00 47 33.100 | -25 17 17.50 |
Uncertainties: We calculated error maps by taking the number of channels per pixel into account. An inspection of the data cubes revealed that these error maps provide too optimistic uncertainties, as they do not account for artifacts (in particular the negative ‘bowl’ due to the missing short spacings) in the current data. We thus adopt a conservative 10% error for pixels that have been detected at high / (), where the noise is from taken from our error maps. For pixels that are detected at lower / (5SN10) we adopt an even more conservative 30% uncertainty, to also account for possible issues in baseline determination. We ignore all pixels that have a /5 in the analysis that follows. We present our line intensity measurements towards 10 positions in NGC 253 (Fig. 4, coordinates in Tab. 2) in Tab. 3. Toward the center of the galaxy (in particular region 6, Fig. 4) line emission is observed against strong continuum (L14). Some resulting absorption will decrease the integrated line signal at these locations. Because of this the fluxes toward this location should be considered highly uncertain.
Spatial filtering: As ALMA is an interferometer it acts as a spatial filter, sampling only a range of spatial scales. So the observations will potentially resolve out some flux. In the compact (extended) configuration spatial scales of 12 – 47 k (23 – 100 k) [90th percentile] were sampled, corresponding to 4.4″ – 18″ (2″ – 9″). Hence the observations should adequately sample fluxes uniform over 10″ (in one channel). The one exception to this is 12CO(1–0), which has been zero-spacing corrected and therefore detects all flux (see discussion in B13). It is not possible to estimate the percentage of detected flux for every line in the survey because suitable single-dish observations are often not available. We do, however, determine this fraction for a number of transitions where possible. For the following transitions we calculate detected flux percentages over single-dish beam of 22 ″ – 28″ of: HCN(1–0) — 100 % (Paglione et al 1995), HCO+(1–0) — 55 % (Martin et al. 2009), C17O(1–0) — 60 % (Henkel et al. 2014), SiO(2–1) — 110 % (Martin et al. 2009), CN(1–0; – ) — 60 % (Henkel et al. 2014), C2H(1–0; – ) — 60 % (Nakajima et al. 2011) and HNCO(–) — 50 % (Nguyen-Q-Rieu et al. 1991) [though this value is highly uncertain because HNCO does not peak where Nguyen-Q-Rieu et al. pointed]. Therefore, it appears that the data consistently detect at least 50 % of their respective single dish fluxes. Furthermore our discussion focuses on the compact clumps of emission, where much higher fractions of the flux are detected (90 %). (In fact, spatial filtering of the interferometer actually affords advantages because it allows the separation of these compact structures from any extended diffuse medium that can dominate single-dish observations.) Finally, we avoid comparing line intensities derived from different array configurations wherever possible in this study, to further mitigate against differences in resolved flux. Hence we conclude that uncertainties in line ratios due to different degrees of missing flux are 10 %.
3. Results
3.1. The Nucleus of NGC 253
The nucleus of NGC 253 is characterized by the inner portion of NGC 253’s large–scale bar: The highly inclined () nuclear disk extends from the very center out to a radius, pc. In some transitions emission is seen out to the edge of the mosaic. The outer part of the nuclear disk (the ‘outer nuclear disk’) is suggested to represent the location where gas flowing radially inward along the large-scale bar collects between the outer and inner Lindblad resonance (Garcia-Burillo et al. 2000). Embedded within the outer disk is a compact ( pc) region exhibiting a large quantity of high density gas and intense star formation, which is discussed in detail in Section 4.2. A molecular gas outflow/wind is being driven from this inner nuclear disk, as discussed in B13.
We have selected 10 individual locations that span the nuclear disk and the base of the molecular outflow in NGC 253 (Tab. 2). Regions 3–9 trace the inner starburst disk from west to east and regions 5 and 6 are coincident with the detected millimeter continuum emission in the galaxy (L14). Regions 1 and 10 are located at the western and eastern base of the southern molecular outflow (B13). Region 2 indicates the shocked region towards the north. The GMC physical properties in these regions are discussed in detail in L14. We further caution that some of our line measurements towards region 6 (the center) may be affected by absorption and continuum subtraction uncertainties (as discussed in Sec. 2).
In Tab. 1 we provide a summary of all detected lines (column 1), their rest frequencies (column 2) and observational setup (column 3). For each of our 10 regions, we measure the peak integrated intensity (in K km s-1) at that position and report the values in Tab. 3. We measure all values from beam–matched maps, i.e., all the compact and extended configuration data have been convolved to a common resolution, respectively (this common resolution is given in column 4 of Tab. 3, whereas column 3 gives the original resolution). We have discussed our uncertainty estimates in Sec. 2. Tab. 3 also includes the intensity measurement in each transition for the entire galaxy (columns 5 and 6).
3.2. Molecular Emission Across NGC 253’s Nucleus
Fig. 1 shows the position–velocity (pV) diagram oriented along the molecular bar (i.e., along the major axis of the galaxy) of all four data cubes. This figure shows the richness of the ALMA data cubes, and the challenges in finding the correct line identification. Already from this presentation it is clear that the emission of the different line species emerge from different regions in the galaxy.
We detect at least 50 emission lines in total of which 27 have unambiguous identifications. This corresponds to a detection ratio of one line every 0.25 GHz. Species printed in italics are tentative IDs (13 lines). These lines have clear candidate transitions from a species not yet well established in extragalactic systems (see Sec. 3.3). The candidate IDs are given in column 4 of Tab. 1. In some cases we were not able to find a plausible line identification or the broadness of the spectral line prohibited a unique identification. Those lines are labeled U (unidentified; 10 cases). In those cases we give our best estimate for each feature’s rest frequency in column 2.
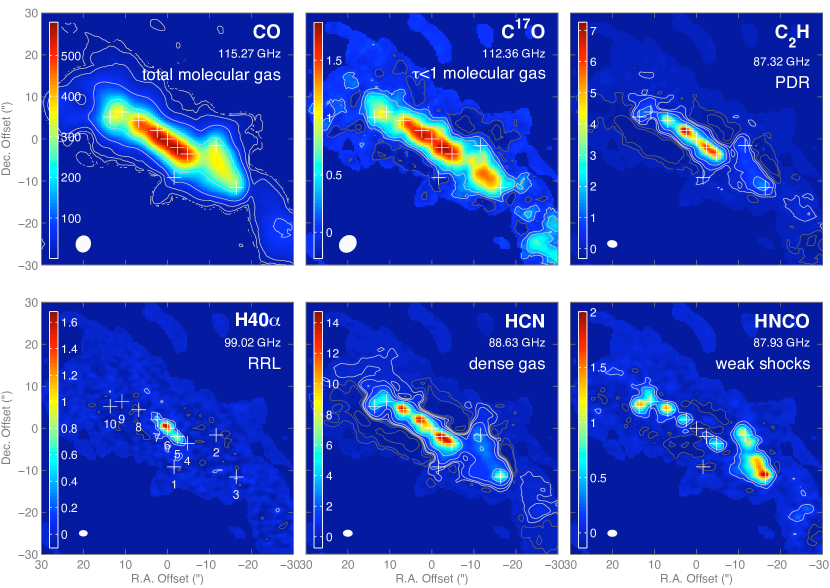
We show line maps for 27 of the bright, unblended lines in Fig. 3. In Fig. 4 we select out six species that summarize the basic morphological patterns seen in the sample. Each represent key tracers of the different phases of the molecular gas, as discussed below. These are: 12CO, a tracer for the overall molecular gas distribution, 12C17O, an optically thin tracer of molecular gas emission, C2H, a photon-dominated region (PDR) tracer, H40, a hydrogen recombination line and H II region tracer, HCN, a high–density gas tracer and HNCO, a weak shock tracer.
From Figs. 3 and 4 it is apparent that the morphologies change significantly between species (as is already evident from Fig. 1). Molecular gas column densities remain quite large across the entire nuclear disk, maintaining N(H2) cm-2 over much of the disk (Sec. 3.4). The wide range of dense gas tracers observed demonstrates that dense gas is present across much of this region, but the dense gas fraction increases toward the inner disk (L14). The millimeter hydrogen recombination lines, including for the first time H lines, show that dense H II regions associated with the young starburst (or possibly AGN; Mohan et al. 2002) are confined to the innermost part of this inner disk. Species like C2H, CN and CH3C2H also dominate from this inner nuclear disk. HNCO, on the other hand, is dominated by the outer nuclear disk.
The brightest and most widespread transitions (HCN, HCO+ and CN) show weak emission extended vertically between 1 and 2, following the base of the molecular outflow, suggesting there is dense molecular gas here. However, we do not discuss the dense gas tracers in the outflow in detail here due to the difficulties dealing with the morphology of the maps above and below the disk in the presence of the negative ’bowl’.
3.3. Tentative and Unidentified Lines
There are a number of detected lines for which no clear identification was possible. We have listed tentative identifications in Tab. 1 – in some cases no plausible species were found, and these lines constitute unidentified (U) lines. The majority of these tentative identifications (but not tentative detections) match prominent transitions from larger molecules, including the aldehydes CH3CHO and NH2CHO, cyanides CH2CN and CH3CH2CN and a number of organics of similar complexity, CH2CO, HCOOH and CH3CH2OH. These molecules are abundant in the Galactic center (e.g., Cummins et al. 1986) and are expected to be detectable at our sensitivity in NGC 253. If follow–up, multi-line studies confirm these IDs then they would represent their first extragalactic detections.
3.4. Excitation and Abundances
When appropriate, an estimate of abundances is made for the detected species. Molecular column densities are determined assuming optically thin LTE emission:
| (1) |
where the line strength, and ’s and are the upper state degeneracy and energy, respectively, is the partition function, is the dipole moment in debye and is the excitation temperature associated with the transition (e.g., Turner 1991). For the symmetric (CH3SH) and asymmetric (HNCO, H2CS) tops is proportional to T, whereas for the linear rotors (the rest) is proportional to Tex.
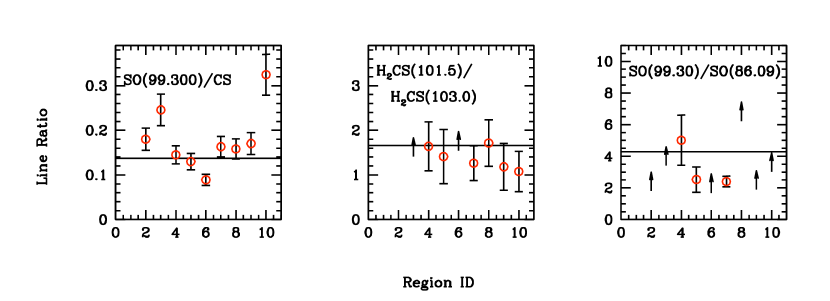
To calculate abundances it is necessary to adopt an Tex. Since this survey covers only one band, gas excitation is not the focus of this project. The only lines that are detected and directly constrain gas excitation is a pair of SO transitions, SO() and SO(). From this pair, an excitation temperature is estimated, via:
| (2) |
where R is the intensity ratio, SO(/SO(. Towards the inner nuclear disk this ratio has a value of R2.5. There is some evidence for the ratio to increase towards the outer nuclear disk (R4), but the faintness of SO( limits what can be said. For these ratios, we estimate the inner disk to have an excitation temperature of 74 K in SO, dropping to T17 K. Indirect methods of estimating Tex can also be achieved by radiative transfer modeling (see section 4.2). There Tex is found to range between 6 – 45 K. Therefore, Tex likely falls between at least 10 – 75 K, across much of the nuclear region. Ott et al. (2005) use NH3 to estimate gas kinetic temperatures, Tkin, across the inner nuclear disk of approximately twice the 74 K measured here, however Knudsen et al. (2007) (and this paper) favor Tkin nearer this value for HCN and HCO+ (see section 4.2). The drop in Tex toward the outer nuclear disk region reflects SO becoming more strongly sub-thermal in lower density gas.
The relevant excitation temperature for a given species / transition depends on a number of factors, including gas density, opacity, molecular structure and location within the nucleus. For transitions with effective critical densities significantly above the gas density, Tex will be lower than the Tkin (subthermal excitation). Changes in and Tkin with position in the nucleus imply changes in excitation. The effective critical density of a species depends on line opacity, , (photons become an effective ’collision’ partner) and hence abundances, with high opacity lowering critical densities, , roughly in proportion to . Finally, even in the case that a transition is thermalized, the LTE calculated columns are strict upper limits because it assumes that all transitions of the molecule are thermalized up to arbitrarily high energies.
With these caveats stated, abundances are the important astrochemical variable and so we report ’reference’ ranges. In Table 4, abundances are reported for Tex ranging from 10 K (first number in each entry) to 75 K (second number). Also included in the the table are (not including opacity effects) for the transitions. It is expected that for the inner nuclear disk positions transitions with moderate (e.g., C17O, HNCO, H2CS, C2H, HCO+, and SO) will have Tex at the high end of the range. High transitions and outer nuclear disk locations likely will have Tex (and hence abundances) at the low end of the range. Future, follow up, multi-line studies of different species are necessary to narrow these quoted ’reference’ value ranges.
To convert to fractional abundances we also require column density, N(H2). N(H2) is most easily obtained from the CO(1-0) brightness and an empirical conversion factor, . We adopt a CO-to-H2 conversion factor of X cm-2 (K km s-1)-1. This is a factor of four lower than typical for the Galactic disk (Strong et al. 1988; Hunter et al. 1997; Bolatto et al. 2013a), but consistent with what has been previously estimated for NGC 253 (e.g. Paglione et al. 2001, B13, L14). Uncertainties in XCO are significant, likely at the level, and in section 4.1 some discussion of its validity in the context of optical thin C17O(1–0) is discussed.
4. Discussion
In the following we present a broad discussion of the chemistry in the nuclear region of NGC 253. The primary goal is to obtain spatially resolved views of the different molecular environments in and around the starburst center.
We begin our discussion by studying the main tracer of the molecular gas, 12CO, its isotopologues, and implied molecular gas opacity in Sec. 4.1. In Sec. 4.2 we continue with a similar discussion of the isotopologues of the main tracers of the dense molecular gas phase (H13CN, H13CO+, HN13C). This is followed by a discussion of tracers of PDRs, (Sec. 4.3), shock tracers (HNCO and SiO; Sec. 4.4), Sulfur species (Sec. 4.5), hydrogen recombination lines (Sec. 4.6), and other tentatively identified species (Sec. 4.7) detected in our study. A schematic picture summarizes the overall chemistry of the central region of NGC 253 in the conclusions/summary section (Sec. 5).
4.1. CO Isotopologues and Gas Opacity
Our data cover a number of isotopologues (i.e. molecules where one atom is replaced with an isotope). Given the fact that atomic isotopes are much less abundant than the main atom, many of these isotopologue lines have low optical depth compared to the main species. Isotopologue ratios thus provide insights into the optical depth of the main lines and can also be used to constrain isotopic abundance ratios. The isotopic abundance ratio ultimately can provide insights into stellar nucleosynthesis and possible variations of the stellar initial mass function (IMF). In the discussion that follows we do not interpret the sometimes anomalous line ratios found for region 6 (i.e. the region that is coincident with the central continuum emission) as it is likely that in some cases our measurements are affected by absorption (Sec. 2).
A comparison of the brightness of the C17O(1–0) transition to the 12CO(1–0) transition [hereafter CO(1–0)] can provide important constraints on the total H2 column. Being an optically thin version of CO, even in this extreme star formation environment, it permits CO abundances to be determined by ‘counting molecules’ if the [CO/C17O] abundance ratio is known.
The [CO/C17O] abundance ratio is constrained based on existing measurements and nucleosynthetic expectations. In the Galaxy, [CO/C17O] is 1900 at the solar radius and drops to 900 in the Galactic center (e.g., Wilson & Rood 1994, Ladd 2004, Wouterloot et al. 2008). This decrease in the [CO/C17O] abundance is consistent with 17O being a secondary chemical evolution product formed from reactions between primary 16O and a proton in intermediate mass stars. Therefore, in a strongly processed location like the center of a starburst, a low value of the CO/C17O abundance ratio is expected, so we adopt [CO/C17O] = 1000, which is approximately the Galactic center value referenced above, as our nominal value.
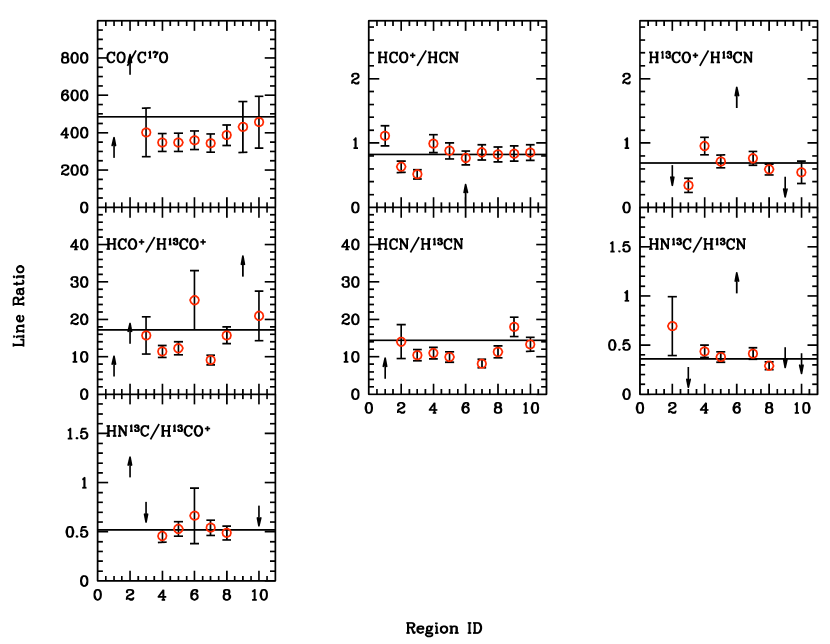
As shown in Fig. 5, this isotopologue line ratio is fairly constant with position in NGC 253 and large (350). For a ratio 16O/17O of 1000 in NGC 253, the measured ratio nominally implies a 12CO opacity of 2.5, a moderate value for the main CO line. Raising the intrinsic 16O/17O abundance to 2000 gives a 12CO opacity of order 5.5.
Various non-LTE effects can occur in a starburst environment that could alter the observed CO/C17O line ratio. Examples that artificially inflate the CO/C17O line ratio include: 1) CO has a higher excitation temperature than C17O because CO has high opacity and its emission is dominated by warmer, externally heated edges of the GMCs while C17O is dominated by the cooler interiors. 2) Isotope–selective photo-dissociation makes the cloud sizes smaller in C17O than CO. Or, 3) due to the absence of radiative trapping in C17O, C17O is subthermal relative to CO and therefore fainter (e.g., Meier & Turner 2001). The first two would be expected to be pronounced close to the nuclear star formation. However, interestingly, no evidence is seen for an increase in the CO/C17O ratio towards the inner disk, where PDRs are enhanced (Sec. 4.3) and warm gas dominates. But if there is a decrease in density away from the inner disk then the third option can operate in the outer disk, partially compensating for the first two. For CO/13CO abundances [CO/13CO] 60 (Martin et al. 2010), CO opacities estimated from the CO/C13O line ratios are 5 (e.g., Paglione et al. 2004, Sakamoto et al. 2011). This scenario is consistent with CO/C17O data (and CO/C18O) if non-LTE effects are at most a factor of 2. We conclude that, despite the large column density towards NGC 253’s nucleus, CO(1–0) is only modestly opaque. It is likely that this low optical depth is due to increased line widths due to turbulence, the molecular outflow, non-circular motions and/or elevated gas temperatures that reduce the CO opacity per unit velocity.

The moderate CO optical depth is also reflected in the implied sub-Galactic CO-to-H2 conversion factor in starbursts like NGC 253 (Harrison et al. 1999, Downes & Solomon 1998, Meier & Turner 2001; Bolatto, Leroy & Wolfire 2013). A comparison of the LTE C17O column to the H2 column estimated by an of cm-2 (K km s-1)-1, gives a value for [C17O/H2] constant (to within 20 %) of across positions 3-10 (using Eq. 1 and Tex=75 K, Sec. 3.4). If [CO/C17O] = 1000 and [CO/H2] = , then we would expect a value of [C17O/H2] . The level of agreement between the two methods of constraining N(H2) is reasonable, being less than the uncertainties in each method. The small differences are an indicator of the uncertainty in . Agreement could be made exact by raising [C17O/H2] and/or by lowering the adopted Tex.
4.2. Dense Gas Tracers and their Isotopologues
The commonly observed dense gas line ratios, HCO+/HCN, HNC/HCN and HCO+/HNC ratios are predicted to be sensitive to gas density, cosmic ray ionization and possibly the X-ray versus UV ionization rate or the present of mechanical heating (e.g., Kohno et al. 2001, Meijerink & Spaans 2005, Gracia-Carpio et al. 2006, Knudsen et al. 2007, Papadopolous 2007, Krips et al. 2008, Baan et al. 2008, Loenen et al. 2008, Meijerink et al. 2011, Kazandjian et al. 2012). HCO+(1–0) effective critical densities are nearly a factor of five lower than HCN, so to first order, elevated HCO+/HCN and HCO+/HNC ratios are expected in moderate density gas ( cm-3). As densities increase, both transitions thermalize and the ratio tends to unity. Moreover, HNC/HCN ratios are expected to drop in energetic environments because HNC is preferential destroyed in hot gas (e.g., Schilke et al. 1992, Meier & Turner 2005). If these transitions have high optical depths, which is probable given the large columns of dense gas, all ratios are driven toward unity. As a result of the large inferred optical depths, changes in these main isotopic line ratios due to interesting physical/chemical changes will be partially hidden.
Here we focus on the dense gas properties in the central starburst region of NGC 253. The HCO+/HCN intensity ratio (Fig. 5) is observed to be slightly less than unity and exhibits very little change over the inner disk (except for position 2 and 3). This suggests that both HCN(1–0) and HCO+(1–0) are optically thick and slightly subthermal across much of the nucleus (Knudsen et al. 2007). Here we add new HCN/H13CN, HCO+/H13CO+, H13CO+/H13CN, and HN13C/H13CN intensity ratios to further constrain dense gas properties. The isotopologues of HCN, HCO+, and HNC have lower optical depths and allow estimates of the line opacity and changes in the abundance ratio of these species.
The observed HCN/H13CN and HCO+/H13CO+ both have values of 10 - 15 over much of the inner nuclear disk (Fig. 5). The fact that these ratios are much lower than the expected [12C/13C] ratio of 60 (Martín et al. 2010) clearly demonstrates that both HCN(1–0) and HCO+(1–0) have opacities greater than one. This confirms the conclusions of earlier work (Knudsen et al. 2007). For C/13C abundance ratios of 80 above and LTE assumptions, both HCN and HCO+ have . Interestingly this is an optical depth similar or slightly larger than inferred for CO(1–0) from C17O. This is expected because the HCN/H13CN and HCO+/H13CO+ ratios are quite similar to the observed CO/13CO line ratios (e.g., Paglione et al. 2004; Sakamoto et al. 2011). Such optical depths for HCN and HCO+ are large. For a Tex=75 K, inferred optically thin HCN abundances are (Table 4). However, if the isotopologues of HCN, HCO+ and HNC have a lower excitation temperature than the main species (likely true, see below), then LTE inferred opacities are lower limits.
The H13CO+/H13CN ratio in particular shows larger variation (Fig. 5) than seen in the main isotopic ratios. Moreover the average values of the ratios are different. Toward the two main inner disk GMCs (positions 5 and 7) HCO+/HCN and H13CO+/H13CN have very similar ratios, but toward the outer nuclear disk the isotopic dense gas ratios decrease relative to their main versions. Likewise the average HN13C/H13CN ratio of 0.35 is significantly lower than the single-dish value for the main species ratio (0.74; Baan et al. 2008). The fact that the isotopologue substituted species have ratios farther from unity is consistent with the expectation that high optical depth in the main lines artificially drives the ratio closer to unity. These isotopologue ratios tend to move NGC 253 further into the PDR-like ratio parameter space of Baan et al. (2008), consistent with dense gas abundance ratios influenced by warm, PDR across the inner nuclear disk.
Given the lower opacities of the isotopologues of HCN, HCO+, and HNC, it is expected that subthermal excitation will be the most relevant non-LTE consideration, therefore it is worth modeling the physical conditions implied by these lines. Knudsen et al. (2007) have modeled the main isotopologues, including selected J transitions. Here we carry out an independent large velocity gradient (LVG) radiative transfer modeling focusing on the isotopic line ratios. Line ratios are modeled as they are to first order independent of the unknown areal filling factor, and therefore constrain the parameter space more precisely. The model used is patterned after the models of Meier et al. (2008), with Jmax extended to 20 and collisional coefficients adapted from the Leiden LAMDA database (van der Tak et al. 2007; see Table 4 for references to the individual molecular rate coefficients). To model the radiative transfer, assumptions must be made about the abundance per velocity gradient. Models with a wide range of abundance per velocity gradient ( km-1 s pc) were calculated. In general it is not easy to obtain agreement for the line ratios of HCN/HCO+, HCN/H13CN, HCO+/H13CO+, H13CO+/H13CN, HN13C/H13CO+ and HN13C/H13CN. HCO+’s effective critical density is significantly lower than HCN and so HCO+ abundances have to be low compared to HCN to obtain ratios of HCO+/HCN lower than unity. But pushing HCO+ abundances too low causes disagreement with the isotopic ratios. If we focus only on the five isotopic line ratios, then reasonable solutions that match all are found over a fairly narrow range of parameter space. We adopt km-1 s pc and = km-1 s pc, consistent with , and a velocity gradient of 3 km s-1 pc-1. For the isotopologues, a 12C/13C ratio of 80 is adopted. These values are in reasonable agreement with the values listed in Table 4 and the observed gas kinematics. There is room to adjust the abundances per velocity gradient of the five species individually, but keeping HCO+ and HNC abundances equal does an acceptable job. The low abundance of HCO+ demanded relative to HCN is a direct consequence of its lower effective critical density.
Figure 6 displays the acceptable parameter space for the ratios observed toward the inner nuclear disk (average of the ratios toward positions 5 and 7) displayed in Figure 5. When admitting uncertainties, good agreement to all five ratios is obtained for cm-3 and T K. The cross in Figure 6 marks the location of a representative good fit to all lines. Its values are cm-3 and T K. Tkin below 60 K challenges the observed ratios for H13CO+/H13CN and HN13C/H13CN , and T K begins to disagree with HCO+/H13CO+. Strictly speaking the HCO+/HCN ratio is not matched, however the disagreement is small (30 %), and at the level that we expect other complications such as line width variation and transition depend filling factors to become important. The degree of internal consistency obtained in these simple uniform physical condition models is encouraging.
The favored densities and kinetic temperatures of the dense gas isotopologues match well those previously found in Knudsen et al. (2007), with a range overlapping but favoring about 0.25 dex lower densities. These results confirm Knudsen et al. (2007)’s conclusions that HCN, HNC and (to a somewhat lesser degree) HCO+ are moderately subthermally excited. The dense gas isotopologues are even more strongly subthermal. For the above favored model, we obtain Tex = 34 K and 44 K for HCN and HCO+, respectively. Corresponding opacities are 13 and 2.4 for HCN and HCO+. For the isotopologues, Tex [] are 7.2 K [2.4], 16 K [0.27] and 5.3 K [0.71] for H13CN, H13CO+ and HN13C, respectively. LVG modeling demonstrates that while the main transition line opacities crudely match those predicted from LTE, the isotopologue opacities are significantly larger than . This stems from the fact that the effective critical density of a transition is dependent on its opacity (radiative trapping), so the isotopologues are more strongly subthermal. As a result, the level populations of the isotopologues settle into the lowest J transitions more efficiently, raising their opacity. This explains the well known effect that isotopic line ratios are gas density probes (e.g., Meier et al. 2001). Furthermore this is strong evidence that the main species, particularly of HCN, must have opacities well in excess of unity.
The slightly larger HCN/H13CN and HCO+/H13CO+ ratios together with somewhat lower HN13C/H13CN ratios toward the outer nuclear disk are consistent with warm gas that is 0.5 dex lower in density. However, the decrease in the H13CO+/H13CN ratio toward the outer disk is somewhat unexpected as gas density is decreasing in this region. Raising Tkin significantly will lower the H13CO+/H13CN ratio slightly even at lower density but only by 10 % for Tkin up 300 K. This effect does not appear to be strong enough to explain the observed ratio, and so this ratio is evidence for a small, but genuine abundance enhancement of HCN and its isotopologue relative to HCO+ and HNC across the nuclear disk — or conversely a decrease of both the isotopologues of HCO+ and HNC relative to H13CN. Invoking mechanical heating may be a viable candidate for elevating HCN at the expense of HCO+ and HNC (Loenen et al. 2008, Mejierink et al. 2011, Rosenberg et al. 2014), because hotter gas converts HNC to HCN (e.g., Schilke et al 1992). If mechanical heating is more pronounced at the base of the outflow in the outer disk then this may explain the further drop in H13CO+/H13CN here. However this possibility is speculative so we consider the explanation for the lower H13CO+/H13CN ratio unsettled.
4.3. PDR Tracers
Given the strong radiation field in NGC 253’s center, the presence of PDR tracers are expected and observed. PDRs warm gas and maintain significant amounts of carbon in ionized form (e.g., Tielens & Hollenbach 1985), so tracers include species that form rapidly from C+ and H or H2. These include simple hydrocarbons, such as CH, C2H, c-C3H2 and molecules that form directly from these species, like CN (e.g. Fuente et al. 1993, Sternberg & Dalgarno 1995, Röllig et al. 2007). In molecular gas strongly irradiated by UV photons we expect such species to exhibit elevated abundances. The two main PDR tracers in our dataset are CN and C2H. C2H has a critical density that is significantly lower than CN (see Table 4), and therefore traces somewhat more diffuse PDRs.
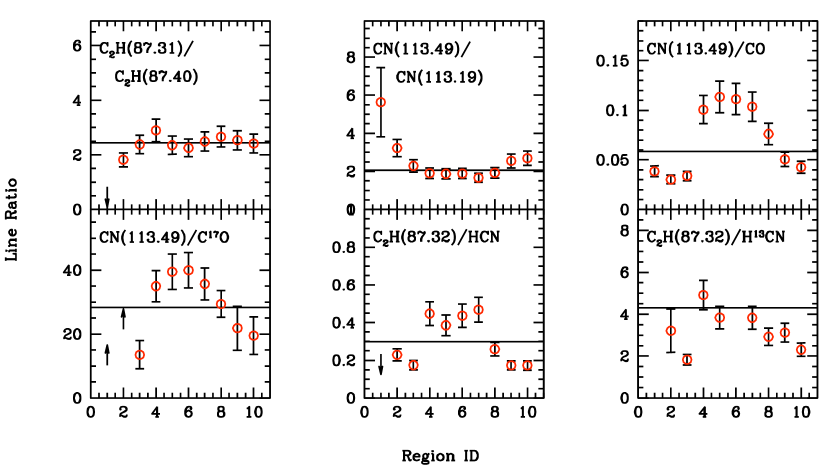
Both CN and C2H exhibit fine/hyperfine structure splitting and so their opacity can be determined directly. For C2H the theoretical LTE C2H(3/2-1/2)/C2H(1/2-1/2) ratio should be 2.3 in the optically thin limit (for the subset of blended lines included), dropping to 1 when optically thick. We observe a global ratio of 2.4 (Fig. 7). Likewise for CN, the CN(3/2-1/2)/CN(1/2-1/2) fine structure ratio is 2 (Fig. 7), which is what we observe for the inner nuclear disk of NGC 253. Both CN and C2H are likely optically thin and therefore their intensities are proportional to their column densities.
The maps of these two species are strongly dominated by the innermost disk locations, 4–7, where star formation is most intense and where the ionized/molecular outflow originates. Fig. 7 displays both the CN(1–0; 3/2–1/2)/CO(1–0) (hereafter CN/CO) and the C2H(1–0;3/2–1/2)/HCN(1–0) (hereafter C2H/HCN) line ratios111These two ratios are chosen instead of the more common ratio, CN/HCN (e.g., Boger & Sternberg 2005), because only they can be obtained from matched array configurations in our dataset.. Both ratios decrease significantly from the inner (CN/CO 0.11; C2H/HCN 0.45) to the outer (CN/CO 0.035; C2H/HCN 0.18) nuclear disk. This behavior is explained by a combination of an increased PDR fraction and differential optical depth. To separate these effects, ratios were calculated between optically thin proxies for CO and HCN, CN/C17O and C2H/H13CN (Fig. 7). In both cases the trend for enhanced PDR tracers in the inner disk is seen, though less pronounced. The average CN/C17O ratio is 20 in the outer disk and a factor of 2 higher towards the inner disk region). Likewise, for C2H/H13CN, the outer disk average is 2 and the inner disk average is 3.5-4.5. The fact that C2H/H13CN and CN/C17O both show the same magnitude of an effect suggests that density changes across the nucleus are not controlling the line ratio. Hence it appears that PDRs constitute a larger fraction of the dense gas towards the inner nuclear disk. Simple hydrocarbons exhibit elevated abundances in this environment. We note that the more complex hydrocarbon symmetric top, CH3C2H, has a rather similar morphology to CN and C2H, suggesting that its abundance can also be elevated in PDRs.
We also note that the PDR tracers are observed in the base of the molecular outflow. This is consistent with the recent detection of C2H in the molecular outflow in the nucleus of Maffei 2 (Meier & Turner 2012).
4.4. Shock Tracers
Given the intense star forming environment in NGC 253’s center and its associated outflow of molecular gas (B13), we expect the presence of shocked gas tracers. Our dataset includes two common extragalactic shock tracers, SiO (e.g., Garcia-Burillo et al. 2000) and HNCO (Meier & Turner 2005). HNCO is thought to come from dust ice mantle sublimation (where due to filling factor reasons ice mantle evaporation in hot cores is invisible on larger scales), while SiO is enhanced by ejection of significant Si from sputtered silicate grain cores in high velocity shocks (e.g., Meier & Turner 2005, Rodriguez-Ferndandez et al. 2010, Tideswell et al. 2010, Martin-Pintado et al. 1992).
SiO emission is distributed across the nucleus in a series of compact sources with some relative enhancement seen toward the eastern outer nuclear disk. Calculated SiO abundances (X(SiO) ) confirm that SiO is elevated across the entire nuclear disk. This SiO value is comparable to that seen locally on GMC scales in ‘shock regions’ in other nearby spiral galaxies (e.g., Usero et al. 2006, Meier & Turner 2012) and slightly larger than found in previous NGC 253 SiO measurements (differences are due to different adopted Tex and N(H2) values; Garcia-Burillo et al. 2000). These abundances are much larger than observed toward quiescent Galactic molecular clouds (; e.g., Zuirys et al. 1989, Martin-Pintado et al. 1992).
Interestingly, HNCO has the most distinctive morphology of all the bright lines, being completely dominated by the outer locations of the disk. Such an enhancement at the outer edges of the nuclear disk is also seen in several other nearby barred nuclei, IC 342, Maffei 2 and NGC 6946 (Meier & Turner 2005; 2012). Estimated HNCO abundances reach across the outer nuclear disk and decrease to towards the inner nuclear disk. HNCO abundance in quiescent Galactic clouds approach this inner disk value (e.g. Marcelino et al. 2009, Tideswell et al. 2010).
Assuming SiO traces shocks, then the SiO/HCN line ratio can be considered to first order an indicator of the fraction of the dense gas that is experiencing strong shocks. HNCO/SiO ratio is often considered a tracer of shock strength, because the shocks need to be stronger to elevate the SiO abundance (e.g., Usero et al. 2006). In Fig. 8 we present these two ratios across the nuclear disk of NGC 253. The SiO/HCN intensity ratio is fairly flat across the disk with slight elevations seen towards regions 2 and 3. This indicates that shocks are uniformly present over much of the nuclear disk in NGC 253. The HNCO/SiO ratio in the outer nuclear disk matches the ratio observed in bar shock regions of nearby spirals like IC 342 (Meier & Turner 2005, Usero et al. 2006) and Maffei 2 (Meier & Turner 2012) well. Towards the inner disk the ratio drops dramatically to a value of 0.17. Only M 82 has a ratio anywhere near this low (Garcia-Burillo et al. 2000, Martin et al. 2009).
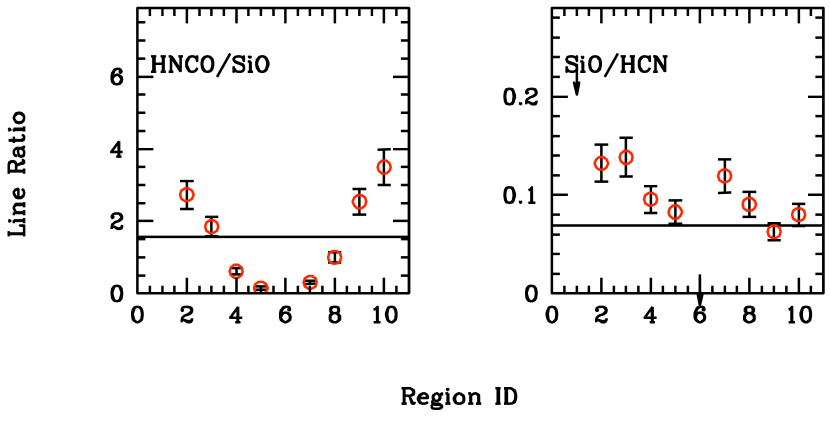
At face value this extremely low HNCO/SiO ratio in the inner disk could be taken to indicate that shock strengths decrease away from the core. However, the SiO morphology and abundance suggests that, even in the outer disk, shock strengths are strong enough to keep SiO high relative to HCN. Therefore other effects that further alter the HNCO morphology besides simple shock strength must be considered. Two important second order effects that can alter the HNCO/SiO ratio (see Meier & Turner 2012 for a thorough discussion): 1) HNCO has a significantly higher photodissociation rate than SiO, so its shock signatures are erased more easily in the presence of PDRs/UV radiation fields. 2) SiO is a linear top molecule so its partition function is Tex, while HNCO is an asymmetric top molecule, with a partition function T. So in hot gas, HNCO’s lower energy states depopulate more rapidly than SiO. For HNCO this effect is mitigated at T K by the fact that Eu(HNCO) is 11 K compared to SiO’s value of 6.3 K, but if T K in the inner disk then this could be a pronounced effect.
In the inner nuclear disk, the gas is hot and PDR dominated (see Sec. 4.3), so we expect that both act to drive down the HNCO/SiO ratio in the center. Therefore it appears we are observing the starburst (and outflow) actively in the process of erasing the signatures grain mantles species in the inner disk (Martín et al. 2009a,b). In this context it is not surprising that its HNCO/SiO ratio is similar to M 82’s, a nucleus where PDRs have completed the task of erasing the weak shock tracers (Takano et al. 1995, Garcia-Burillo et al. 2001)
4.5. Sulfur Species
We detect a significant number of sulfureted species, including CS, SO, NS, H2CS, CH3SH and C2S. When accounting for the different array configurations used to observe them, CS, SO, H2CS and NS all have quite similar morphologies. They tend to be dominated by the dense GMCs, with a preference toward the clouds on the northeast side of the continuum peak (7 and 8), whereas the PDR/hydrocarbons tend to favor the southwestern side of the inner disk (position 5). Interestingly, the morphology of the sulfuretted species, particularly CS and SO are very similar to SiO. Assuming SiO traces shocked gas (Sec. 4.4), this hints at a possible connection between the S species and shocked gas. This is somewhat unexpected, at least for CS, given that in other nearby nuclei it has been argued that CS is primarily a PDR tracer (e.g., Meier & Turner 2005; Martín et al. 2009). Evidently a mix of shocks and strong radiation fields are capable of maintaining high abundances of SiO and CS, though not HNCO.
The CS/SO abundance ratio is sensitive to the C+/O abundance ratio and it has been argued to be either a tracer of the C/O abundance ratio ( 0.4 in the Galaxy), or early vs. late time chemistry (e.g., Heithausen et al. 1998, Nilsson et al. 2000). So when C or C+ is nearly as abundant as atomic O, CS is strongly favored over SO. Our observed SO/CS intensity ratio is 0.1–0.18 over much of the nuclear disk (Fig. 9). This corresponds to a CS/SO abundance ratio of 1.5–3 (higher if CS is optically thick), in good agreement with Galactic star forming regions. Nilsson et al. (2000) find values ranging between 0.4–5, with most at 2.
Likewise, the NS/SO (and NS/CS) abundance ratios are particularly sensitive to atomic C and O abundances. NS is formed from the neutral-neutral reactions, S + NH NS + H and N + SH NS + H. Atomic O destroys both NS and its parent SH, converting them to NO and SO, respectively. Likewise, reactions with C/C+ drive NS into CS and CN. In star forming regions the radiation field can keep a significant amount of C and O in non-molecular form. As such, standard gas-phase models predict NS cannot not attain abundances above X(NS) (e.g., McGonagle & Irvine 1997, McElroy et al. 2013). In the inner nuclear disk we observe NS abundances in the range of 1 – 6, at least two orders of magnitude larger than the maximum gas-phase models can accommodate. NS/SO abundances ratios are also high, reaching 0.2 - 0.5 (the exact values are uncertain due to non-matched array configurations). These elevated abundances are consistent with that determined from single-dish measurements toward NGC 253 (Martín et al. 2003, 2005), except the present observations further demonstrate that the high abundances are attained toward the same inner disk GMCs where PDR conditions are pronounced.
To explain the similar (high) abundances of CS, SO and NS toward the same region requires non-standard chemistry. The atomic abundances of species like O must be kept very low, despite the PDR conditions. Two possible scenarios appear feasible. The first, introduced by Viti et al. (2001) (see also Charnley 1997, Harada et al. 2010 and Izumi et al. 2013), invokes a high temperature gas phase chemistry due to the passage of a shock. This high temperature gas drives O into the more inert H2O form so it does not destroy NS as rapidly. A second possibility is that in the pre-starburst phase of NGC 253’s nucleus, much of the atomic species condensed onto the dust grains where they are converted into their saturated form (e.g., Brown et al. 1988). At a later time shocks liberated the saturated species (e.g., CH4, NH3, H2O and possibly H2S). The gas-phase chemistry then evolved from molecular initial conditions, keeping atomic C and O low. Both of the scenarios invoke the presence of shocks, and so are consistent with the tight morphological connection between the sulfur species and SiO.
We observe both ortho-H2CS at 101 GHz and a mix of para transitions at 103 GHz. The ortho-to-para ratio of H2CS, the sulfur analog to formaldehyde H2CO, is useful for constraining the formation conditions of H2CS (Minh et al. 1991). Under optically thin, high-T (15 K in the case of H2CS), LTE case, the ratio of the ortho species of H2CS (those with Ka [K-1] even, see Tab. 1) to the para (those with Ka odd) should be 3.0. If the temperature at the time of formation is 15 K then the two forms of H2CS with not be thermalized to their statistical weights and hence have an abundance ratio less than 3 — approaching unity at T=0 K. The intensity ratio of the two types of transitions (Fig. 9) is approximately constant across the disc at a value of 1.4. For Tex = 75 K the measured ratio implies an ortho-to-para ratio of 2.9. Therefore every position is consistent with standard LTE, high temperature limit. Thus, at least in the case of H2CS, this suggests that H2CS formed in the high temperature gas phase after evaporation, or if it was formed on the grain surfaces in an earlier epoch, those surfaces were still significantly warmer than 15 K.
4.6. Millimeter Recombination Lines
We have detected three hydrogen recombination lines in our observations (H40, H50 and H52). The morphology of these recombination lines is very different from all the molecular gas tracers (e.g., Figs. 1 and 3): The emission is centrally concentrated, coincident with the location of the underlying continuum emission (L14). H radio recombination lines are reported outside the Local Group for the first time here. The error bars are significant for the lines, but the global H40/H50 ratio is around 3.5, in good agreement with the LTE value of 3.5 (=1/0.285) for cm-3 and Te = 104 K. The lines would be fainter than the line by a factor of 2.3. Indeed, we do not clearly detect any lines. We also do not detect any He lines. Other radio/mm recombination lines mapped in NGC 253 have been discussed extensively elsewhere (e.g., Anantharamaiah & Goss 1996, Mohan et al. 2002, 2005, Rodriguez-Rico et al. 2006, Kepley et al. 2011). The morphology of both the and lines mapped here are in excellent agreement with the ones reported previously.
4.7. Tentatively Identified Species
We here briefly comment on other selected species detected in our observations.
A large number of tentatively identified lines can be attributed to carbon-rich complex species (e.g., CH3CH2CN, CH3CH2OH, CH2CN, CH2CO, CH3CHO and NH2CHO (Tab. 1). These species represent the next step in complexity beyond the molecules detected in external galaxies up until now, and suggest that these molecules may be fairly extended in NGC 253.
One unidentified feature detected is of particular interest. This is the feature U-114.22 at 114.218 GHz. This spectral feature is within 4 MHz (11 km s-1) of both C4H(N=12–11; J=23/2–21/2; F=12–11) and the transition of CO(1–0). The upper energy state of the CO(1–0; ) line is 3089 K above ground, so the excitation temperature of the gas must be 450 K in order to explain the observed line ratio. The morphology of this transition is very similar to the RRLs (accounting for resolution differences), as would be expected if it is tracing molecular gas not associated with the cold molecular phase. The C4H transition has a much lower upper energy level of 35.6 K, typical of the other transitions seen here. Moreover, it is plausible to expect that the C4H might trace PDR emission (like C2H), which are also concentrated towards the inner disk, though why it would be significantly more compact than C2H is unexplained. We consider C4H as the most likely identification, however the observed morphology indicates that the possibility this feature could be vibrationally excited CO deserves further investigation.
5. Summary and Conclusions
We present the detection of a total of 50 molecular lines in the nearby starburst galaxy NGC 253, based on early science (cycle 0) observations taken with the Atacama Large (Sub–)Millimeter Array (ALMA). For 27 lines we have an unambiguous identification, and 13 lines have tentative IDs (no plausible line identification was possible in 10 cases).
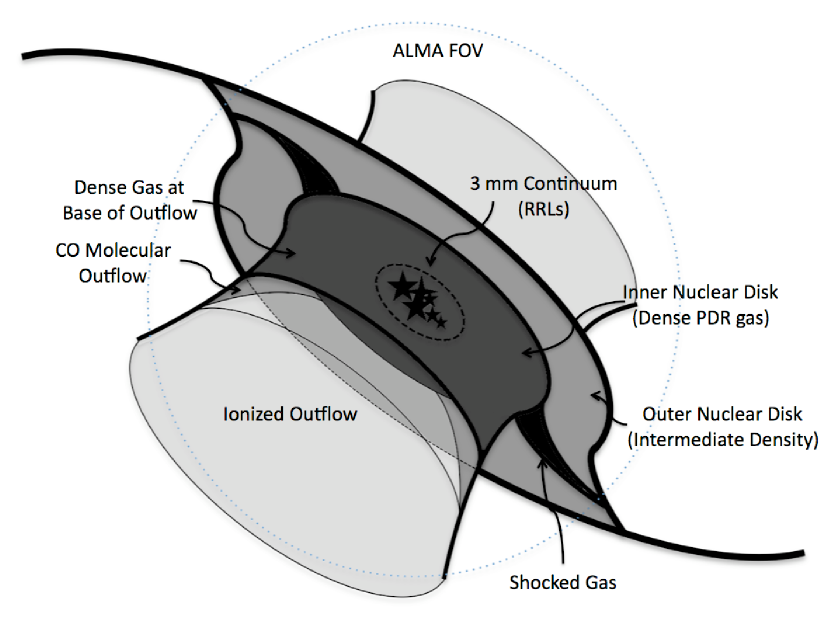
We here describe a schematic picture of the central starburst region of NGC 253 mapped by ALMA (Fig. 10): As described in Sec. 3.1, the nucleus of NGC 253 is characterized by the inner portion of NGC 253’s large–scale bar. The outer part of the nuclear disk (the ‘outer nuclear disk’), likely represents the location where the gas is flowing radially inward along the large-scale bar. Inside this is a compact region exhibiting a large quantity of high density gas and intense star formation, as evidenced by the presence of dense gas (Sec. 4.2), PDR (Sec. 4.3) and shock tracers (Sec. 4.4). This component (the ‘inner nuclear disk’), dominates the morphology of most of the spectral lines detected by the observations. We detect high density molecular gas tracers (HCN, HCO+ and CN) at the base of the molecular outflow first detected in the 12CO emission (B13).
In detail, we find moderate 12CO opacities of 2–5, despite the large column density towards NGC 253’s nucleus. This may be due to increased line–widths due to turbulence, non–circular motions and/or elevated gas temperatures that reduce the CO opacity per unit velocity. Comparing HCN(1–0) and HCO+(1–0) with their 13C–substituted isotopologues yields that the HCN(1–0) and HCO+(1–0) are also optically thick, with similar (moderate) opacities to CO. These high HCN and HCO+ opacities imply that the main isotopologue HCN/HCO+ (and HCN/HNC) line ratios have less diagnostic power in this starburst environment. Using the isotopically substituted versions of these high density tracers we measure much more robust values for the popular ”HCO+/HCN”, ”HNC/HCN” and ”HNC/HCO+” ratios. All five of the isotopic dense gas tracer ratios can be well fit by LVG models with cm-3, T K and .
The weak shock tracer/ice mantle species HNCO has the most distinctive morphology of all the bright lines being completely dominated by the outer locations of the disk. This is at odds with what is seen in the strong shock tracer, SiO. Attributing the dramatic variation in the HNCO and SiO maps across the nucleus to changing shock strength is unsatisfactory because SiO is enhanced across the nucleus at a level that should imply shocks are strong throughout the inner disk. A possible explanation for the faintness of HNCO is that because of its higher photodissociation rate relative to SiO, the ice mantle evaporation shock signatures are being preferentially erased in the presence of the intense central radiation fields. This is consistent with the presence of an enhanced PDR fraction towards the region of HNCO’s dramatic decrease as determined form the CN/C17O and C2H/H13CN ratios. The sulfureted species appear also to be (indirectly) connected to the presence of shocks across the inner disk.
We have detected three hydrogen recombination lines (H40, H50 and H52) that show a centrally concentrated morphology (similar to the underlying continuum emission) that is distinctly different from all molecular gas tracers.
Finally, we report some tentative identifications, including the aldehydes CH3CHO and NH2CHO, cyanides CH2CN and CH3CH2CN and a number of organics of similar complexity, CH2CO, HCOOH and CH3CH2OH. The first vibrational state of the 12CO(1–0) line is also possibly detected. If follow–up, multi-line studies confirm these IDs then they would represent the first extragalactic detections of the above species.
References
- Aladro et al. (2011) Aladro, R., Martín-Pintado, J., Martín, S., Mauersberger, R., & Bayet, E. 2011, A&A, 525, A89
- Aladro et al. (2013) Aladro, R., Viti, S., Bayet, E., et al. 2013, A&A, 549, AA39
- Anantharamaiah & Goss (1996) Anantharamaiah, K. R., & Goss, W. M. 1996, ApJ, 466, L13
- Baan et al. (2008) Baan, W. A., Henkel, C., Loenen, A. F., Baudry, A., & Wiklind, T. 2008, A&A, 477, 747
- Blake et al. (1987) Blake, G. A., Sutton, E. C., Masson, C. R., & Phillips, T. G. 1987, ApJ, 315, 621
- Bolatto et al. (2013a) Bolatto, A. D., Wolfire, M., & Leroy, A. K. 2013, ARA&A, 51, 207
- Bolatto et al. (2013b) Bolatto, A. D., Warren, S. R., Leroy, A. K., et al. 2013, Nature, 499, 450 (B13)
- Boger & Sternberg (2005) Boger, G. I., & Sternberg, A. 2005, ApJ, 632, 302
- Brown et al. (1988) Brown, P. D., Charnley, S. B., & Millar, T. J. 1988, MNRAS, 231, 409
- Carilli & Walter (2013) Carilli, C. L., & Walter, F. 2013, ARA&A, 51, 105
- Charnley (1997) Charnley, S. B. 1997, ApJ, 481, 396
- Costagliola et al. (2011) Costagliola, F., Aalto, S., Rodriguez, M. I., et al. 2011, A&A, 528, A30
- Cummins et al. (1986) Cummins, S. E., Linke, R. A., & Thaddeus, P. 1986, ApJS, 60, 819
- Dayou & Balança (2006) Dayou, F., & Balança, C. 2006, A&A, 459, 297
- Downes & Solomon (1998) Downes, D., & Solomon, P. M. 1998, ApJ, 507, 615
- Dumouchel et al. (2010) Dumouchel, F., Faure, A., & Lique, F. 2010, MNRAS, 406, 2488
- Flower (1999) Flower, D. R. 1999, MNRAS, 305, 651
- García-Burillo et al. (2000) García-Burillo, S., Martín-Pintado, J., Fuente, A., & Neri, R. 2000, A&A, 355, 499
- Graciá-Carpio et al. (2006) Graciá-Carpio, J., García-Burillo, S., Planesas, P., & Colina, L. 2006, ApJ, 640, L135
- Green (1986) Green, S. 1986, NASA Tech. Memo., NASA TM 87791
- Green & Chapman (1978) Green, S. & Chapman, S. 1978, ApJS, 37, 169
- Harada et al. (2010) Harada, N., Herbst, E., & Wakelam, V. 2010, ApJ, 721, 1570
- Harrison et al. (1999) Harrison, A., Henkel, C., & Russell, A. 1999, MNRAS, 303, 157
- Heithausen et al. (1995) Heithausen, A., Corneliussen, U., & Grossmann, V. 1995, A&A, 301, 941
- Heithausen et al. (1998) Heithausen, A., Corneliussen, U., & Grossmann, V. 1998, A&A, 330, 311
- Henkel et al. (2014) Henkel, C., Asiri, H., Ao, Y., et al. 2014, A&A, 565, AA3
- Houghton et al. (1997) Houghton, S., Whiteoak, J. B., Koribalski, B., et al. 1997, A&A, 325, 923
- Hunter et al. (1997) Hunter, S. D., Bertsch, D. L., Catelli, J. R., et al. 1997, ApJ, 481, 205
- Izumi et al. (2013) Izumi, T., Kohno, K., Martín, S., et al. 2013, PASJ, 65, 100
- Kazandjian et al. (2012) Kazandjian, M. V., Meijerink, R., Pelupessy, I., Israel, F. P., & Spaans, M. 2012, A&A, 542, AA65
- Kennicutt & Evans (2012) Kennicutt, R. C., & Evans, N. J. 2012, ARA&A, 50, 531
- Kepley et al. (2011) Kepley, A. A., Chomiuk, L., Johnson, K. E., et al. 2011, ApJ, 739, L24 bibitem[Kohno et al.(2001)]2001ASPC..249..672K Kohno, K., Matsushita, S., Vila-Vilaró, B., et al. 2001, The Central Kiloparsec of Starbursts and AGN: The La Palma Connection, 249, 672
- Knudsen et al. (2007) Knudsen, K. K., Walter, F., Weiss, A., et al. 2007, ApJ, 666, 156
- Krips et al. (2008) Krips, M., Neri, R., García-Burillo, S., et al. 2008, ApJ, 677, 262
- Ladd (2004) Ladd, E. F. 2004, ApJ, 610, 320
- Leroy et al. (2013) Leroy, A. K., Walter, F., Sandstrom, K., et al. 2013, AJ, 146, 19
- Leroy et al. (2104) Leroy, A. K., Bolatto, A., et al. (2014), ApJ, in press, astro-ph/1411.2836] (L14)
- Lique et al. (2006) Lique, F., Spielfiedel, A., & Cernicharo, J. 2006, A&A, 451, 1125
- Lique et al. (2006) Lique, F., Spielfiedel, A., Dhont, G., & Feautrier, N. 2006, A&A, 458, 331
- Lique et al. (2010) Lique, F., Spielfiedel, A., Feautrier, N., et al. 2010, J. Chem. Phys., 132, 024303
- Loenen et al. (2008) Loenen, A. F., Spaans, M., Baan, W. A., & Meijerink, R. 2008, A&A, 488, L5
- Marcelino et al. (2009) Marcelino, N., Cernicharo, J., Tercero, B., & Roueff, E. 2009, ApJ, 690, L27
- Martín et al. (2014) Martín, S., Kohno, K., Izumi, T., et al. 2014, arXiv:1410.2823
- Martín et al. (2003) Martín, S., Mauersberger, R., Martín-Pintado, J., García-Burillo, S., & Henkel, C. 2003, A&A, 411, L465
- Martín et al. (2005) Martín, S., Martín-Pintado, J., Mauersberger, R., Henkel, C., & García-Burillo, S. 2005, ApJ, 620, 210
- Martín et al. (2006) Martín, S., Mauersberger, R., Martín-Pintado, J., Henkel, C., & García-Burillo, S. 2006, ApJS, 164, 450
- Martín et al. (2009) Martín, S., Martín-Pintado, J., & Mauersberger, R. 2009, ApJ, 694, 610
- Martín et al. (2009) Martín, S., Martín-Pintado, J., & Viti, S. 2009, ApJ, 706, 1323
- Martín et al. (2010) Martín, S., Aladro, R., Martín-Pintado, J., & Mauersberger, R. 2010, A&A, 522, A62
- Martin-Pintado et al. (1992) Martin-Pintado, J., Bachiller, R., & Fuente, A. 1992, A&A, 254, 315
- McElroy et al. (2013) McElroy, D., Walsh, C., Markwick, A. J., et al. 2013, A&A, 550, A36
- McGonagle & Irvine (1997) McGonagle, D., & Irvine, W. M. 1997, ApJ, 477, 711
- Meier & Turner (2012) Meier, D. S., & Turner, J. L. 2012, ApJ, 755, 104
- Meier & Turner (2005) Meier, D. S., & Turner, J. L. 2005, ApJ, 618, 259
- Meier & Turner (2004) Meier, D. S., & Turner, J. L. 2004, AJ, 127, 2069
- Meier & Turner (2001) Meier, D. S., & Turner, J. L. 2001, ApJ, 551, 687
- Meier et al. (2014) Meier, D. S., Turner, J. L., & Beck, S. C. 2014, ApJ, 795, 107
- Meier et al. (2008) Meier, D. S., Turner, J. L., & Hurt, R. L. 2008, ApJ, 675, 281
- Meijerink & Spaans (2005) Meijerink, R., & Spaans, M. 2005, A&A, 436, 397
- Meijerink et al. (2011) Meijerink, R., Spaans, M., Loenen, A. F., & van der Werf, P. P. 2011, A&A, 525, AA119
- Minh et al. (1991) Minh, Y. C., Irvine, W. M., & Brewer, M. K. 1991, A&A, 244, 181
- Mohan et al. (2002) Mohan, N. R., Anantharamaiah, K. R., & Goss, W. M. 2002, ApJ, 574, 701
- Mohan et al. (2005) Mohan, N. R., Goss, W. M., & Anantharamaiah, K. R. 2005, A&A, 432, 1
- Nakajima et al. (2011) Nakajima, T., Takano, S., Kohno, K., & Inoue, H. 2011, ApJ, 728, LL38
- Nguyen-Q-Rieu et al. (1991) Nguyen-Q-Rieu, Henkel, C., Jackson, J. M., & Mauersberger, R. 1991, A&A, 241, L33
- Nilsson et al. (2000) Nilsson, A., Hjalmarson, Å., Bergman, P., & Millar, T. J. 2000, A&A, 358, 257
- Ott et al. (2005) Ott, J., Weiss, A., Henkel, C., & Walter, F. 2005, ApJ, 629, 767
- Paglione et al. (1995) Paglione, T. A. D., Tosaki, T., & Jackson, J. M. 1995, ApJ, 454, L117
- Paglione et al. (2004) Paglione, T. A. D., Yam, O., Tosaki, T., & Jackson, J. M. 2004, ApJ, 611, 835
- Papadopoulos (2007) Papadopoulos, P. P. 2007, ApJ, 656, 792
- Rekola et al. (2005) Rekola, R., Richer, M. G., McCall, M. L., et al. 2005, MNRAS, 361, 330
- Rodríguez-Fernández et al. (2010) Rodríguez-Fernández, N. J., Tafalla, M., Gueth, F., & Bachiller, R. 2010, A&A, 516, AA98
- Rodríguez-Rico et al. (2006) Rodríguez-Rico, C. A., Goss, W. M., Zhao, J.-H., Gómez, Y., & Anantharamaiah, K. R. 2006, ApJ, 644, 914
- Röllig et al. (2007) Röllig, M., Abel, N. P., Bell, T., et al. 2007, A&A, 467, 187
- Rosenberg et al. (2014) Rosenberg, M. J. F., Kazandjian, M. V., van der Werf, P. P., et al. 2014, A&A, 564, AA126
- Rydbeck et al. (1980) Rydbeck, O. E. H., Hjalmarson, A., Rydbeck, G., et al. 1980, ApJ, 235, L171
- Sakamoto et al. (2011) Sakamoto, K., Mao, R.-Q., Matsushita, S., et al. 2011, ApJ, 735, 19
- Schilke et al. (1992) Schilke, P., Walmsley, C. M., Pineau Des Forets, G., et al. 1992, A&A, 256, 595
- Snell et al. (2011) Snell, R. L., Narayanan, G., Yun, M. S., et al. 2011, AJ, 141, 38
- Spielfiedel et al. (2012) Spielfiedel, A., Feautrier, N., Najar, F., et al. 2012, MNRAS, 421, 1891
- Strong et al. (1988) Strong, A. W., Bloemen, J. B. G. M., Dame, T. M., et al. 1988, A&A, 207, 1
- Tideswell et al. (2010) Tideswell, D. M., Fuller, G. A., Millar, T. J., & Markwick, A. J. 2010, A&A, 510, AA85
- Tielens & Hollenbach (1985) Tielens, A. G. G. M., & Hollenbach, D. 1985, ApJ, 291, 722
- Turner (1991) Turner, B. E. 1991, ApJS, 76, 617
- Usero et al. (2004) Usero, A., García-Burillo, S., Fuente, A., Martín-Pintado, J., & Rodríguez-Fernández, N. J. 2004, A&A, 419, 897
- Usero et al. (2006) Usero, A., García-Burillo, S., Martín-Pintado, J., Fuente, A., & Neri, R. 2006, A&A, 448, 457
- van der Tak et al. (2007) van der Tak, F. F. S., Black, J. H., Schöier, F. L., Jansen, D. J., & van Dishoeck, E. F. 2007, A&A, 468, 627
- Viti et al. (2001) Viti, S., Caselli, P., Hartquist, T. W., & Williams, D. A. 2001, A&A, 370, 1017
- Wiesenfeld & Faure (2013) Wiesenfeld, L., & Faure, A. 2013, MNRAS, 432, 2573
- Wilson & Rood (1994) Wilson, T. L., & Rood, R. 1994, ARA&A, 32, 191
- Wouterloot et al. (2008) Wouterloot, J. G. A., Henkel, C., Brand, J., & Davis, G. R. 2008, A&A, 487, 237
- Yang et al. (2010) Yang, B., Stancil, P. C., Balakrishnan, N., & Forrey, R. C. 2010, ApJ, 718, 1062
- Ziurys et al. (1989) Ziurys, L. M., Friberg, P., & Irvine, W. M. 1989, ApJ, 343, 201
| Transition | Beam | I(1) | I(2) | I(3) | I(4) | I(5) | I(6) | I(7) | I(8) | I(9) | (I10) |
|---|---|---|---|---|---|---|---|---|---|---|---|
| () | (K km s-1) | ||||||||||
| SO(=22-11) | 2.0/2.4 | 5.7 | 5.7 | 7.2 | 6.0 1.8 | 12.0 3.6 | 7.2 | 19.5 1.9 | 5.7 | 5.7 | 5.7 |
| H13CN(1–0) | 2.0/2.4 | 5.7 | 8.5 2.6 | 25.3 2.5 | 39.6 4.0 | 58.4 5.8 | 7.1 | 64.3 6.4 | 45.3 4.5 | 11.7 1.2 | 13.4 1.3 |
| HCO(=11,0–00,0) | 1.9/2.4 | 5.6 | 5.6 | 7.1 | 8.2 2.5 | 7.1 | 7.1 | 7.1 | 5.6 | 5.6 | 5.6 |
| H13CO+(1–0) | 1.9/2.4 | 5.6 | 5.6 | 8.7 2.6 | 37.8 3.8 | 41.7 4.2 | 11.0 3.3 | 49.1 4.9 | 26.8 2.7 | 5.6 | 7.3 2.2 |
| SiO(2–1; =0) | 1.9/2.4 | 5.6 | 15.8 1.6 | 36.6 3.7 | 41.6 4.2 | 48.1 4.8 | 7.0 | 62.7 6.3 | 46.4 4.6 | 13.2 1.3 | 14.3 1.4 |
| HN13C(1–0) | 1.9/2.4 | 5.6 | 5.9 1.8 | 7.0 | 17.3 1.7 | 22.1 2.2 | 7.3 2.2 | 26.6 2.7 | 13.1 1.3 | 5.6 | 5.6 |
| C2H(=1-0;=3/2-1/2) | 1.9/2.4 | 5.6 | 27.3 2.7 | 46.2 4.6 | 194.8 19.5 | 224 22 | 157 16 | 246 25 | 133 13 | 36.5 3.6 | 30.9 3.1 |
| C2H(1-0;1/2-1/2) | 1.9/2.4 | 6.72.0 | 15.0 1.5 | 19.4 1.9 | 67.2 6.7 | 95.3 9.5 | 69.7 7.0 | 98.9 9.9 | 49.7 5.0 | 14.4 1.4 | 12.8 1.3 |
| HNCO() | 1.8/2.4 | 5.5 | 43.1 4.3 | 67.8 6.8 | 25.5 2.6 | 7.1 2.1 | 5.5 | 19.5 1.9 | 46.4 4.6 | 33.5 3.3 | 50.0 5.0 |
| H(52) | 1.8/2.4 | 5.4 | 4.1 | 5.4 | 4.1 | 9.0 2.7 | 14.9 1.5 | 5.4 | 5.4 | 4.1 | 4.1 |
| HCN(1–0) | 1.8/2.4 | 24.02.4 | 119 12 | 265 27 | 435 44 | 582 58 | 360 36 | 526 53 | 512 51 | 211 21 | 179 18 |
| HCO+(1–0) | 1.8/2.4 | 26.72.7 | 75.5 7.5 | 137 14 | 432 43 | 512 51 | 276 27.6 | 450 45 | 422 42. | 176 18 | 153 15 |
| CS(2–1) | 1.6/2.4 | 4.4 | 57.2 5.7 | 99.7 10.0 | 208 21 | 233 23 | 136 14 | 287 29 | 225 23 | 63.4 6.3 | 53.0 5.3 |
| H(40) | 1.6/2.4 | 3.2 | 3.2 | 4.3 | 3.2 | 25.1 2.5 | 47.6 4.8 | 13.0 1.3 | 3.2 | 3.2 | 3.2 |
| H(50) | 1.6/2.4 | 4.3 | 3.2 | 4.3 | 3.2 | 7.8 2.3 | 12.1 1.2 | 4.3 | 4.3 | 3.2 | 3.2 |
| SO() | 1.6/2.4 | 4.3 | 10.3 1.0 | 24.5 2.5 | 30.1 3.0 | 30.3 3.0 | 12.1 1.2 | 46.9 4.7 | 35.5 3.6 | 10.8 1.1 | 17.2 1.7 |
| HC3N(11–10) | 4.1/4.6 | 2.0 | 16.2 1.6 | 29.4 2.9 | 60.7 6.1 | 59.9 6.0 | 52.8 5.3 | 72.0 7.2 | 48.0 4.8 | 23.2 2.3 | 19.7 2.0 |
| CH3SH()A+E | 4.2/4.6 | 2.0 | 2.0 | 2.3 | 2.3 0.7 | 2.3 | 2.3 | 3.4 1.0 | 2.8 0.8 | 2.0 | 2.0 |
| H2CS() | 4.2/4.6 | 2.0 | 2.0 | 3.1 0.9 | 4.1 0.4 | 3.1 0.9 | 3.4 1.0 | 4.8 0.5 | 4.8 0.5 | 2.6 0.8 | 2.8 0.8 |
| CH3C2H() | 4.2/4.6 | 1.9 | 5.8 0.6 | 5.4 0.5 | 24.2 2.4 | 24.8 2.5 | 20.9 2.1 | 21.5 2.1 | 11.9 1.2 | 6.2 0.6 | 4.4 0.4 |
| H2CS | 4.1/4.6 | 1.9 | 1.9 | 2.2 | 2.5 0.8 | 2.2 0.7 | 2.2 | 3.8 1.1 | 2.8 0.8 | 2.2 0.7 | 2.6 0.8 |
| C17O(1–0) | 4.0/4.6 | 2.7 | 2.7 | 3.9 1.2 | 9.2 0.9 | 10.2 1.0 | 9.5 0.9 | 9.1 0.9 | 7.0 0.7 | 5.0 1.5 | 4.2 1.2 |
| CN(1-0;1/2-1/2) | 4.0/4.6 | 4.91.5 | 18.0 1.8 | 23.1 2.3 | 169 17 | 215 22 | 201 20 | 196 20 | 107 11 | 42.8 4.3 | 30.4 3.0 |
| CN(1-0;3/2-1/2) | 4.0/4.6 | 27.62.8 | 58.0 5.8 | 52.9 5.3 | 322 32 | 403 40.3 | 380 38 | 325 32 | 206 21 | 109 11 | 81.9 8.2 |
| CO(1-0) | 3.7/4.6 | 71872 | 1920 190 | 1570 160 | 3200 320 | 3550 360 | 3410 340 | 3130 310 | 2710 270 | 2160 220 | 1920 190 |
| NS(5/2-3/2;7/2-5/2) | 3.7/4.6 | 3.2 | 3.2 | 3.9 | 6.9 0.7 | 7.8 0.8 | 8.1 0.8 | 9.2 0.9 | 3.4 1.0 | 3.2 | 3.5 |
Note. — Integrated intensity measurements at positions 1–10 and intensity of the entire galaxy. Column 1: The transition. column 2: The original resolution of the ALMA data/common resolution used in this study. column 3-12: The integrated intensity for regions #1–#10 (see Fig. 4 for location of regions) with uncertainty. Uncertainties are set to 10%, representing absolute flux calibration uncertainties only, unless S/N is low then they are conservatively set to 30 % (see section 2). Small errors associated with missing flux are not included. We caution that values for region 6 may be affected by absorption towards the central continuum source. All upper limits are 5.
| Mol. | bbThe critical density (not including radiative trapping effects), log(). Rates are adapted from the Leiden LAMDA database, van der Tak et al. 2007, with ’s: HCN/H13N/HN13C: Dumouchel et al. (2010); HCO+/H13CO+: Flower (1999); SiO: Dayou & Balanca (2006); C2H: Spielfiedel et al. (2012); HNCO: Green (1986); CS: Lique et al. (2006a); SO: Lique et al. (2006b); HC3N Green & Chapman (1978); H2CS: Wiesenfeld & Faure (2013); CN: Lique et al. (2010); C17O: Yang et al. (2010). | 1 | 2 | 3 | 4 | 5 | 6 | 7 | 8 | 9 | 10 |
|---|---|---|---|---|---|---|---|---|---|---|---|
| H13CN | 6.48 | 0.2–1(-9) | 1–8(-10) | 0.4–2(-9) | 0.4–2(-9) | 0.5–3(-9) | 0.6–3(-10) | 0.6–3(-9) | 0.5–3(-9) | 2–9(-10) | 0.2–1(-9) |
| H13CO+ | 5.33 | 0.1–8(-10) | 0.5–3(-9) | 0.8–4(-10) | 0.2–1(-9) | 0.2–1(-9) | 0.6–3(-10) | 0.3–2(-9) | 2–9(-10) | 0.7–4(-10) | 0.7–4(-10) |
| SiO | 5.48 | 0.3–1(-9) | 0.3–1(-9) | 0.7–3.0(-9) | 0.5–2(-9) | 0.5–2(-9) | 0.8–3(-10) | 0.7–3(-9) | 0.6–3(-9) | 0.2–1(-9) | 0/3–1(-9) |
| HN13C | 5.62 | 0.3–2(-9) | 1–6(-10) | 1–7(-10) | 0.2–1(-9) | 0.8–4(-9) | 0.8–4(-10) | 0.3–1(-9) | 0.2–9(-10) | 0.9–5(-10) | 1–5(-10) |
| C2H | 5.27 | 0.4—2(-8) | 1–5(-8) | 2–8(-8) | 0.4–2(-7) | 0.4–2(-7) | 0.3–2(-7) | 0.5–3(-7) | 0.3-2(-7) | 1–6(-8) | 1–5(-8) |
| HNCO | 5.20 | 0.1–1(-8) | 0.4–3(-8) | 0.6–5(-8) | 0.1–1(-8) | 0.3–3(-9) | 0.3–2(-9) | 1–9(-9) | 0.3–2(-8) | 0.3–2(-8) | 0.5–4(-8) |
| HCN | 6.42 | 1–5(-9) | 0.2–1(-8) | 0.4–2(-8) | 0.4–2(-8) | 0.5–3(-8) | 0.3–2(-8) | 0.5–3(-8) | 0.6–3(-8) | 0.3–2(-8) | 0.3–2(-8) |
| HCO+ | 5.37 | 0.7–4(-9) | 0.7–4(-9) | 1–7(-9) | 0.2–1(-8) | 0.3–1(-8) | 1–7(-9) | 0.3–1(-8) | 0.4–2(-8) | 0.2–8(-9) | 1–7(-9) |
| CS | 5.78 | 0.5–2(-9) | 2–9(-9) | 0.4–2(-8) | 0.5–2(-8) | 0.5–2(-8) | 0.3–1(-8) | 0.7–3(-8) | 0.6–3(-8) | 0.3–1(-8) | 2–9(-9) |
| SO | 5.47 | 2–7(-9) | 2–6(-9) | 0.4—2(-8) | 0.3–1(-8) | 0.3–1(-8) | 1–4(-9) | 0.5–2(-8) | 0.4–2(-8) | 2–6(-9) | 0.3–1(-8) |
| HC3N | 5.71 | 1–0.7(-10) | 3–2(-10) | 6–4(-10) | 7–5(-10) | 7–4(-10) | 6–4(-10) | 9–5(-9) | 7–4(-10) | 4–3(-10) | 4–2(-10) |
| CH3SH | 1–7(-9) | 0.4–3(-9) | 0.5–3(-9) | 0.3–2(-9) | 0.2–2(-9) | 0.3–2(-9) | 0.4–3(-9) | 0.4–3(-9) | 0.3–2(-9) | 0.4–3(-9) | |
| H2CS | 5.25 | 2–6(-9) | 0.8–2(-9) | 0.9–3(-9) | 0.6–2(-9) | 0.5–1(-9) | 0.5–1(-9) | 0.9–3(-9) | 0.8–2(-9) | 0.8–2(-9) | 1–3(-9) |
| CN | 6.24 | 0.4–2(-8) | 0.4–2(-8) | 0.4–2(-8) | 1–6(-8) | 1–6(-8) | 2–7(-8) | 1–7(-8) | 1–5(-8) | 0.6–3(-8) | 0.5–2(-8) |
| NS | 0.3–1(-8) | 1–4(-9) | 1–4(-9) | 1–5(-9) | 1–5(-9) | 2–5(-9) | 2–6(-9) | 0.8–3(-9) | 1–3(-9) | 1–4(-9) | |
| C17O | 3.28 | 0.6–3(-7) | 0.2–1(-7) | 0.3–2(-7) | 0.4–2(-7) | 0.4–2(-7) | 0.4–2(-7) | 0.4–2(-7) | 0.4–2(-7) | 0.4–2(-7) | 0.3–2(-7) |
| N(H2) | 3.6(22) | 9.6(22) | 7.8(22) | 1.6(23) | 1.8(23) | 1.7(23) | 1.6(23) | 1.4(23) | 1.1(23) | 9.6(22) |