Microscopic properties of degradation-free capped GdN thin films studied by Electron Spin Resonance
Abstract
The microscopic magnetic properties of high-quality GdN thin films have been investigated by electron spin resonance (ESR) and ferromagnetic resonance (FMR) measurements. Detailed temperature dependence ESR measurements have shown the existence of two ferromagnetic components at lower temperatures which was not clear from the previous magnetization measurements. The temperature, where the resonance shift occurs for the major ferromagnetic component, seems to be consistent with the Curie temperature obtained from the previous magnetization measurement. On the other hand, the divergence of line width is observed around 57 K for the minor ferromagnetic component. The magnetic anisotropies of GdN thin films have been obtained by the analysis of FMR angular dependence observed at 4.2 K. Combining the X-ray diffraction results, the correlation between the magnetic anisotropies and the lattice constants is discussed.
I INTRODUCTION
Ferromagnetic semiconductors are expected to be a key material for the future spintronics.Wolf ; Senapati GdN is one of these ferromagnetic semiconductors and it is particularly interesting due to its partially filled 4f and 5d orbitals with saturation moment of 7 /Gd3+.Dhar Therefore, GdN has been the object of a series of theoretical and experimental studies since more than a half century. Busch ; Sharma ; Xiao ; Leuenberger ; Duan ; Gosh ; Geshi ; Aerts ; Lambrecht ; Granvile ; Li ; LiLi ; Wachter ; Cutler ; Gambino
However, it is well known from a number of studies of bulk GdN in the 60’s and 70’s Busch ; Wachter ; Cutler ; Gambino ; Duan2 ; Bush ; Schumacher that it is very difficult to obtain the high-quality bulk GdN because nitrogen vacancies and oxygen can damage it very easily. For example, it was reported that there is a strong decrease in the magnetic moment of bulk GdN even with few percent of oxygen.Gambino The decrease in Curie temperature of bulk GdN was confirmed with a range of oxygen concentration.Cutler Cutler also reported that the nitrogen vacancies make the hysteresis effect and the remenance much smaller.Cutler Understanding the properties of ”pure” GdN is still challenging because of the difficulty to produce high quality single crystals.
However, the situation has changed owing to the advanced technology of the thin film synthesis since the 2000s. Leuenberger ; Granvile ; Khazen These thin films are capped by AlN on GdN to make surface smooth and to restrict the oxygen contamination. These early studies of GdN thin film reported that the properties of the GdN thin film, contrary to bulk one, are very sensitive to their epitaxial strain, structural distortion and surface effect for nanocrystalline films. From the view point of the development in spintronics devices, therefore, it is very important to understand these parameters and how they affect the magnetic and optical properties of the high-quality GdN thin film.
More recently, H. Yoshitomi . and R. Vidyasagar . have studied the optical and magnetic properties in epitaxial AIN/GdN/AIN double heterostructures grown by reactive radio-frequency (rf) sputtering under ultra-pure conditions.Yoshitomi1 ; Yoshitomi2 ; Sagar1 ; Sagar2 ; Sagar3 For example, their high-quality GdN thin film of 95 nm showed the indirect and direct optical transitions, and the considerable size effects of the optical band gap were observed with a decrease in the GdN thickness. They also investigated the saturation magnetization and Curie temperature estimated by Arrott plots as a function of the thickness of GdN.Granvile ; Yoshitomi1 However, few cases, except for the ferromagnetic resonance (FMR) measurement by K. Khazen Khazen , studied the microscopic magnetic properties of these GdN thin films.
In this study, we investigate the microscopic magnetic properties of high-quality GdN thin films by the detailed temperature dependence of electron spin resonance (ESR), and the angular dependence of FMR at 4.2 K.
II EXPERIMENTAL DETAILS
We investigate the micro magnetic properties of three GdN samples. One has the thickness of 95nm whose optical and macro magnetic properties has been investigated by H. Yoshitomi et al.Yoshitomi1 We call this sample “08GdN” in this paper. The other samples has the thicknesses of 29 nm and 97 nm, respectively; we call these two samples “10GdN” in this paper. All samples were grown on c-sapphire (0001) substrates at 500 ∘C by reactive radio-frequency(RF) magnetron sputteringKishimoto in an ultrahigh vacuum chamber. The input RF power was 250 W. AlN/GdN/AlN double heterostructures were used to avoid oxidation.Gambino The growth chamber equipped with multitargets for AlN and GdN was separated from the substrate introduction chamber to avoid oxidation of the target when introducing the substrate. Al(99.99) and Gd(99.9) were used as metal targets. We used an ultrapure (99.9999) gas mixture of argon and nitrogen for reactive growth. For the synthesis of 08GdN thin film, the partial pressure ratio of argon and nitrogen was even, and the total sputtering pressure was 5 Pa. For the syntheses of 10GdN thin films, on the other hand, the partial pressure ration was 9:6, and the total sputtering pressure was 6 Pa for the purpose to decrease the number of nitrogen vacancies. However, the transmission and absorption spectral measurement showed that the number of free carrier in 10GdN is more than that in 08GdN. It’s not known exactly why the number of nitrogen vacancy in 10GdN is more than that in 08GdN.doctorYoshi The X-ray diffraction measurement showed that the lattice constant along (111) direction for 08GdN sample is nm. The 29nm and 97nm thin films of 10GdN have nm and nm, respectively. These lattice constants are longer than the bulk value nm. In addition, we also confirmed that the lattice constant along (200) direction is smaller than the bulk value nm; for example, the value for 95 nm thickness of 08GdN is nm. Therefore, our GdN thin films have uniaxial lattice distortion.
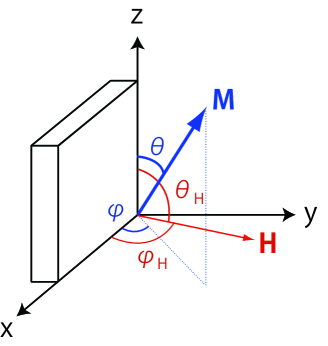
Our ESR/FMR measurements were performed by the Bruker X-band ESR spectrometer EXM081 at Center for Supports to Research and Education Activities, Kobe University, with 100kHz field modulation using a TE103 rectangular cavity in the temperature range of 4.2 K to 300 K. We show the geometry of the FMR measurements in Fig. 1, which is the same condition as that in Khazen’s paper.Khazen The GdN samples lie in the - plane, and the -axis is parallel to the growth face direction [111] of our thin films. The out-of plane variation of the external magnetic field is in the plane.
III EXPERIMENTAL RESULTS
Firstly, we show the temperature dependence of the resonance field. We successfully obtained the result of Fig. 2 (a) from the spectrum fitting, using the following double lorentzian equation with respect to the ESR spectrum at each temperature. Here, we would like to point out that the observed ESR signal is the differential curve. Total intensity as a function of external magnetic field is written by
| (1) | |||||
where is the intensity, is the resonance field, is the line width for component and and are background. These parameters are determined by the fitting experimental data. As an example, we show the ESR spectrum and the fitting result at 40 K for 95 nm thickness of 08GdN in the inset of Fig. 2 (a). Note that the external magnetic field was applied to in the plane (). Fig. 2 (a) shows the temperature dependence of resonance field for 95 nm thickness of 08GdN and 97nm thickness of 10GdN. We estimate the -factor by using the resonance field value 3524.9 G at the highest temperature 260 K. This value is consistent to that of Land -factor of Gd3+ whose total orbital angular momentum is 0. At the low temperature region, we can see clearly two kinds of phases not only for 08GdN but also for 10GdN which has the larger number of nitrogen vacancy. Therefore, the origin of the phase separation is not coming from the nitrogen vacancy. We have already confirmed the existence of such two kinds of phases in the other GdN samples.Yoshitomi2 The Curie temperature () for the 95 nm thickness of 08GdN has been reported about 37 K by using Arrott plot analysisYoshitomi1 , therefore, the shift in the resonance field around 40 K (res. 2 in Fig. 2 (a)) comes from a dominant part of the magnetization of GdN thin film in the ferromagnetic phase. In the present study, we also confirmed that the value for the 97 nm thicknesses of 10GdN is about 29 K by using Arrott plot analysis. The difference of the between 08GdN and 10GdN comes from the number of nitrogen vacancy.Cutler Careful observation of Fig. 2 (a) tells us that the resonance shift of 10 GdN (res. 2) begins at lower temperature than that of 08 GdN, and which is consistent that the Curie temperature for 10 GdN is lower than that of 08 GdN. Therefore, the shift in the resonance field around 30 K (res. 2) for 10GdN also comes from a dominant part of the magnetization in the ferromagnetic phase. The second shift at higher temperature side (70K (res. 1)) is originated from another ferromagnetic phase, which cannot be ascribed to the short-range correlation of spins at because without the phase separation we cannot observe two ESR’s in the intermediate temperature region (2557 K). The high-Tc phase may come from the interface because the contribution of res. 1 to the static magnetization is less than 1% for 08GdN at 50 K where the shift of res. 1 is close to the saturation while the shift of res. 2 has just started.Yoshitomi2 However it requires further investigation. Here we would like to emphasize that the observation of the two kinds of phases as in the case of Fig. 2 (a) suggests ESR measurements can easily detect the microscopic properties such as the phase separation which is difficult to be observed by macro measurements. We also note that it was difficult to measure the resonance field for 10 GdN samples at higher temperature region because the nitrogen vacancy provides carriers at higher temperature which causes the decrease of Q-factor in ESR measurements.
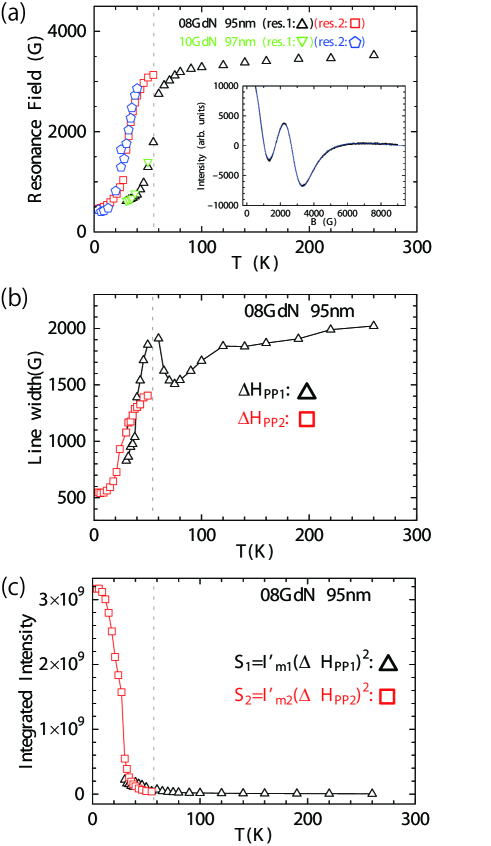
Next, we investigated the temperature dependence of the line width for 95 nm thickness of 08GdN. Fig. 2(b) shows the results about the line width. Owing to ESR measurements, we confirm the decreasing behaviors of the line width and below 57 K which corresponds to the mid-point of res. 1 resonance shift in Fig. 2(a). The decreasing behavior with decreasing temperature in the ferromagnetic phase is well known as a typical property in the ferromagnetic region.Magnetism1 It is also interesting that the divergence behavior of can be observed clearly near at 57 K. This divergence of the line width indicates the presence of spin fluctuations near .Michael The similar increase behavior near above has been also confirmed roughly in typical FM thin films.Michael However, no such divergence behavior is observed for suggesting the different spin dynamics for res. 1 and res. 2. We also investigated the temperature dependence of the integrated intensity as shown in Fig. 2(c). Here, integrated intensity for each component can be calculated by the line width and intensity . It is well known in ESR that can be estimated by . According to this result, we can determine which of two separated phases is smoothly connected to the dominant part in the ferromagnetic ground state. Therefore, we can say that “res. 2” in Fig. 2 (a) and in Fig. 2(b) correspond to the dominant part in ferromagnetic state.
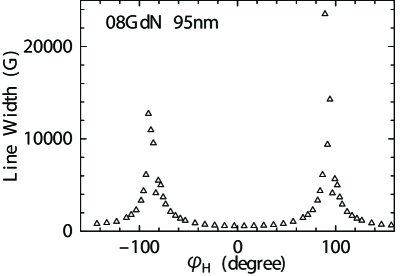
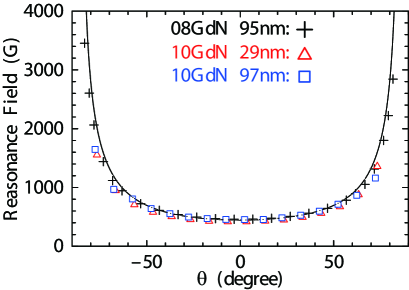
Next, we investigated the angular dependence of FMR. For example, Fig. 3 shows the angular dependence of the FMR for the 08GdN at 4.2K where is varied from to . Here, we measured the FMR in the interval of 10 degrees. We confirm that the resonance field is very sensitive to the angular variation. Applying the equation (1) to analyze data in Fig. 3 we get the angular dependence of the line width in Fig. 4. Owing to the closely-spaced angulars we took, we see the peak structures clearly at in Fig. 4. We also gain the angular dependence of the resonance field. Fig. 5 presents the angular dependence of the resonance field for our three samples obtained by the Lorentzian fitting. In order to investigate the film thickness dependence, we add the data for 29 nm thickness of 10GdN sample. All sample shows that the resonance field was maximized when external magnetic field was applied in the direction of out-of-plane, and minimized when in the direction of in-plane. This result consistent with typical FMR spectraOhta , and with behaviors of Khazen’s samplesKhazen . A careful observation of Fig. 5 enable us to confirm the resonance field value for 29 nm thickness of 10GdN is lower than those for the other samples. This behavior means that the magnetic anisotropy for 29 nm thickness of 10GdN is different from the other samples.
Finally, we analyzed the magnetic anisotropy for our GdN thin film from the angular dependence of the FMR spectra. We use “Smit-Beljer formalism”Smit for our analysis which is applicable to thin film of cubic symmetry allowing for a possible uniaxial deformation, because our GdN samples also have uniaxial anisotropy in the process of synthesis. In this case, the energy density can be written by
| (2) |
which represent the Zeeman interaction, the magnetic anisotropic energy, and the demagnetization energy. Here, is the fourth order cubic magnetocrystalline anisotropy constant, and is the second order uniaxial anisotropy constant. is the direction cosines of the magnetization relative to the cubic crystal axes, and is the applied field (See Fig. 1). In order to analyze the results in Fig. 5, we can generally fix in Fig. 1 and use the following equations. One is the static equilibrium orientation of the magnetization
| (3) |
and the other is the resonance field equation
| (4) | |||||
These two fitting equations for FMR measurements are derived from the following three resonance conditions (Smit-Beljers equatons Smit ):
| (5) | |||||
| (6) |
In Fig. 5 the example of the fitting result for 08GdN sample is shown by the black line. The fitting is rather successfull. Small deviations between the data and the fitting close to may be due to the subtle misalignment ot the sample to the applied magnetic field. We also performed the same fitting to the obtained data for 10GdN 29 nm and 97 nm samples where the fitting lines are not shown in Fig. 5 to avoid the complication in Fig. 5. However, the fittings are also rather successful. Table 1 shows our analysis results for magnetic anisotropy constants. Here the magnetization for each sample is obtained from the paper.Sagar3 These crystal anisotropies and are much different from the Khazen’s resultsKhazen . Our value is almost one third, and is two or three times of each value of Khazen’s bulk sample, respectively. The reason of the difference comes from the difference in the crystal growth process. The Khazen’s GdN samples were deposited on (100) oriented Si substrate and these films were polycrystalline. On the other hand, our samples were grown along to the (111) direction of GdN on c-sapphire (0001) substrates by reactive radio-frequency magnetron sputtering in an ultrahigh vacuum chamber. More concretely, the lattice constant of the Khazen’s extended film was increased 2.4 uniformly not along to a specific direction, and the value of 2.4 increased samples are larger than that of Khazen’s bulk sample. The lattice constant along (200) direction of our samples were decreased although the lattice constant along (111) direction were increased. In fact, the lattice constant along (111) direction for the samples of the 95 nm thickness of 08GdN and 97 nm thickness of 10GdN is is 0.507 nm which is larger than the reported bulk value =0.4998 nm.The lattice constant along (200) direction for 97 nm thickness of 08GdN is a=0.249 nm and this value is smaller than the bulk value of 0.250 nm. In addition, the coefficient of thermal expansion of our substrate AlN is 4.4 which is larger than that of the Si substrates, 2.4 . Therefore, we can naturally accept the difference between our and Khanzen’s samples. We also note that the value for 29 nm thickness of 10GdN is larger than those of our other samples. The largeness comes from the small lattice constant for 29 nm thickness of 10GdN along (111) direction, 0.506 nm. In other words, the values has the tendency to come close to the bulk value when the lattice constant approaches to the bulk value 0.4998 nm. We should be careful to the fact that these lattice constant values measured by X-ray diffraction are just average values. Therefore, we can not discuss about the second order uniaxial anisotropy from the view point of the lattice constant because the values are mainly affected by the interfacial surface of crystal. It is naturally expected that our values are more sensitive than Khazen’s sample because Khazen’s films are polycrystalline. This is the origin that our values are larger than those of Khazen’s. The value of 95 nm thickness for 08 GdN is slightly larger than that of 97 nm thickness for 10GdN. We speculate that it may come from the nitrogen vacancy, that means, the strain at the interfacial surface for 10GdN samples was relaxed by the large number of nitrogen vacancy. We also comment about the characteristic which our thinner sample of 29 nm thickness for 10 GdN has the largest value. It is characteristic of ferromagnetic thin films that the thinner thickness sample has the larger value of . This behavior is well known theoretically and experimentally, for example, Fe/MgO multilayered films.Ohta According to these obtained results, the FMR analysis is very useful to obtain the microscopic properties.

| 4 (Oe) | 2 (Oe) | 2 (Oe) | (erg/cm3) | (erg/cm3) | T(K) | ||
| 08GdN 95nm | 24167 | 11167 | 404 | 1.07 | 3.88 | 4.2 | in this paper |
| 10GdN 29nm | 28660 | 14760 | 394 | 1.68 | 4.49 | 4.2 | in this paper |
| 10GdN 97nm | 24027 | 10527 | 380 | 1.01 | 3.63 | 4.2 | in this paper |
| Bulk film | 22220 | 5759 | 1292 | 5.09 | 1.14 | 4.0 | ref. 23 |
| 2.4 extended film | 15620 | 2897 | 2252 | 1.8 | 1.4 | 4.0 | ref. 23 |
IV CONCLUSION
We have investigated microscopic properties of high-quality GdN thin films. Detailed temperature dependence ESR measurements have been performed for the first time and they showed the existence of two ferromagnetic components at lower temperatures. It also showed that the temperature, where the resonance shift occurs for the major ferromagnetic component, seems to be consistent with the Curie temperature obtained from the previous magnetization measurement. On the other hand, the divergence of line width is observed around 57 K for the minor ferromagnetic component. We have also determined the fourth order cubic magnetocrystalline and second order uniaxial anisotropies of our GdN samples from the angular dependence of FMR measurements observed at 4.2 K. Our analysis by Smit-Beljer formalism have clarified that the cubic anisotropy is very sensitive to the lattice constant of thin film and the uniaxial anisotropy values depend on the thickness of thin films strongly.
References
- (1) S. A. Wolf, D. D. Awschalom, R. A. Buhrman, J. M. Daughton, S. von Molnar, A. Y. Chtchelkanova, and D. M. Treger, Science 294, 1488 (2001).
- (2) K. Senapati, M. G. Blamire, and Z. H. Barber, Nature Mater. 10, 849 (2011).
- (3) S. Dhar, L. Perez, O. Brandt, A. Trampert, K. H. Ploog, J. Keller, and B. Beschoten, Phys. Rev. B 72, 245203 (2005).
- (4) G. Busch, J. Appl. Phys. 38, 1386 (1967).
- (5) A. Sharma and W. Nolting, Phys. Rev. B 81, 125303 (2010).
- (6) J. Q. Xiao and C. L. Chien, Phys. Rev. Lett. 76, 1727 (1996).
- (7) F. Leuenberger, A. Parge, W. Felsch, K. Fauth, and M. Hessler, Phys. Rev. B 72, 014427 (2005).
- (8) C. Duan, R. F. Sabiryanov, J. Liu, W. N. Mei, P. A. Dowben, and J. R. Hardy, Phys. Rev. Lett. 94, 237201 (2005).
- (9) D. B. Gosh, M. De, and S. K. De, Phys. Rev. B 72, 045140 (2005).
- (10) M. Geshi, K. Kusakabe, and N. Suzuki, J. Phys.: Condens. Matter 16, S5701 (2004).
- (11) C. M. Aerts, P. Strange, M. Horne, W. M. Temmerman, Z. Szotek and A. Svane, Phys. Rev. B 69, 045115 (2004).
- (12) W. R. L. Lambrecht, Phys. Rev. B 62, 13538 (2000).
- (13) S. Granville, B. J. Ruck, F. Budde, A. Koo, D. Pringle, F. Kuchler, A. Bittar, G. V. M. Williams, and H. J. Trodahl, Phys. Rev. B 73, 235335 (2006).
- (14) D. X. Li, Y. Haga, H. Shida, T. Suzuki, Y. S. Kwon, and G. Kido, J. Phys.: Condens. Matter 9, 10777 (1997).
- (15) D. X. Li, Y. Haga, H. Shida, and T. Suzuki, Physica B 199&200, 631 (1994).
- (16) P. Wachter and E. Kaldis, Solid State Commun. 34, 241 (1980).
- (17) R. A. Cutler and A. W. Lawson, J. Appl. Phys. 46, 2739 (1975).
- (18) R. J. Gambino, T. R. McGuire, H. A. Alperin, and S. J. Pickart, J. Appl. Phys. 41, 933 (1970).
- (19) C. G. Duan, R. F. Sabirianov, W. N. Mei, P. A. Dowben, S. S. Jaswal, and E. Y. Tsymbal, J. Phys.: Condens. Matter 19, 315220 (2007)
- (20) G. Bush, P. Junod, F. Levy, A. Menth, and O. Vogt, Phys. Lett. 14, 264 (1965).
- (21) D. P. Schumacher and W. E. Wallace, J. Appl. Phys. 36, 984 (1965).
- (22) K. Khazen, H. J. von Bardeleben, J. L. Cantin, A. Bittar, S. Granville, H. J. Trodahl, and B. J. Ruck, Phys. Rev. B 74, 245330 (2006).
- (23) H. Yoshitomi, S. Kitayama, T. Kita, O. Wada, M. Fujisawa, H. Ohto, and T. Sakurai, Phys. Rev. B 83, 155202 (2011).
- (24) H. Yoshitomi, R. Vidyasagar, S. Kitayama, T. Kita, H. Ohta, S. Okubo, Y. Fukuoka, and T. Sakurai, Appl. Phys. Lett. 101, 072403 (2012).
- (25) R. Vidyasagar, S. Kitayama, H. Yoshitomi, T. Kita, T. Sakurai, and H. Ohta, Appl. Phys. Lett. 100, 232410 (2012).
- (26) R. Vidyasagar, H. Yoshitomi, S. Kitayama, T. Kita, H. Ohta, and T. Sakurai, J. Phys.: Conf. Ser. 417, 012053 (2013).
- (27) R. Vidyasagar, T. Kita, T. Sakurai, and H. Ohta, Appl. Phys. Lett. 102, 222408 (2013).
- (28) A. Kishimoto, Y. Inou, T. Kita, and O. Wada, Phys. Status Solidi C4, 2490 (2007).
- (29) H. Yoshitomi, doctor thesis, Kobe Univ. (2012).
- (30) C. W. Haas and H. B. Callen,“Magnetism Vol. I”, G. T. Rado and H. Suhl Eds. (Academic Press, New York and London, 1963) 449.
- (31) M. Farle, Rep. Prog. Phys . 61, 755 (1998).
- (32) H. Ohta, S. Imagawa, M. Motokawa, and E. Kita, J. Phys. Soc. Jpn . 62, 4467 (1993).
- (33) J. Smit and H. C. Beljers, Philips Res. Rep. 10, 1113 (1955).