An observational proxy of halo assembly time and its correlation with galaxy properties
Abstract
We show that the ratio between the stellar mass of central galaxy and the mass of its host halo, , can be used as an observable proxy of halo assembly time, in that galaxy groups with higher assembled their masses earlier. Using SDSS groups of Yang et al., we study how correlates with galaxy properties such as color, star formation rate, metallicity, bulge to disk ratio, and size. Central galaxies of a given stellar mass in groups with tend to be redder in color, more quenched in star formation, smaller in size, and more bulge dominated, as increases. The trends in color and star formation appear to reverse at , reflecting a down-sizing effect that galaxies in massive halos formed their stars earlier although the host halos themselves assembled later (lower ). No such reversal is seen in the size of elliptical galaxies, suggesting that their assembly follows halo growth more closely than their star formation. Satellite galaxies of a given stellar mass in groups of a given halo mass tend to be redder in color, more quenched in star formation and smaller in size as increases. For a given stellar mass, satellites also tend to be smaller than centrals. The trends are stronger for lower mass groups. For groups more massive than , a weak reversed trend is seen in color and star formation. The observed trends in star formation are qualitatively reproduced by an empirical model based on halo age abundance matching, but not by a semi-analytical model tested here.
keywords:
methods: statistical – galaxies: evolution – galaxies: formation – galaxies: haloes.1 Introduction
In the current standard CDM model, dark matter halos form through gravitational instability - induced hierarchical clustering, and galaxies are believed to form at the centers of dark matter halos through cooling and condensation of baryonic gas (e.g. Mo et al., 2010, for a review). The formation and evolution of galaxies are, therefore, expected to be closely linked to the assembly history of their host halos. There have been continuous efforts to establish the connections between galaxies of different properties and dark matter halos using empirical models, such as halo occupation distribution (HOD) (e.g. Jing et al., 1998; Peacock & Smith, 2000; Seljak, 2000; Scoccimarro et al., 2001; Berlind & Weinberg, 2002; Zheng et al., 2007; Leauthaud et al., 2012; Watson et al., 2012), conditional luminosity function (CLF) (Yang et al., 2003; van den Bosch et al., 2007), and halo abundance matching (HAM) (Mo et al., 1999; Kravtsov et al., 2004; Vale & Ostriker, 2004, 2006; Conroy & Wechsler, 2009; Guo et al., 2010; Neistein et al., 2010; Watson et al., 2012; Kravtsov, 2013). The CLF and HOD models assign galaxies into dark matter halos predicted by a given cosmology, so that the predicted galaxy population matches the observed luminosity (stellar mass) functions and spatial clustering properties of galaxies. The HAM approach, on the other hand, populates galaxies into halos and sub-halos, assuming that there is a roughly monotonic correspondence between the ranking orders of the luminosities (or stellar masses) of galaxies and those of the masses of dark matter halos.
Most of the studies based on these approaches have so far focused on using the mass of halos to link galaxies with halos, thus implicitly assuming that galaxy properties are determined by halo mass alone. In reality, however, other properties of halos, such as assembly history, spin, and shape, may also play an important role in galaxy formation and evolution. These halo properties, therefore, should also be used in understanding the relationships between galaxies and halos.
In this paper, we investigate how the properties of galaxies of a given stellar mass are correlated with the assembly time of their host halos. To this end, we propose an observational proxy of halo assembly time motivated by the results of Wang et al. (2011). Using high-resolution -body simulations, Wang et al. investigated a large number of halos properties, such as formation time, substructure fraction, spin and shape, and their correlations among themselves and with large scale environments. Most of these halo properties are, unfortunately, not directly observable, and so it is difficult to test directly their effects on galaxy formation with observational data. One exception is the sub-structure fraction, which is defined as , where is the mass of the halo, and is the mass of the main sub-halo located at the center of the host halo. This quantity is found to be correlated tightly with many other halo properties, in particular the formation time, spin and shape. More importantly, this quantity may be estimated from observations. Indeed, with a well-defined galaxy system, such as a galaxy group selected with the halo-based group finder of Yang et al. (2005), a good proxy of is , the stellar mass of the central galaxy in a group according to halo-galaxy abundance matching, and can be estimated from the total stellar mass of the group, as demonstrated in Yang et al. (2005, 2007). Thus, one can use as an observational proxy of the assembly time of the host halo of the group, and study how galaxy properties change with . The goal of the present paper is to use this proxy to study the correlations between galaxy properties and the assembly time of their host groups (halos).
This paper is organized as follows. In Section 2, we describe the observational galaxy catalogs from which our galaxy and group samples are selected. In Section 3 we demonstrate how can be used as a reliable proxy of halo assembly time. Detailed analyses of the correlations between galaxy properties and of their host groups are presented in Section 4, and a preliminary comparison of our results with models is made in Section 5. Finally, in Section 6, we summarize our main conclusions.
2 Observational Data
2.1 SDSS galaxies
The galaxy samples used in this paper are obtained from the Sloan Digital Sky Survey (SDSS). Specifically, the galaxy catalog, as described in Wang et al. (2012) (W12 hereafter) and publicly available at http://gax.shao.ac.cn/data/Group.html, is constructed from the New York University Value-Added Galaxy Catalogue (NYU-VAGC ; Blanton et al., 2005), which is based on SDSS Data Release 7 (SDSS DR7 ; Abazajian et al., 2009), but updated with a set of improvements over the original pipeline. From this catalog, we select all galaxies in the Main Galaxy Sample with extinction-corrected apparent -band magnitude brighter than , with redshifts in the range , and with redshift completeness . This leaves 639,359 galaxies in total, with a sky coverage of 7,748 . Of these, 599,301 galaxies have redshifts from the SDSS DR7, 2,450 galaxies with redshifts from the 2dFGRS (Colless et al., 2001), 819 with redshifts from the Korea Institute for Advanced Study Value-Added Galaxy Catalogue (KIAS-VAGC ; e.g. Choi et al., 2010), 36,759 galaxies with redshifts from their nearest neighbors (since they do not have spectroscopic redshift measurements due to fiber collisions), and 30 galaxies with redshifts from ROSAT X-ray clusters. We exclude galaxies with assigned redshifts that have to prevent fiber-collided galaxies with real redshifts much lower than the nearest neighbors so that their luminosities are vastly over-estimated. The catalog also contains, for each galaxy, the and other colors, which are all -corrected to . In the following, this catalog will be referred to as the SDSS DR7 catalog to distinguish it from other catalogs we use in our study.
For all galaxies, we adopt stellar masses () from the data release of Brinchmann et al. (2004), available at http://www.mpa-garching.mpg.de/SDSS/DR7/. The data release also provides star formation rates (SFRs), and specific star formation rates (sSFRs, defined to be SFR divided by ). The SFRs are obtained by fitting the SDSS spectra with a spectral synthesis model. Specifically, H luminosities are used for star forming galaxies and the D4000 breaks are used for galaxies without significant emission lines. Gas phase metallicities [for example, oxygen abundance, in terms of log(O/H)] are also available for a fraction of the galaxies, as described in Tremonti et al. (2004). In total, about of the galaxies in the SDSS DR7 catalog are missing in the Brinchmann et al. data release, most of which are fiber-collided galaxies missing spectra. The number of galaxies for which a given quantity is actually available varies from quantity to quantity. For example, gas phase metallicity is available only for emission line galaxies.
2.2 Disk-bulge decomposition
We also make use of the results of Simard et al. (2011) obtained from bulge-disk decompositions of galaxies, which fit each galaxy image with the sum of a pure exponential disk and a de Vaucouleurs bulge using GIM2D. The code returns parameters such as the total flux, the bulge to total ratio , the bulge half-light radius and the disk scale length . In this paper we use the results based on the -band images. About of our SDSS DR7 galaxies can be cross identified in Simard et al.’s data base.
2.3 Information from the Galaxy Zoo
The Galaxy Zoo is a project in which volunteers are asked to classify images of over 900,000 SDSS DR7 galaxies into six morphological categories. The Galaxy Zoo 2 (GZ2 hereafter; Willett et al., 2013), the successor of the original Galaxy Zoo, continued the spirit of the original project but asking volunteers much more detailed morphological questions such as the number of spiral arms, tightness of the arms, etc. To enable such detailed questions, GZ2 uses a subsample of the brightest 25 of the resolved galaxies in the SDSS North Galactic Cap region within the redshift range of along with a few more selection criteria (see Willett et al., 2013). This leaves a grand total of 245,609 SDSS DR7 galaxies.
The SDSS metadata for GZ2 (available at http://data.galaxyzoo.org/) adds a series of useful information for SDSS DR7 galaxies, in particular, morphological classifications made by volunteers’ votes. Whenever ‘ellipticals’ or ‘spirals’ are seen in our following analyses, the classification is based on GZ2. Out of all galaxies cross-matched between SDSS DR7 and GZ2, 97,785 are ellipticals and 135,634 are spirals.
2.4 SDSS groups
Given that galaxy groups are defined as galaxies that reside in the same dark matter halo, galaxy groups can be used to directly probe the connections between galaxies and their host halos. Yang et al. (2005, 2007) have developed a halo-based group finder optimized for grouping galaxies in common dark matter halos. The performance of this group finder has been tested extensively using mock galaxy redshift surveys constructed from CLF models (Yang et al., 2003; van den Bosch et al., 2003; Yang et al., 2004) and from a semi-analytical model (Kang et al., 2005). It was found that this group finder is more successful than the traditional friends-of-friends (FoF) algorithm in grouping galaxies into their common dark matter haloes (see Yang et al., 2007, (Y07 hereafter)). The group finder performs consistently even for very poor systems such as isolated galaxies in small mass haloes, which enables its suitability to probe the galaxy-halo connection over a wide range of different haloes.
In the present paper, we use the DR7 group catalog, publicly available at http://gax.shao.ac.cn/data/Group.html to associate galaxies with groups. This catalog is made basically by applying exactly the same group finder of Y07 to SDSS DR7 galaxies. The details of the group finder is described in Y07. WMAP5 cosmology was used to calculate distances from redshifts and to assign halo masses to selected groups. We adopt the group catalog ‘modelC’, which uses model magnitudes rather than Petrosian magnitudes. For each group in the group catalog, the fraction, , of each group’s volume that falls inside of the SDSS DR7 survey volume is given. Only groups with are used here, which removes about of all groups.
The group halo masses in the catalog are estimated using the ranking of groups either in the combined luminosity () or in the combined stellar mass () of all member galaxies with . The conversion from or to is made by adopting the halo mass function of Tinker et al. (2008) and the method of abundance matching assuming one-to-one correspondence between () and . As shown in Y07, while both and are tightly correlated with , the - relation is slightly tighter, with a typical dispersion of dex in for a given over the halo mass range considered here. We therefore use based on , although our tests showed that using does not change any of our results. For very small groups, no masses are assigned, and they are excluded from our analysis.
The identification of central galaxies for each group is also provided in two different ways: the brightest galaxy or the most massive galaxy in terms of stellar mass. In this study, we choose the latter as the definition of centrals.
3 An Observational Proxy of Halo Assembly Time
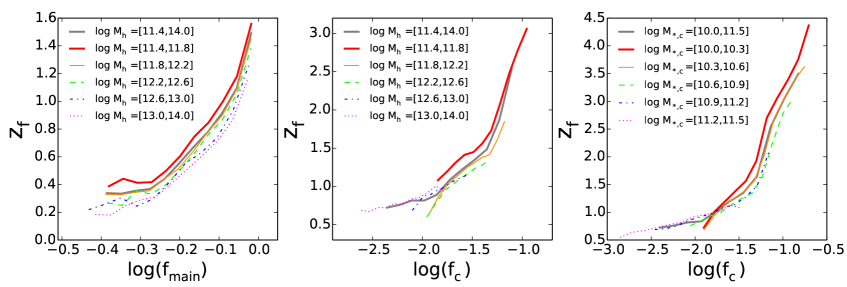
As mentioned in the introduction, Wang et al. (2011) (hereafter W11) explored the correlations among various halo properties using dark matter halos identified from high-resolution -body simulations. One of the most important properties of a halo is its formation time, , which is defined to be the redshift at which the main progenitor of the halo has first assembled half of its final mass. This formation time is believed to have significant impact on the properties of the galaxies the halo hosts, such as galaxy age, color, star formation rate (SFR), etc. Unfortunately, itself is not directly observable, and so it is not possible to examine the correlation between of a halo and the properties of the galaxies the halo host. However, as shown in figure 1 of W11, and reproduced in the left panel of Figure 1, the halo formation time shows a tight correlation with the sub-structure fraction, with , where is the mass of the main sub-halo at the center of each host halo, quite independent of the mass of the host halo. This suggests that can be used as a proxy of . Since can be estimated for halos using halo abundance matching, as described in the previous section, and can be estimated using sub-halo abundance matching, we can define an ‘observable’ quantity,
| (1) |
as a proxy of . Here is the stellar mass of the central galaxy obtained from the rank of . If there were no scatter in the halo-galaxy abundance matching, so that there is a one-to-one relation between galaxy stellar mass and sub-halo mass, would be a perfectly faithful indicator of . By definition would also be the stellar mass of the most massive galaxy in a group because the main sub-halo is the most massive one among all sub-halos. In reality, however, the halo mass - galaxy mass relation may not be one-to-one. Given this and that is not perfectly correlated with , defined above can only be used as a proxy of . As an illustration, the middle and right panels of Fig. 1 shows the correlation between and obtained from the HAM model of Hearin & Watson (2013) applied to dark matter halos in a high-resolution -body simulation. As one can see, there is a tight correlation between and both for halos of a given mass (middle panel) and for centrals of a given stellar mass (right panel). In particular, the - relation does not seem to depend strongly on halo mass or on galaxy mass, although massive systems extend further towards the low- end because of the fact that only increases slowly with halo mass at the massive end (e.g. Yang et al., 2012). All these validate the use of as an observational proxy of .
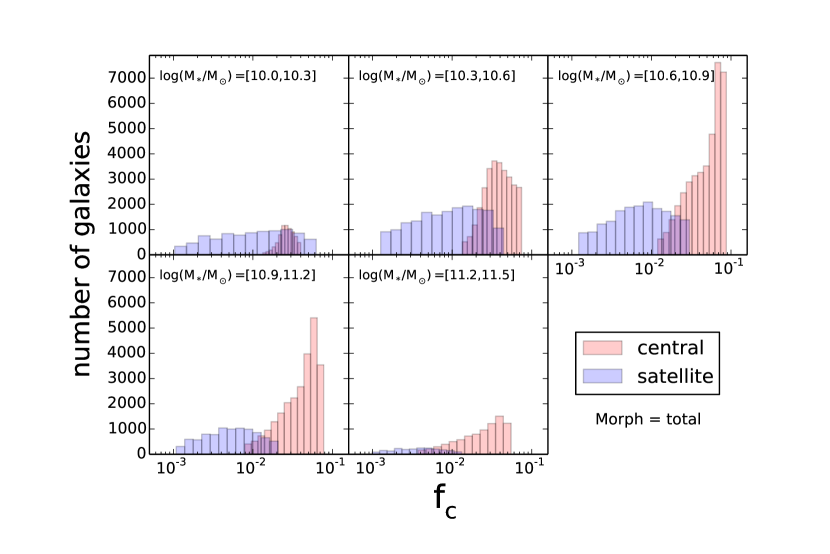
In what follows we will examine how galaxy properties are correlated with , and use the results to understand the connection between galaxy properties and halo assembly histories as represented by the formation redshift . For reference, we show the distribution of galaxies in for the entire SDSS DR7 sample in Figure 2. Each panel corresponds to a given stellar mass bin, as indicated in individual panels, and results are shown for both centrals and satellites. As expected, the centrals, defined to be the most massive ones in groups, have on average a higher value than satellites, since groups with lower tend to have more satellites in them.
4 Correlation of galaxy properties with
This section examines the correlation of galaxy intrinsic properties with the value of of the host group in which the galaxy resides. Results will be shown separately for central and satellite. While our presentation includes all groups, our test using only groups with more than one member galaxies brighter than gives qualitatively similar results.
4.1 Central galaxies
4.1.1 Color and star formation
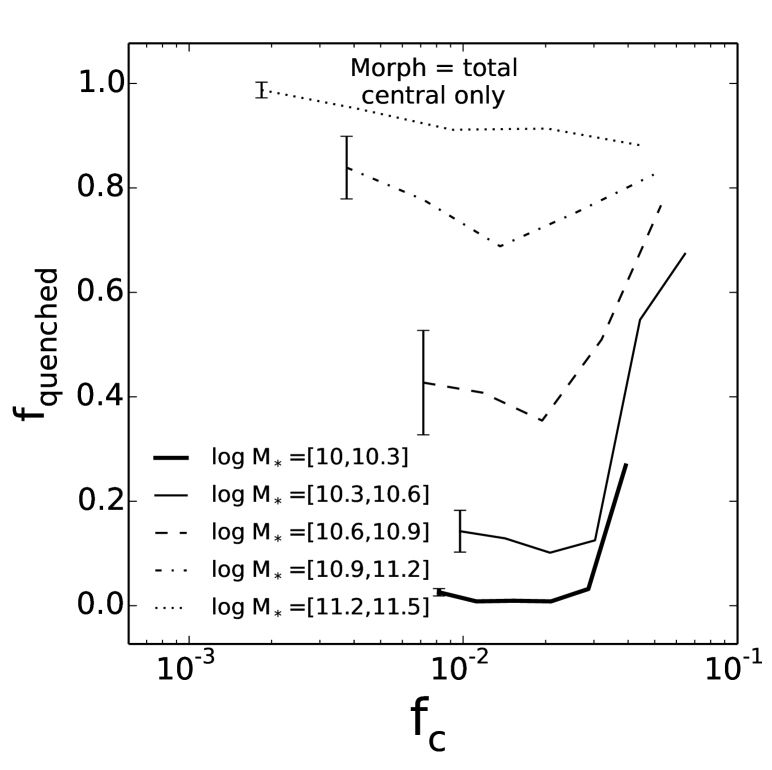
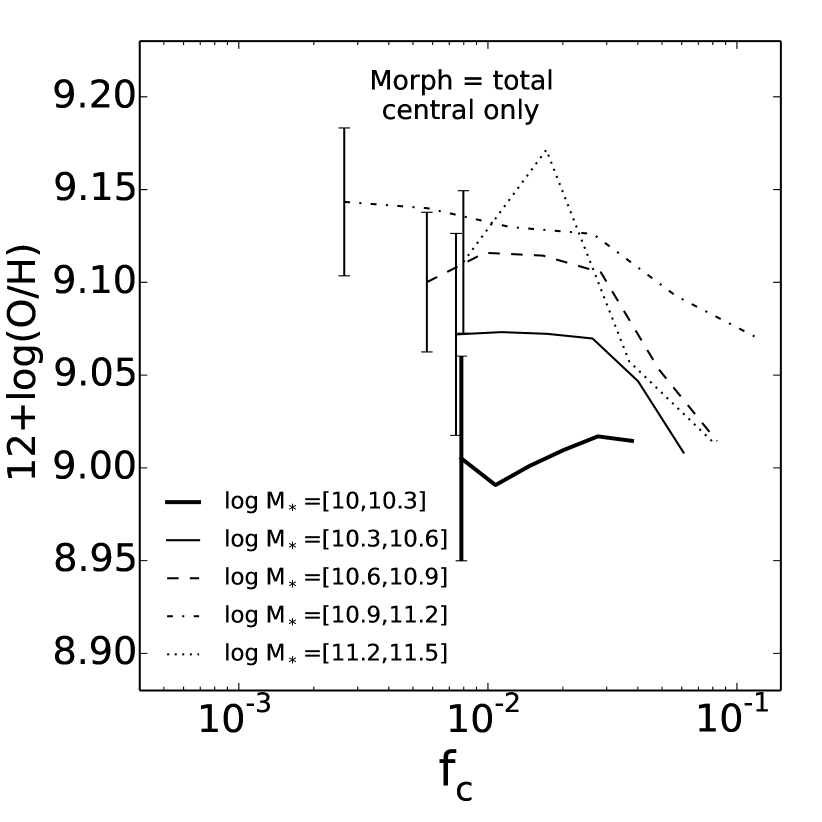
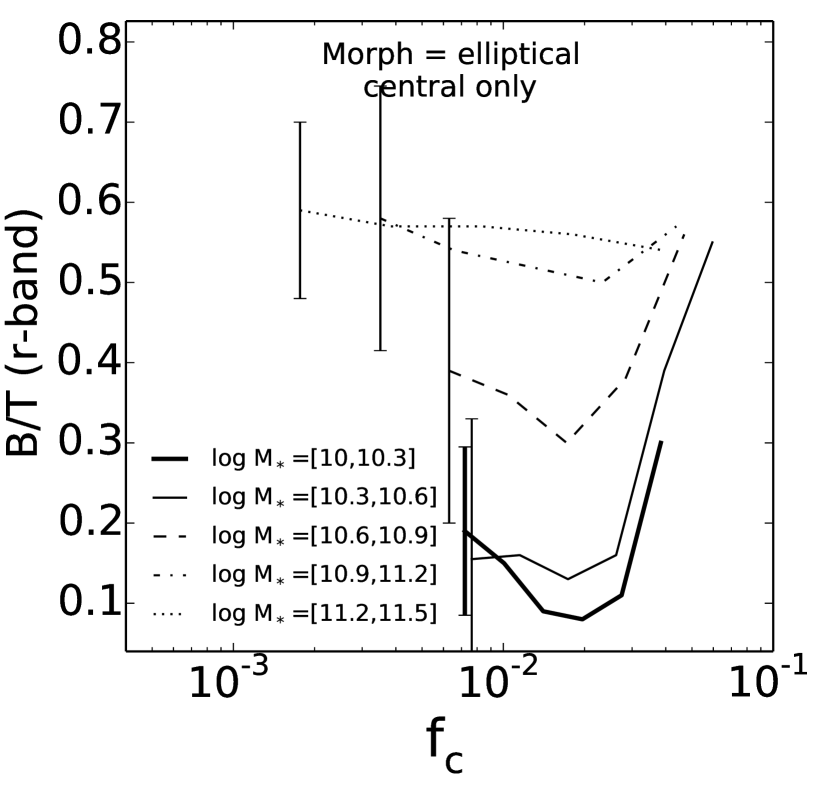
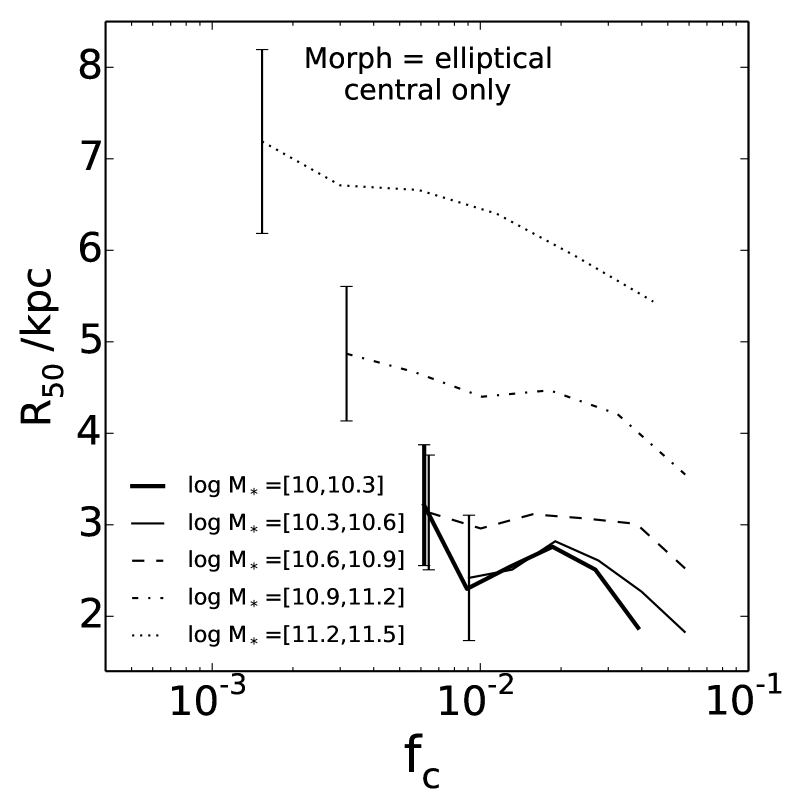
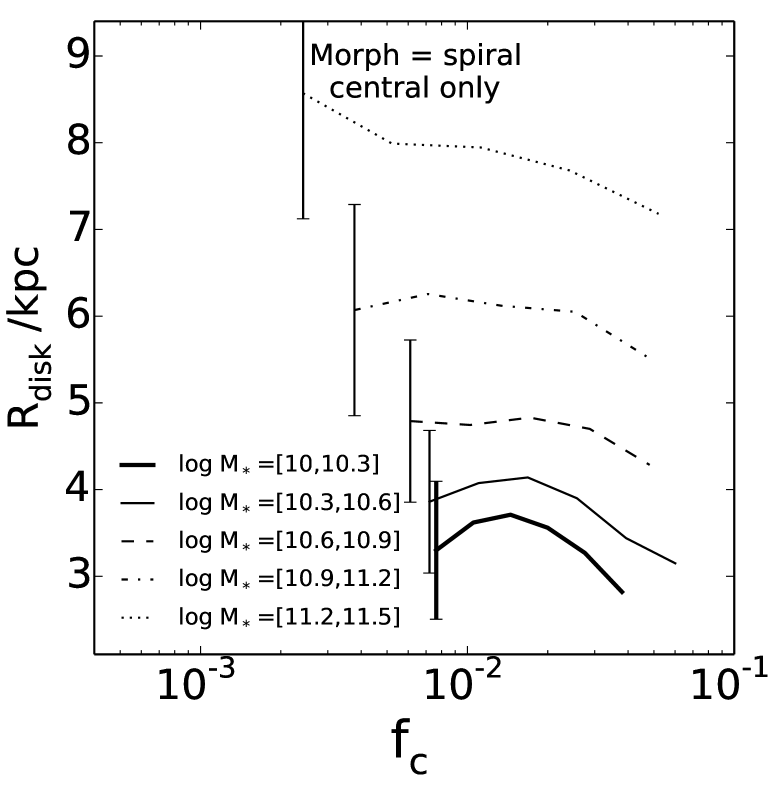
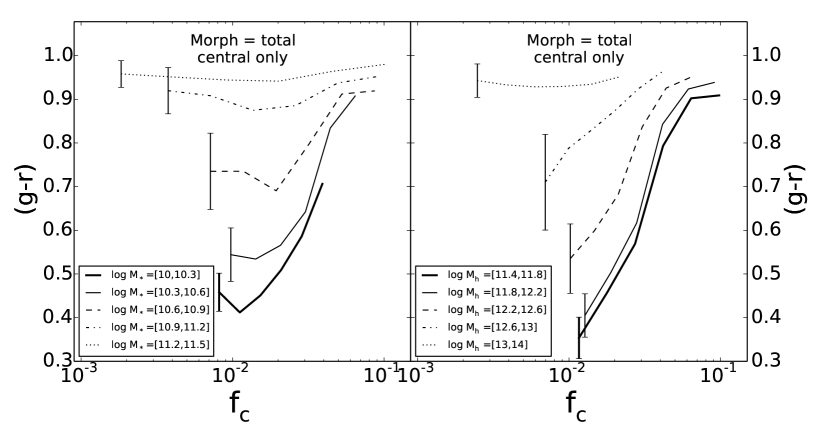
Figure 3 shows the correlation between the color of central galaxies and of their host groups. In the left panel, results are shown separately for galaxies in five different stellar mass ranges, as indicated in the inner panel, while in the right panel results are shown separately for five different halo mass bins. The lines are the median values within narrow bins, while the bars present the typical range of the distribution in the corresponding halo mass or stellar mass range.
As one can see from the right panel, for a given halo mass, the color depends strongly on , with centrals in halos with higher being redder, except for the most massive halos, where the centrals are all equally red. Note that for halos with masses below , the dependence of color on halo mass is not strong for a given . By definition, for a given halo mass, is directly proportional to , and it is well known that the intrinsic properties of galaxies depend strongly on their stellar mass. Thus, the strong dependence of color on for a given halo mass bin see here is not surprising. However, given that is strongly correlated with halo formation time (see Fig. 1), our results suggest that halo formation time may play an important role in determining the color of the central galaxies. This is demonstrated more clearly in the left panel of Figure 3, where the color is shown as a function of for centrals of fixed stellar mass. As one can see, massive galaxies are more or less all red, independent of , while for galaxies with , their colors depend strongly on . There seems to be a characteristic value - , below and above which the color shows the opposite trends with . At the high end, galaxies become increasingly redder as increases, which may be produced by the fact that groups with higher on average assembled their halos earlier. In contrast, galaxies in groups with seem to have a reversed, albeit weak, trend between color and . Note that for a given central stellar mass, lower corresponds to higher halo mass. The reversed trend at low reflects a ‘down-sizing’ effect of massive halos, in that centrals in massive halos formed their stars earlier than in low mass halos (e.g. Lu et al., 2015), although the massive host halos themselves assembled (half of their masses) later (lower ). This is consistent with the fact that in situ star formation in massive halos is quenched once their masses reached a few times (e.g. figure 14 of Lu et al., 2014b), and, for high mass halos, more massive ones on average assembled a fixed amount of mass earlier (Li et al., 2008).
Figure 4 shows the quenched fraction of centrals as a function of . Because for a given halo mass, and stellar mass is strongly degenerated for centrals, here and in the following we only show results for centrals divided into different stellar mass bins but not divided further according to halo mass. For galaxies in each stellar mass bin, we separate them into quenched and star forming sub-populations using the definition of Moustakas et al. (2013),
| (2) | |||||
For a given , galaxies with star formation rate (SFR) above the value given by the above equation are defined to be star forming, and those with SFR below the value are defined to be quenched. Given that the the specific star formation rate (sSFR, defined as the ratio between SFR and ) of a galaxy is closely related to its color, it is not surprising that the general trends seen in this plot are similar to those shown in Fig. 3. Low-mass centrals are dominated by star forming galaxies in halos of low but become dominated by quenched galaxies at the high end of . A reversal of trend is again seen at .
Finally, let us look at the gas phase metallicity of galaxies, which is shown as a function of in Figure 5. The gas phase metallicity estimates are available only for a limited fraction of galaxies, mostly star forming ones. The result for the highest stellar mass bin is quite noisy because here only a small fraction of galaxies are star forming. For a given stellar mass, there is a clear trend that the gas phase metallicity decreases with increasing . For centrals with , the decrease with is quite rapid, by almost 0.1 dex. This decrease is comparable to the scatter in the gas phase metallicity - stellar mass relation obtained by Tremonti et al. (2004), suggesting that the scatter may be dominated by the variance in halo assembly, with galaxies formed in older dark matter halos tend to have lower gas-phase metallicities.
4.1.2 Structure and size
The bulge to total ratio, , as described in the data section, is plotted against in Figure 6. There are a number of interesting trends. Overall, the increases with stellar mass, simply owing to the fact that earlier type galaxies are on average more massive. For massive galaxies with higher than about , the ratio on average decreases with . For galaxies with lower stellar masses, the trend changes at . While the ratio decreases with increasing at the low end, it increases with rapidly at .
As mentioned above, for a given central mass , a lower on average corresponds to a higher halo mass . Since a higher halo mass on average corresponds to a higher group richness, the decline of with may, therefore, be understood in terms of the morphology-density relation found by Dressler (1980) that early-type galaxies (higher ) are preferentially found in high density environments, while late-type galaxies are more likely to be found in poor groups and in the lower density fields. The increase of with decreasing at the low end shown in Fig. 6 follows such a morphology-density relation. However, our results also contain new information, in that the morphology-density relation is present even for centrals of a given stellar mass.
The strong increase of with increasing seen for low-mass central galaxies with at runs against the morphology-density relation. Since larger means an earlier assembly time, as shown in the last section, the trend of with indicates an dependence on halo assembly time, in that central galaxies in older halos tend to have higher . In the current CDM paradigm of structure formation, the formation of halos of a given mass at earlier time is on average more dominated by major mergers and older halos are on average more compact (e.g. Li et al., 2007; Zhao et al., 2009). If the bulge components are formed through major mergers or through secular evolutions of the disk components, their formation is expected to be promoted by both major mergers and a compact structure of dark matter halos. The positive correlation between and obtained here may follow directly from such formation. The reversal of the trend at is also consistent with such interpretation, because central galaxies in massive halos actually have earlier formation due to the down-sizing effect described above.
Figures 7 and 8 show how the sizes of central galaxies of a given stellar mass correlate with . Results are shown separately for the half-light radius () of ellipticals and the disk scale-length () of spiral galaxies. Here the morphological separation is made according to the visual classification from GZ2, and the sizes are taken from the -band bulge-disk decompositions of Simard et al. (2011). For both ellipticals and spirals, more massive galaxies are larger, as expected. For a given stellar mass, the sizes of centrals decrease with at . This is consistent with the interpretation that halos formed earlier on average are smaller. However, unlike star formation, there is no strong reversal of trend at , in particular for massive galaxies. For elliptical galaxies, this may be due to the fact that the assembly of the stellar component follows halo assembly more closely than star formation (e.g. figure 5 in Lu et al., 2015). For spiral galaxies, this result may indicate that disks can continue to accrete cold gas from halos as the halos grow, even in relatively massive systems.
4.2 Satellite galaxies
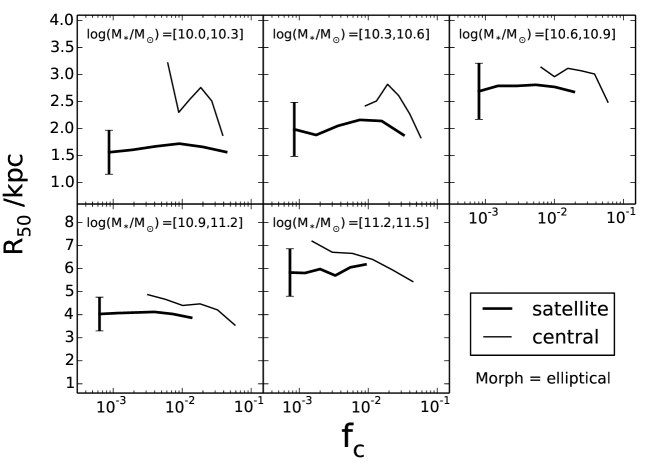
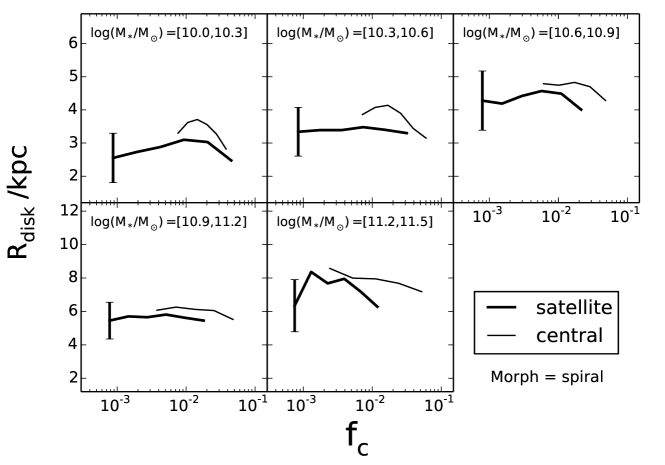
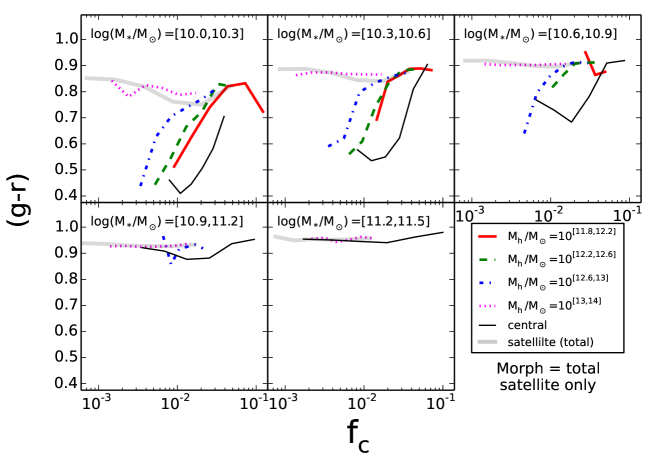
Figure 9 shows the color of satellite galaxies as a function of of their host groups. The five panels show the results of galaxies in five stellar mass bins, as indicated. For each stellar mass bin, results are shown separately for galaxies in groups of four different halo mass bins, as indicated in the small panel. For given and halo mass, more massive galaxies on average are redder. For the most massive galaxies with , which are only found in massive halos, their colors are all red, quite independent of . For satellites with lower stellar masses (), there is a marked trend that the color becomes increasingly redder as increases. The trend is weaker for groups with higher halo masses, and becomes almost totally flat for halo masses above (the magenta dotted curve in each panel). We do not see a reversal in the trend in any ranges of as seen in central galaxies shown in Fig. 3 (reproduced here as the black solid curves for comparison), because here results are shown separately for groups in different halo mass bins. If we consider all satellites of a given stellar mass regardless of their host halo mass, then we get the results as shown by the thick shaded line in each panel. Here we do see a change of trend at , which is similar to, albeit weaker than that for central galaxies. Clearly, satellites at the low- end are dominated by the ones in massive groups. The reversed trend at , is consistent with the fact that galaxies in massive halos actually have earlier formation due to the down-sizing effect described earlier.
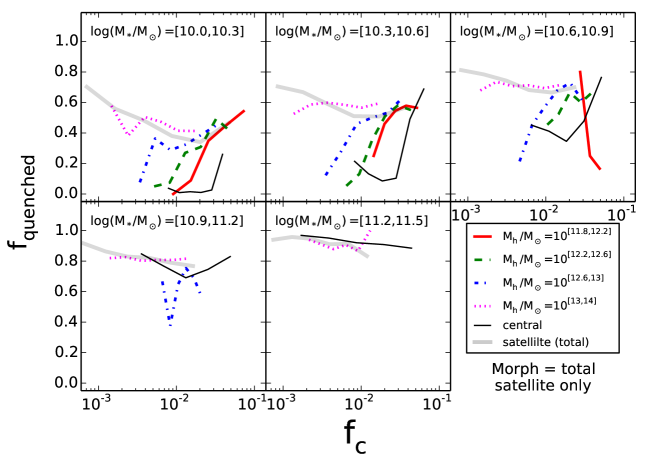
Figure 10 shows the quenched fraction of satellites as a function of of their host groups. The format of this figure is exactly the same as Fig. 9, and the quenched fraction is again determined by using equation (2). The trends shown here are very similar to those in Fig. 9, again because the color is closely correlated with the sSFR used to separate quenched from star-forming galaxies.
Finally let us look at the sizes of galaxies. Here we consider ellipticals and spirals separately. Our tests showed that the dependence of size on halo mass is weak for satellites and the current samples are too small to give significant results for the halo-mass dependence. Thus, we only divide galaxies into stellar mass bins, but not further into halo mass bins. Figures 11 and 12 show how the sizes of satellite galaxies of a given stellar mass correlate with (thick solid curves). Here results are shown separately for the half-light radius () of ellipticals and the disk scale-length () of spiral galaxies, both taken from the -band bulge-disk decompositions of Simard et al. (2011). For both ellipticals and spirals, the trend with is rather weak, although for low-mass galaxies the size seems to decrease as one moves away from toward both the low and high ends of . This trend suggests that galaxies of a given stellar mass on average have smaller sizes if formed earlier.
Compared with central galaxies of the same stellar mass (shown by the thin curves), satellites are smaller. This is true for both spirals and ellipticals, and the difference is larger for lower mass galaxies. It is interesting to note that the average sizes of satellites are comparable to those of centrals with the highest , which indicates that sub-halos which host satellites may have as early formation as the oldest halos of similar masses that host centrals.
Weinmann et al. (2009) found that, at fixed stellar mass, late-type satellite galaxies have smaller radii than late-type central galaxies. Our results confirm theirs. However, Weinmann et al. (2009) found no difference in size for early-type galaxies, while Fig. 11 shows clearly that such difference also exists for ellipticals, particularly for ellipticals with low stellar masses. The discrepancy may arise from the difference in the separation of early versus late types. While Weinmann et al. (2009) used the concentration parameter, defined as the ratio between (radius within which of the total light is included) and , we use morphological classifications from GZ2. Weinmann et al. (2009) interpreted their finding as owing to the fading of stellar disks due to the aging of stars. However, it is unclear if such an interpretation can also explain the systematic change of disk size of central galaxies with . Passive stellar evolution alone is also difficult to explain the difference between centrals and satellites for elliptical galaxies. Based on our results, the more likely reason is that halos formed earlier are more compact, and that the difference in sizes between centrals and satellites is due to differences in formation time, just as centrals in halos of different .
5 Comparison with Models
In order to explore the implications of our findings, we make comparisons of our results with some theoretical models. Since our results are derived from galaxy groups selected from a redshift catalogue, a detailed comparison between our observational results with theoretical models requires the construction of theoretical mock catalogs that take into account all observational selection effects. This is beyond the scope of this paper, and we will come back to this in a forthcoming paper. In this paper, we use halo occupations of galaxies predicted directly by models, ignoring all observational selection effects. As a demonstration, we use two specific models: the empirical age abundance matching (AAM) model published in Hearin & Watson (2013); Hearin et al. (2014), and the semi-analytical model (SAM) as described in Lu et al. (2014a).
While traditional abundance matching techniques only exploit the correlation between luminosity of galaxies and mass of their host haloes to assign galaxies in haloes from simulations, the AAM connects galaxies to haloes as a function of both color and luminosity. Specifically, it assigns stellar masses to galaxies according to the mass ranking of their host halos, and assign colors to galaxies of a given stellar mass according to the formation time ranking of their halos. The SAM approach, on the other hand, attempts to model physical processes using simplified receipts parameterized in simple functional forms. A SAM generally contains a large number of free parameters. Lu et al. (2014a) used a Monte Carlo Markov Chain method to infer their model parameters from observational constraints such as luminosity functions of galaxies at different redshifts. The Lu et al. SAM contains many of the same components as other SAMs. In particular it assumes a strong star formation feedback and an efficient gas stripping to prevent too much star formation in dark matter halos.
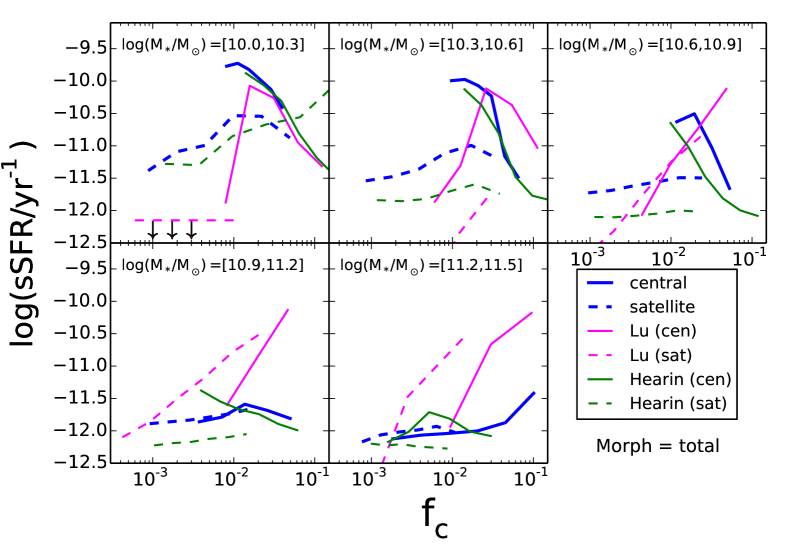
Since none of the models provides reliable predictions for the structural properties of galaxies, here we focus only on the star formation properties as represented by the specific star formation rate (sSFR) of galaxies. Figure 13 shows the sSFR as a function of as predicted by the models of Hearin & Watson (2013) and Lu et al. (2014a). As in the observation, we identify the most massive galaxy in a halo to be the central galaxy, and use the ratio between and the halo mass to define . Here results are shown separately for centrals and satellites in five different stellar mass bins. For comparison, our observational results are included in each panel. As one can see, the AAM model reproduces the observational trends qualitatively. In particular, the rapid decreases of sSFR with increasing for central galaxies in the low stellar mass bins are well reproduced. The trends for satellite galaxies are also well produced, although the predicted sSFR are systematically lower than the observational results. This discrepancy should not be taken too seriously, as the satellite population in observational groups may be contaminated by centrals that on average have higher SFR than the satellites of the same mass. As mentioned above, such contaminations can only be taken into account properly by applying the same group finder to the mock catalog constructed from the AAM model.
In contrast, the predictions of the SAM are very different from the observational results. The model predicts too much quenching of star formation in low mass satellites, while the star formation rates in centrals, particularly in groups with high , are over-predicted by more than an order of magnitude. The SAM also fails to catch the overall trends in the observation, even qualitatively. These results suggest that the halo assembly plays an important role in regulating star formation, and the underlying physical processes are still poorly captured in the SAM considered here. It is clearly interesting to compare our results with other SAMs and simulation results, not only in sSFR, but also in other properties, such as size, , and metallicity, to explore the implications of our results.
6 Summary
We have showed that the ratio, , can be used as a reliable observational proxy of halo assembly time, with higher for halos that assembled earlier. This use was motivated by the results of W11, who used N-body simulations to show that there is a tight correlation between ( being the main sub-halo mass) and halo half-mass assembly redshift (), combined with (sub)halo abundance matching. We used the SDSS groups by Yang et al. to investigate how galaxy properties are correlated with the assembly times of their host halos.
Central galaxies of a given stellar mass with higher are found to be redder and more quenched in star formation while . This implies that star formation in centrals in this regime is dictated by their halo assembly history. A reversed albeit weak trend is seen for centrals with , which reflects the down-sizing effect that a more massive halo on average reaches the mass of most efficient in situ star formation, , earlier. Similar trends with are found for the bulge to total ratio, : central galaxies hosted by older halos tend to have higher ratios. We suggest that this is because older halos are more compact and their formation is more dominated by major mergers. For a given stellar mass, the sizes of central galaxies are also correlated with for both ellipticals (in terms of the half-light radius, ) and spirals (in terms of the disk scale-length, ), with centrals hosted by older halos being smaller. This trend is again consistent with the fact that halos of a given mass are more compact at higher redshifts.
We have also analyzed how the intrinsic properties of satellite galaxies change with the value of of their host halos. Here we found that, for a given stellar mass, satellites residing in older halos are redder and more quenched, and this trend is stronger for lower mass halos. Satellites also appear smaller than centrals of the same mass, and this is true for both ellipticals and spirals. These results can again be explained by the fact that halos that assembled earlier are more compact. As for centrals, a weak down-sizing effect in the quenching of star formation is also seen for satellites hosted by massive halos with . These results, together with those found for the centrals, demonstrate clearly that halo assembly plays an important role in determining the properties of galaxies the halos host.
We present our preliminary comparisons of our observational results with the predictions by the AAM model of Hearin & Watson (2013) and by the SAM of Lu et al. (2014a). The AAM model reproduces well the general trends in the observational data, while the SAM fails to do so. The SAM predicts too many quenched low-mass satellites and too small fraction of quenched high-mass galaxies. These imply that halo assembly history is another important factor in addition to halo mass that can affect star formation in galaxies, and such effects have yet to be properly modeled in the SAM. In this context, the observational results obtained here are expected to provide stringent constraints on theoretical models of galaxy formation and evolution. We will come back to detailed comparison between our observational results and model predictions in a forthcoming paper.
Acknowledgments
We thank Andrew Hearin for help in using his mock catalog, Yu Lu for using his semi-analytical data, and Zhankui Lu for helpful discussion and the anonymous referee for helpful comments that greatly improved the presentation of this paper. HJM acknowledges the support from NSF AST-1109354. This work is also supported by the 973 Program (Nos. 2015CB857002,2015CB857005).
References
- Abazajian et al. (2009) Abazajian K. N. et al., 2009, ApJS, 182, 543
- Behroozi et al. (2010) Behroozi P. S., Conroy C., Wechsler R. H., 2010, ApJ, 717, 379
- Behroozi et al. (2013) Behroozi P. S. et al., 2013, ApJ, 763, 18
- Berlind & Weinberg (2002) Berlind A. A., Weinberg D. H., 2002, ApJ, 575, 587
- Blanton et al. (2005) Blanton M. R. et al., 2005, AJ, 129, 2562
- Brinchmann et al. (2004) Brinchmann J., Charlot S., White S. D. M., Tremonti C., Kauffmann G., Heckman T., Brinkmann J., 2004, MNRAS, 351, 1151
- Choi et al. (2010) Choi Y. Y., Han D. H., Kim S. S., 2010, Journal of Korean Astronomical Society, 43, 191
- Colless et al. (2001) Colless M. et al., 2001, MNRAS, 328, 1039
- Conroy & Wechsler (2009) Conroy C., Wechsler R. H., 2009, ApJ, 696, 620
- Dressler (1980) Dressler A., 1980, ApJ, 236, 351
- Gallazzi et al. (2005) Gallazzi A., Charlot S., Brinchmann J., White S. D. M., Tremonti C., 2005, MNRAS, 362, 41
- Guo et al. (2010) Guo Q., White S. D. M., Li C., Boylan-Kolchin M., 2010, MNRAS, 404, 1111
- Hearin & Watson (2013) Hearin A. P., Watson D. F., 2013, MNRAS, 435, 1313
- Hearin et al. (2014) Hearin A. P., Watson D. F., Becker M. R., Reyes R., Berlind A. A., Zentner A. R., 2014, MNRAS, 444, 729
- Jing et al. (1998) Jing Y. P., Mo H. J., Brner G., 1998, ApJ, 494, 1
- Kang et al. (2005) Kang X., Jing Y. P., Mo H. J., Brner G., 2005, ApJ, 631, 21
- Kauffmann et al. (2003) Kauffmann G. et al., 2003, MNRAS, 341, 33
- Klypin et al. (2011) Klypin A. A., Trujillo-Gomez S., Primack J., 2011, ApJ, 740, 102
- Kravtsov et al. (2004) Kravtsov A. V., Berlind A. A., Wechsler R. H., Klypin A. A., Gottlber S., Allgood B., Primack J. R., 2004, ApJ, 609, 35
- Kravtsov (2013) Kravtsov A. V., 2013, ApJL, 764, L31
- Leauthaud et al. (2012) Leauthaud A. et al., 2012, ApJ, 744, 159
- Li et al. (2007) Li Y., Mo H. J., van den Bosch F.C., Lin W. P., 2007, MNRAS, 379, 689
- Li et al. (2008) Li Y., Mo H. J., Gao L., 2008, MNRAS, 389, 1419
- Lu et al. (2014a) Lu Y., Mo H. J., Lu Z., Katz N., Weinberg M. D., 2014a, MNRAS, 443, 1252
- Lu et al. (2014b) Lu Z., Mo H. J., Lu Y., Katz N., Weinberg M. D., van den Bosch F. C., Yang X., 2014b, MNRAS, 439, 1294
- Lu et al. (2015) Lu Z., Mo H. J., Lu Y., 2015, MNRAS, in press (arXiv:1408.2640)
- Mo et al. (1999) Mo H. J., Mao S., White S. D. M., 1999, MNRAS, 304, 175
- Mo et al. (2010) Mo H. J., van den Bosch F. C., White S. D. M., 2010, Galaxy Formation and Evolution. Cambridge University Press, New York, NY
- Moustakas et al. (2013) Moustakas J. et al., 2013, ApJ, 767, 50
- Neistein et al. (2010) Neistein E., Weinmann S. M., Li C., Boylan-Kolchin M., 2010, ArXiv:1011.2492
- Peacock & Smith (2000) Peacock J. A., Smith R. E., 2000, MNRAS, 318, 1144
- Scoccimarro et al. (2001) Scoccimarro R., Sheth R. K., Hui L., Jain B., 2001, ApJ, 546, 20
- Seljak (2000) Seljak U., 2000, MNRAS, 318, 203
- Simard et al. (2011) Simard L., Mendel J. T., Patton D. R., Ellison S. L., McConnachie A. W., 2011, ApJS, 196, 11
- Tinker et al. (2008) Tinker J. L., Kravtsov A. V., Klypin A., Abazajian K., Warren M. S., Yepes G., Gottlober S., Holz D. E., 2008, ApJ, 688, 709
- Tremonti et al. (2004) Tremonti C. et al., 2004, ApJ, 613, 898
- Vale & Ostriker (2004) Vale A., Ostriker J. P., 2004, MNRAS, 353, 189
- Vale & Ostriker (2006) Vale A., Ostriker J. P., 2006, MNRAS, 371, 1173
- van den Bosch et al. (2003) van den Bosch F. C., Yang X., Mo H. J., 2003, MNRAS, 340, 771
- van den Bosch et al. (2007) van den Bosch F. C., Yang X., Mo H. J., Weinmann S. M., Macci A. V., More S., Cacciato M., Skibba R., Kang X., 2007, MNRAS, 376, 841
- Wang et al. (2009) Wang H., Mo H. J., Guo Y., van den Bosch F. C., Yang X., 2009, MNRAS, 394, 398
- Wang et al. (2011) Wang H., Mo H. J., Jing Y. P., Yang X., Wang Y., 2011, MNRAS, 413, 1973
- Wang et al. (2012) Wang H., Mo H. J., Yang X., van den Bosch F. C., 2012, MNRAS, 420, 1809
- Watson et al. (2012) Watson D. F., Berlind A. A., McBride C. K., Hogg D. W., Jiang T., 2012, ApJ, 749, 83
- Watson et al. (2015) Watson D. F., Hearin A. P., Berlind A. A., Becker M. R., Behroozi P. S., Skibba R. A., Reyes R., Zentner A. R., van den Bosch F. C., 2015, MNRAS, 446, 651
- Weinmann et al. (2009) Weinmann S. M., Kauffmann, G., van den Bosch F. C., Pasquali A., McIntosh D. H., Mo H. J., Yang X., Guo Y., 2009, MNRAS, 394, 1213
- Willett et al. (2013) Willett K. W. et al., 2013, MNRAS, 435, 2835
- Yang et al. (2003) Yang X., Mo H. J., van den Bosch F. C., 2003, MNRAS, 339, 1057
- Yang et al. (2004) Yang X., Mo H. J., Jing Y. P., van den Bosch F. C., Chu Y. Q., 2004, MNRAS, 350, 1153
- Yang et al. (2005) Yang X., Mo H. J., van den Bosch F. C., Jing Y. P., 2005, MNRAS, 356, 1293
- Yang et al. (2007) Yang X., Mo H. J., van den Bosch F. C., Pasquali A., Li C., Barden M., 2007, ApJ, 671, 153
- Yang et al. (2012) Yang X., Mo H. J., van den Bosch F. C., Zhang Y., Han J., 2012, ApJ, 752, 41
- Zhao et al. (2009) Zhao D. H., Jing Y.P., Mo H.J., Börner G., 2009, ApJ, 707, 354
- Zheng et al. (2007) Zheng Z., Coil A. L., Zehavi I., 2007, ApJ, 667, 760