Current address: ]Department of Condensed Matter Physics and Material Science, Brookhaven National Laboratory, Upton, NY 11973, USA
Anomalous pressure dependence of magnetic ordering temperature in Tb to 141 GPa: comparison with Gd and Dy
Abstract
In previous studies the pressure dependence of the magnetic ordering temperature of Dy was found to exhibit a sharp increase above its volume collapse pressure of 73 GPa, appearing to reach temperatures well above ambient at 157 GPa. In a search for a second such lanthanide, electrical resistivity measurements were carried out on neighboring Tb to 141 GPa over the temperature range 3.8 - 295 K. Below Tb’s volume collapse pressure of 53 GPa, the pressure dependence mirrors that of both Dy and Gd. However, at higher pressures for Tb becomes highly anomalous. This result, together with the very strong suppression of superconductivity by dilute Tb ions in Y, suggests that extreme pressure transports Tb into an unconventional magnetic state with an anomalously high magnetic ordering temperature.
I Introduction
The magnetic ordering temperatures of Gd and Dy have been recently shown to track each other in a highly non-monotonic fashion as a function of pressure to GPa; at higher pressures they deviate markedly, for Dy rising rapidly to temperatures well above ambient at 157 GPa.lim0 Parallel experiments on dilute magnetic alloys of Gd and Dy with superconducting Y suggest that for pressures above GPa Dy is transformed from a magnetically conventional lanthanide into one with an unconventional magnetic state with marked deviations from de Gennes scaling,degennes a state perhaps governed by Kondo physics, indicating that the Dy ion is nearing a magnetic instability.lim0 An alternate explanation is that the strong enhancement of in Dy arises through changes in the crystalline electric field at extreme pressure.lim0 Analogous studies on additional lanthanides are recommended to help identify the origin of this anomalous behavior.
The lanthanide Tb, which lies between Gd and Dy in the periodic table, has one fewer 4 electron than Dy, and is probably less stable magnetically than Dy due to its direct proximity to Gd, by far the most stable of all magnetic lanthanides. Tb orders antiferromagnetically (AFM) at 230 K followed by a ferromagnetic (FM) transition at 220 K.koehler1 Both transition temperatures initially decrease rapidly with pressure at the rate -10 to -12 K/GPa, but above GPa neither transition can be clearly detected in either the ac or dc magnetic susceptibility.mcwhan ; jackson1 ; mito The disappearance of the ordered moment in the susceptibility measurement indicates a transition to either an AFM or paramagnetic state above 7 GPa. Electrical resistivity studies should reveal which scenario is correct since both FM and AFM order normally lead to a distinct kink in the temperature dependence of the resistivity. However, recent resistivity and neutron diffraction experiments on Tb find that the FM transition decreases with pressure at the rate -16.7 K/GPa to 3.6 GPa;thomas that the transition could no longer be resolved above 3.6 GPa may be due to appreciable pressure-gradient broadening in the cell which contained no pressure medium. That magnetic order in Tb disappears above 7 GPa seems highly unlikely since both x-ray absorption near-edge structure (XANES) and non-resonant x-ray emission spectroscopy (XES) measurements detect no change in Tb’s valence to 65 GPa and 70 GPa, respectively.fabbris1 In fact, the XES studies show that Tb retains its strong, highly localized magnetic moment () to at least 70 GPa.fabbris1
In this paper we present the results of dc electrical resistivity measurements on Tb over the temperature range 3.8 - 295 K to pressures as high as 141 GPa, well above the pressure of 53 GPa where Tb suffers a 5% volume collapse at the phase transition from hexagonal hR24 to body-centered monoclinic (bcm).cunningham Magnetic order is indeed observed in Tb for pressures above 7 GPa. In fact, to 53 GPa follows nearly the same highly non-monotonic pressure dependence found earlier in Gd and Dy,lim0 but deviates markedly at higher pressures. As the applied pressure passes through 53 GPa, for Tb first decreases, but then begins to increase rapidly above 80 GPa. As suggested for Dy,lim0 extreme pressure appears to transport Tb into an unconventional magnetic state with an anomalously high magnetic ordering temperature, well above that anticipated from conventional de Gennes scaling.
II Experimental Techniques
Resistivity samples were cut from a Tb ingot (99.9% pure, Material Preparation Center of the Ames Laboratoryames ). To generate pressures well beyond the volume collapse pressure of Tb at 53 GPa, a diamond anvil cell (DAC) made of CuBe alloy was used.Schilling84 Two separate high-pressure experiments were carried out where pressure was generated by two opposing diamond anvils (1/6-carat, type Ia) with 0.35 mm diameter culets beveled at 7∘ to 0.18 mm central flats.
The Re gasket (6 - 7 mm diameter, 250 m thick) was preindented to 30 m and a 80 m diameter hole electro-spark drilled through the center. The center section of the preindented gasket surface was filled with a 4:1 cBN-epoxy mixture to insulate the gasket and serve as pressure medium. The thin Tb sample was then placed on top of four thin (4 m) Pt leads for a four-point dc electrical resistivity measurement. In an attempt to minimize the effect of the pressure gradient across the sample in this non-hydrostatic pressure environment, in run 1 an elongated sample (dimensions 8803 m3) was used with the two voltage leads spaced only 5 m apart (see inset to Fig. 1(a)). In run 2 all four Pt leads were placed near the corners of the square-shaped sample (dimensions 30305 m) (see inset to Fig. 1(b)), as in the previous resistivity measurements on Dy.lim0 However, from the temperature-dependent resistivity data the pressure gradient was estimated to be approximately the same in both runs. Further details of the non-hydrostatic high pressure resistivity technique are given in a paper by Shimizu et al.Shimizu05
A He-gas driven membrane was utilized to change pressure at any temperature.daniels1 The value of the pressure was determined using both the fluorescenceChijioke05 from a small ruby sphere positioned at the edge of the sample and the frequency shift of the diamond vibron via Raman spectroscopy.raman1 The ruby pressure was determined at both ambient temperature and a temperature within 20 K of ; the vibron pressure was determined only at ambient temperature. The values of the pressure given are averaged over the sample to an estimated accuracy of In these experiments temperatures from 3.8 K to 295 K were available using an Oxford flow cryostat. All measurements shown in this paper were carried out with increasing pressure; diamond anvil failure at the highest pressure ended the experiment. Further experimental details of the DAC and cryostat are given elsewhere.fabbris1 ; Schilling84 ; klotz1 ; debessai1
III Results of Experiment
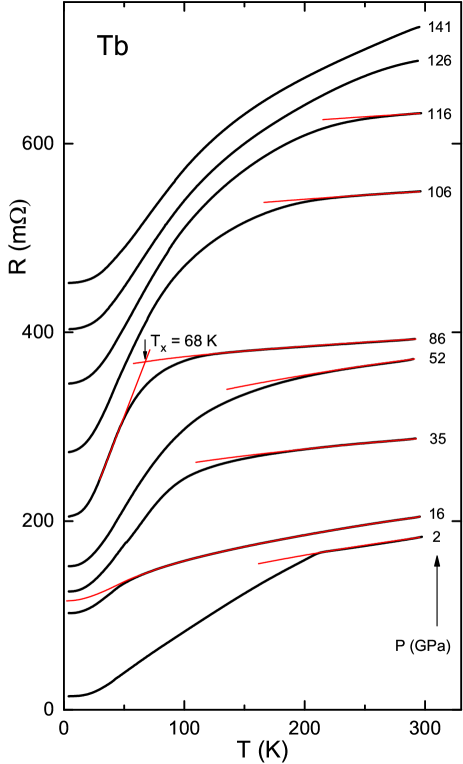
The present resistivity studies on Tb were carried out in two separate experiments. In Fig. 1(a) the electrical resistance from run 1 is plotted versus temperature at 18 different pressures to 135 GPa. The results from run 2 are shown in Fig. 1(b) and span the pressure range 2 - 141 GPa with 17 values. The onset of magnetic ordering is identified by the kink in the dependence clearly seen near 200 K at 2 GPa, the lowest pressure in each run. The kink in upon cooling marks the beginning of the suppression of spin-disorder scattering as magnetic ordering sets in.ref3 At higher pressures this kink broadens somewhat into a ”knee” due to an increasing pressure gradient across the sample, but remains clearly visible to 115 GPa.
In Fig. 2 selected data from Fig. 1(b) are replotted but shifted vertically for clarity so that no curves intersect. In this graph the red line through the data above the knee gives the phonon contribution to the total measured resistance estimated in the same manner as in our previous work on Dy,lim0 as outlined in the next paragraph. The paramagnetic state of Tb yields the relatively flat region of at higher temperature where the red (phonon) line overlaps the data. Where the red line begins to separate from the data marks the onset of magnetic ordering in some region of the sample. Because of the pressure gradient across the sample, other regions of the sample will have a lower onset temperature, thus broadening the kink into a knee. The intersection of the phonon resistance (red curve) with the red low-temperature tangent curve defines the temperature in Fig. 2.
The total measured resistance is the sum of three terms, where is the temperature-independent defect resistance, the temperature-dependent phonon resistance, and the temperature-dependent spin-disorder resistance. At temperatures where there is no magnetic ordering in the sample, is independent of temperature. Above the onset temperature of the knee, the temperature dependence of is, therefore, due solely to that of The temperature dependence of the phonon resistance is visible over the widest temperature range at that pressure (16 GPa in Fig. 2) where the knee begins at the lowest temperature. We extrapolate this dependence to 0 K in the temperature region below the knee to yield the temperature-dependent function , the estimated phonon resistance at 16 GPa in run 2. In run 1 the data at 18 GPa were used in the same way to obtain . Since the functional dependence of on temperatures above is seen in Fig. 2 to change only slowly with pressure, we estimate for the other pressures in run 2 by simply multiplying the function by a ”phonon factor” chosen such that for temperatures above the knee the quantity becomes temperature independent for . The values of required are listed in Table 1 at all pressures in run 2 to 141 GPa. For pressures of 120 GPa and above, the knee in apparently begins above 295 K, so that can no longer be estimated directly from the resistance data. For GPa, therefore, the value is assumed in Table 1 for run 2 and in run 1. This is admittedly an oversimplified way to estimate the phonon contribution, but is superior to the assumption made in an earlier study that for many lanthanides is simply a linear function of temperature to 0 K.colvin1
In Fig. 3 the extracted spin-disorder resistance is plotted for pressures 5, 35, and 86 GPa in run 2. The saturation (maximum) value of the so obtained spin-disorder resistance in the paramagnetic phase at each pressure is listed in Table 1 for run 2. At 86 GPa, for example, m as seen in Fig. 3. A similar procedure was used to obtain in run 1.
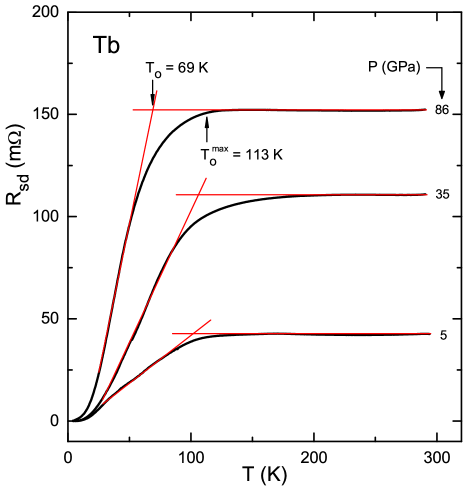
As illustrated in Fig. 3, the average magnetic ordering temperature in the Tb sample is estimated from the point of intersection of two straight (red) lines, a horizontal line for temperatures above the onset of the knee, and a line tangent to at lower temperatures. For 86 GPa it is seen that K. This temperature differs by only 1 K from K, the intersection point of the phonon resistance and the low-temperature tangent lines in Fig. 2 at the same pressure. Here we regard to be the average magnetic ordering temperature (in our previous paper on Dy, was used as the ordering temperaturelim0 ). Since the pressure gradient leads to a variation in the value of the magnetic ordering temperature across the sample, we define the “maximum”ordering temperature as the temperature at which the spin-disorder resistance has decreased by 1%. In Fig. 3 it is seen that K at 86 GPa. If gives the value of the magnetic ordering temperature at the center of the cell (sample) where the pressure is highest. In Fig. 3 it is seen that lies 44 K higher than at 86 GPa. All values of and in run 2 are listed in Table 1.
In Fig. 4 and are plotted versus pressure to 141 GPa for runs 1 and 2 on Tb; values for GPa are estimated using a procedure from Ref. lim0, , as outlined below. Where they can be compared, the present results are in reasonable agreement with earlier ac magnetic susceptibility measurements of Jackson et al. to 6.3 GPa.jackson1 The pressure dependence at higher pressures is seen to be highly non-monotonic, presumably in response to multiple structural phase transitionscunningham (see top of the graph). Note that the phase boundaries were determined from x-ray diffraction studies at ambient temperature and may shift somewhat as the temperature is lowered.
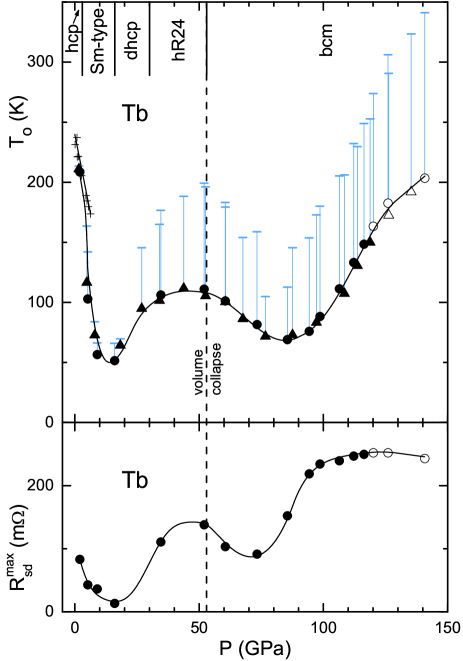
A comparison of for Tb from Fig. 4 to comparable graphs for Gd and Dy in Ref. lim0, reveals a remarkable similarity to 53 GPa, the pressure at which the 5% volume collapse in Tb occurs.cunningham Also plotted in Fig. 4 are the values of for Tb given by the upper error bars connected to the values of at each pressure by a light (blue) vertical line. Particularly intriguing is the decrease in following the hR24 to body-centered monoclinic (bcm) transition at 53 GPa,cunningham followed by a rapid increase above 80 GPa. In contrast to the findings for GPa, at higher pressures for Tb thus differs significantly from that found earlier for either Gd or Dy.lim0 Plotted versus relative volume , the increase of above 80 GPa for Tb is found to be much more rapid than the initial decrease of to 6.3 GPa. A similar result was found for Dy.lim0 Extrapolating versus for Tb linearly to (141 GPa), yields the values 250 K and K.
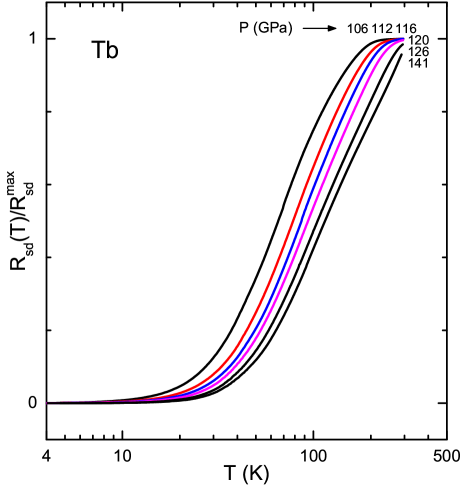
We now attempt a more quantitative estimate of the pressure dependence of , , and in the pressure range above GPa where the onset of the knee appears to lie at or above ambient temperature. We first consider the spin-disorder resistance at pressures GPa. The first step is to normalize to its value at 295 K, yielding the relative spin-disorder resistance plotted versus for data at 106, 112, and 116 GPa in Fig. 5. Since at the higher pressures of 120, 126, and 141 GPa the onset of magnetic ordering appears to lie above the temperature range of the present experiments (295 K), one cannot determine the value of in the paramagnetic phase, nor or directly from the resistance data. However, noticing that over much of the temperature range the curves for 106, 112, and 116 GPa are approximately parallel on the plot in Fig. 5, we divide the data for GPa by that factor which results in curves parallel to those at the lower pressures, as seen in Fig. 5. We identify this factor as the value of the temperature-independent spin-disorder resistance in the paramagnetic phase, as listed in Table 1. This procedure is tantamount to assuming that for GPa. The change in the value of the magnetic ordering temperatures and can now be estimated from the shift of the curves along the axis. The resulting values of and are given in Table 1 and in Fig. 4 for all pressures in runs 1 and 2 as the open triangles and circles, respectively. From this analysis we infer that from 116 to 141 GPa the average magnetic ordering temperature has increased from 148 K to 203 K and the maximum ordering temperature from 249 K to 341 K, values close to those obtained in the linear extrapolation above.
In our previous work on Dy the spin-disorder resistance in the paramagnetic state was found to approximately track the magnetic ordering temperature as a function of pressure. This same result is seen in Fig. 4 to hold for Tb.
IV Discussion
We now seek to identify the mechanism(s) responsible for the highly non-monotonic dependence of Tb’s magnetic ordering temperature on pressure. First we focus on the pressure region below GPa, the pressure at which Tb suffers a 5% volume collapse. Since the pressure dependence of is so similar for Tb, Gd and Dy in this pressure range, a common mechanism seems likely.
For a conventional lanthanide metal with a stable magnetic moment, the magnetic ordering temperature is expected to scale with the de Gennes factor , modulated by the prefactor , where is the exchange interaction between the 4 ion and the conduction electrons, the density of states at the Fermi energy, the Landé- factor, and the total angular momentum quantum number.degennes Since the de Gennes factor is constant under pressure, unless the magnetic state becomes unstable and/or a valence transition occurs, the marked similarity between the highly non-monotonic pressure dependences of for Tb, Dy and Gd to 53 GPa likely originates in the pressure dependence of the prefactor , facilitated by a series of nearly identical structural phase transitions in Tb,cunningham Dy,patterson1 and Gd.gd ; erran These phase transitions are likely driven by increasing 5d-electron occupation with pressure.pettifor Indeed, electronic structure calculations for Dy suggest that its large negative initial pressure derivative K/GPa results from a strong decrease in .jackson1 ; fleming
| run | (GPa) | (K) | (K) | m | |
|---|---|---|---|---|---|
| 1 | 2 | 211 | 214 | 881 | 1.16 |
| 1 | 5 | 117 | 163 | 523 | 1.24 |
| 1 | 8 | 73 | 84 | 380 | 1.24 |
| 1 | 18 | 64 | 70 | 154 | 1.0 |
| 1 | 27 | 95 | 145 | 513 | 0.66 |
| 1 | 34 | 101 | 165 | 721 | 0.72 |
| 1 | 44 | 112 | 188 | 769 | 1.02 |
| 1 | 53 | 105 | 196 | 746 | 1.11 |
| 1 | 61 | 101 | 179 | 518 | 1.05 |
| 1 | 68 | 86 | 154 | 479 | 0.89 |
| 1 | 77 | 72 | 105 | 469 | 0.74 |
| 1 | 88 | 73 | 145 | 1001 | 0.69 |
| 1 | 97 | 83 | 173 | 1140 | 0.69 |
| 1 | 109 | 107 | 206 | 1165 | 0.69 |
| 1 | 114 | 131 | 230 | 1189 | 0.69 |
| 1 | 119 | 150 | 253 | 1201 | 0.69 |
| 1 | 126 | 172 | 291 | 1211 | 0.69 |
| 1 | 135 | 192 | 323 | 1214 | 0.69 |
| 2 | 2 | 208 | 210 | 83 | 0.98 |
| 2 | 5 | 103 | 142 | 43 | 0.98 |
| 2 | 9 | 57 | 66 | 36 | 0.98 |
| 2 | 16 | 52 | 66 | 13 | 1.0 |
| 2 | 35 | 106 | 177 | 111 | 0.58 |
| 2 | 52 | 111 | 199 | 138 | 0.92 |
| 2 | 61 | 101 | 183 | 103 | 0.79 |
| 2 | 73 | 82 | 159 | 91 | 0.56 |
| 2 | 86 | 69 | 113 | 152 | 0.41 |
| 2 | 94 | 76 | 154 | 219 | 0.41 |
| 2 | 99 | 88 | 180 | 234 | 0.41 |
| 2 | 106 | 111 | 205 | 239 | 0.41 |
| 2 | 112 | 133 | 232 | 247 | 0.41 |
| 2 | 116 | 148 | 249 | 250 | 0.41 |
| 2 | 120 | 163 | 274 | 252 | 0.41 |
| 2 | 126 | 183 | 306 | 252 | 0.41 |
| 2 | 141 | 203 | 341 | 243 | 0.41 |
We now consider the pressure region 53 GPa where the pressure dependence for Tb is highly anomalous, deviating markedly from that of the model conventional lanthanide Gd to at least 127 GPa.lim0 The absence of magnetic instabilities in Gd, even at extreme pressures, is expected since the local magnetic state of Gd with its half-filled 4 shell is the most stable of all elements, its 4 level lying eV below the Fermi level.yin Why is in Tb anomalous for 53 GPa? A long-standing strategymatthias ; maple2 to probe the magnetic state of a given ion is to alloy this ion in dilute concentration with a host superconductor and determine , the degree of suppression of the host’s superconducting transition temperature. Yttrium (Y) is the ideal host superconductor for Tb since the character of its -electron conduction band closely matches that of the heavy lanthanides, Y even exhibiting nearly the same sequence of structural transitions under pressure.samu2 One may thus anticipate that changes in the magnetic state of the Tb ion in the dilute alloy will be mirrored in the changes occurring in the magnetic state of Tb metal.
The efficacy of this strategy is supported by previous studies of the pressure dependences for Dy metal and for Y(Dy) where both experience a dramatic enhancement beginning just above the pressure of Dy’s volume collapse at GPa.lim0 It was argued that this anomalous behavior might be the result of the Dy ion exhibiting Kondo physics at elevated pressures where both and are proportional to , the square of the negative exchange parameter leading to the Kondo effect. Dy’s volume collapse itself has been suggested to have its origin in the Kondo volume collapse model of Allen and Martin.allen
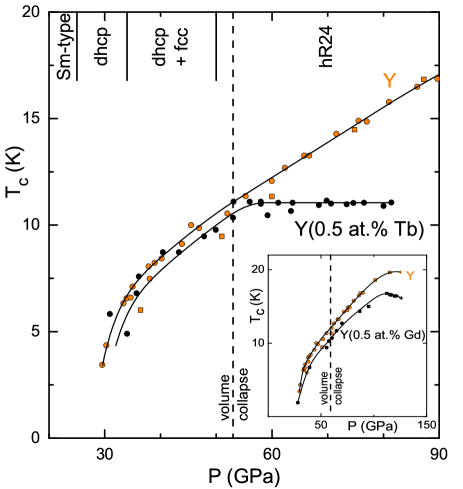
Does perhaps the same scenario apply for Tb? In Fig. 6 the pressure dependence of the superconducting transition temperature of the dilute magnetic alloy Y(0.5 at.% Tb) from our previous workfabbris1 is compared to that for elemental Y metal.hamlin1 To a pressure of 50 GPa, for the dilute magnetic alloy is seen to increase with pressure at the same rate as for Y. However, just above the pressure of Tb’s volume collapse at 53 GPa, the dependence for the alloy begins to pull away rapidly from that of Y, reaching a maximum suppression 5 K at 81 GPa, the highest pressure of the experiment. This strong suppression of Y’s superconductivity by dilute Tb ions points to giant Kondo pair breaking, as has previously been observed in high pressure studies on the dilute magnetic alloys La(Ce),lace La(Pr),lapr Y(Pr),fabbris1 ; ypr and, most recently, Y(Dy).fabbris1 In contrast, as seen in the inset to Fig. 6, for Y(0.5 at.% Gd) does not begin to deviate markedly from that of Y metal near GPa, where Gd’s volume collapse occurs, but rather faithfully tracks Y’s value of to 127 GPa, the maximum pressure of the experiment. Unlike for Tb, the magnetic state for Gd ions in Y remains stable to 127 GPa, so that no Kondo phenomena are expected. We thus suggest that the anomalous pressure dependences and in Tb and Y(Tb) alloy, respectively, have their origin in Kondo physics, as does Tb’s volume collapse itself. In support of these suggestions we point out that XANES and XES experiments on Tb to extreme pressure reveal that neither a change in valence nor a magnetic local-itinerant transition occur to a pressure of GPa, well above the volume collapse pressure for Tb at 53 GPa.fabbris1
Could perhaps an alternative explanation for the anomalously high magnetic ordering temperatures in Tb be the effect of crystalline electric fields? It has been argued that such fields are likely responsible for the significant enhancement of over de Gennes scaling in a series of RRh4B4 compounds, where R is a lanthanide.noakes ; dunlap5 If the magnetic anisotropy is strong, it has been shownnoakes ; dunlap5 that the crystal field enhancement can be as large as the factor for trivalent Tb where and . No crystal field effects are possible for Gd since it carries no orbital moment (). The lack of a sharp upturn or other anomalies in and in the pressure region 60 - 127 GPa would be consistent with the certain absence of crystal field effects in Gd. The fact that the pressure dependence of is very similar for both Gd and Tb to 53 GPa indicates that crystal field effects in Tb, if present, are only significant for pressures above 53 GPa where the dependence becomes anomalous. In a crystal field scenario, however, it would be difficult to understand the sharp upturn in the suppression of superconductivity in the dilute magnetic alloy Y(0.5 at.% Tb) for pressures above 53 GPa. This strong suppression of superconductivity points rather to a Kondo physics scenario with strong Kondo pair breaking.
Further experimentation is necessary to unequivocally establish the origin of the anomalous behavior of and in Tb and Y(Tb) alloy, respectively, for the pressure region above 53 GPa. Such experiments could include an extension of the pressure range to 2 Mbar to search for the characteristic “Kondo sinkhole behavior” in observed for Y(Pr),fabbris1 ; ypr La(Ce),lace and La(Pr)lapr where the -suppression reaches a maximum as the Kondo temperature passes through the experimental temperature range, but falls off again at higher pressures where far exceeds Inelastic neutron or x-ray scattering studies to extreme pressures would help establish whether crystal-field splittings play a role in the anomalously high values of for Tb.
In summary, measurements of the electrical resistivity of Tb metal to extreme pressures reveal that the magnetic ordering temperature exhibits a highly non-monotonic pressure dependence, appearing to rise for 80 GPa to anomalously high values. Parallel experiments on Gd and dilute magnetic alloys of Gd and Tb with Y suggest that under extreme pressures Tb is transformed from a magnetically conventional lanthanide into one with an unconventional magnetic state, perhaps involving Kondo physics, with anomalously high values of . In contrast, Gd remains a magnetically conventional lanthanide to pressures of at least 127 GPa.
Acknowledgments. The authors would like to thank T. Matsuoka and K. Shimizu for sharing information on their high-pressure electrical resistivity techniques used in the present study. This work was supported by the National Science Foundation (NSF) through Grant No. DMR-1104742 and by the Carnegie/DOE Alliance Center (CDAC) through NNSA/DOE Grant No. DE-FC52-08NA28554. Work at Argonne National Laboratory is supported by the US Department of Energy, Office of Science, under contract No. DE-AC02-06CH11357.
References
- (1) J. Lim, G. Fabbris, D. Haskel, and J. S. Schilling, Phys Rev. B 91, 045116 (2015).
- (2) See: K. N. R. Taylor and M. I. Darby, Physics of Rare Earth Solids (Chapman and Hall Ltd., London, 1972).
- (3) W. C. Koehler, J. Appl. Phys. 36, 1078 (1965).
- (4) D. B. McWhan and A. L. Stevens, Phys. Rev. 139, A682 (1965).
- (5) D. D. Jackson, V. Malba, S. T. Weir, P. A. Baker, and Y. K. Vohra, Phys. Rev. B 71, 184416 (2005).
- (6) M. Mito, K. Matsumoto, Y. Komorida, H. Deguchi, S. Takagi, T. Tajiri, T. Iwamoto, T. Kawae, M. Tokita, K. Takeda, J. Phys. Chem. Solids 70, 1290 (2009).
- (7) S. A. Thomas, J. M. Montgomery, G M. Tsoi, Y. K. Vohra, G. N. Chesnut, S. T. Weir, C. A. Tulk, A. M. dos Santos, High Press. Res. 33, 555 (2013).
- (8) G. Fabbris, T. Matsuoka, J. Lim, J. R. L. Mardegan, K. Shimizu, D. Haskel, and J. S. Schilling, Phys. Rev. B 88, 245103 (2013).
- (9) N. C. Cunningham, W. Qiu, K. M. Hope, H.-P. Liermann, and Y. K. Vohra, Phys. Rev. B 76, 212101 (2007).
- (10) Material Preparation Center, Ames Lab, US DOE, Ames, Iowa http:/www. mpc.ameslab.gov.
- (11) James S. Schilling, Mat. Res. Soc. Symp. Proc. 22, 79 (1984).
- (12) K. Shimizu, K. Amaya, and N. Suzuki, J. Phys. Soc. Jpn. 74, 1345 (2005).
- (13) W. B. Daniels and W. Ryschkewitsch, Rev. Sci. Instr. 54, 115 (1983).
- (14) A. D. Chijioke, W. J. Nellis, A. Soldatov, and I. F. Silvera, J. Appl. Phys. 98, 114905 (2005).
- (15) Y. Akahama and H. Kawamura, J. Appl. Phys. 100, 043516 (2006).
- (16) S. Klotz, J. S. Schilling, and P. Müller, in Frontiers of High Pressure Research, edited by H. D. Hochheimer and R. D. Etters (Plenum, New York, 1991) p. 473.
- (17) M. Debessai, J. J. Hamlin, and J. S. Schilling, Phys. Rev. B 78, 064519 (2008).
- (18) B. R. Coles, Adv. Phys. 7, 40 (1958).
- (19) R. V. Colvin, S. Legvold, and F. H. Spedding, Phys. Rev. 120, 741 (1960).
- (20) R. Patterson, C. K. Saw, and J. Akella, J. Appl. Phys. 95, 5443 (2004).
- (21) H. Hua, V. K. Vohra, J. Akella, S. T. Weir, R. Ahuja, and B. Johansson, Rev. High Pressure Sci. Technol. 7, 233 (1998).
- (22) D. Errandonea, R. Boehler, B. Schwager, and M. Mezouar, Phys. Rev. B 75, 014103 (2007).
- (23) J. Duthie and D. Pettifor, Phys. Rev. Lett. 38, 564 (1977).
- (24) G. S. Fleming and S. H. Liu, Phys. Rev. B 2, 164 (1970); S. H. Liu, Phys. Rev. 127, 1889 (1962).
- (25) J. W. Allen and R. M. Martin, Phys. Rev. Lett. 49, 1106 (1982).
- (26) Z. P. Yin and W. E. Pickett, Phys. Re. B 74, 205106 (2006).
- (27) B. T. Matthias, H. Suhl, and E. Corenzwit, Phys. Rev. Lett. 1, 92 (1958).
- (28) M. B. Maple, Appl. Phys. 9, 179 (1976).
- (29) G. K. Samudrala, G. M. Tsoi, and Y. K. Vohra, J. Phys.: Condens. Matter 24, 362201 (2012).
- (30) J. Hamlin, V. Tissen, and J. S. Schilling, Physica C 451, 82 (2007).
- (31) M. Maple, J. Wittig, and K. Kim, Phys. Rev. Lett. 23, 1375 (1969).
- (32) J. Wittig, Phys. Rev. Lett. 46, 1431 (1981).
- (33) J. Wittig, Valencies Instabilities, edited by P. Wachter and H. Boppart (North-Holland, Amsterdam, 1982) p. 427.
- (34) D. R. Noakes and G. K. Shenoy, Phys. Lett. 91A, 35 (1982).
- (35) B. D. Dunlap, L. N. Hall, F. Behroozi, G. W. Crabtree, D. G. Niarchos, Phys. Rev. B 29, 6244 (1984).