Coupled-mode induced transparency in aerostatically-tuned microbubble whispering gallery resonators
Abstract
Coupled-mode induced transparency is realized in a single microbubble whispering gallery mode resonator. Using aerostatic tuning, we find that the pressure induced shifting rates are different for different radial order modes. A finite element simulation considering both the strain and stress effects shows a GHz/bar difference and this is confirmed by experiments. A transparency spectrum is obtained when a first order mode shifts across a higher order mode through precise pressure tuning. The resulting lineshapes are fitted with the theory. This work lays a foundation for future applications in microbubble sensing.
pacs:
140.3948,220.4000,230.3990,280.4788,280.5475.In the last few decades, a category of optical microcavities, termed whispering gallery mode (WGM) resonators (WGRs), has been developed and has generated interest in a wide range of fields. These resonators are characterized by having ultrahigh quality (Q) factors and small optical mode volumes, thereby making them advantageous for studies in areas such as cavity QED Aoki et al. (2006); Park et al. (2006), nonlinear optics Herr et al. (2013), optomechanics Aspelmeyer et al. (2014) and high sensitivity sensing Vollmer and Arnold (2008). Within the WGR family, the microbubble resonator Sumetsky et al. (2010) is a relatively recently-developed type. Experimentally, microbubbles can be made with single Watkins et al. (2011) or double inputs Sumetsky et al. (2010) so that different materials can be injected into the hollow core. A subtle change in the material can cause a large frequency shift to the resonator’s modes, which can be used for sensing. Extensive work has already be done in the field of bio Li et al. (2013); Sun and Fan (2011) and chemical sensing Sun and Fan (2011) using WGMs in hollow optical resonators. Various microbubble sensing applications have been studied, such as refractive index White et al. (2006), temperature Ward et al. (2013), and optomechanical sensing Bahl et al. (2013). Aside from sensing, lasing in hollow cavities has been achieved Suter et al. (2010); Lee et al. (2011).
Another potential application of the microbubble is that of coupled-mode induced transparency. Electromagnetic induced transparency (EIT)-like and Fano-like lineshapes in the transmission spectrum of a WGM resonator coupled to a waveguide, such as a tapered optical fiber, have been observed in recent years. These phenomena are very important for applications such as slow light Totsuka et al. (2007) and optical switching Fan (2002). To date, EIT- and Fano-like lineshapes have been seen in a single microtoroid Xiao et al. (2009); Li et al. (2011), a single microsphere Dong et al. (2009), and in directly Zheng et al. (2012) or indirectly coupled Li et al. (2012) resonators. For a single resonator, a low and a high Q mode should be found within a very small frequency separation. When the two modes are tuned into resonance, an EIT-like lineshape occurs.
In this paper we will show that resonance can be achieved by pressure tuning a single microbubble resonator Henze et al. (2011), so that two modes with different mode orders experience different shift rates. Aerostatic tuning of the modes has some advantages over other methods. For example, it is precise and fast, with a larger tuning range than dispersion tuning in a single microsphere Dong et al. (2009). Also, it is more convenient and repeatable than temperature tuning Ward et al. (2013).
WGMs with different orders have different optical paths, or different effective mode radii, in the cavity. Therefore, modes of different orders show different FSRs and responses to external perturbations, such as aerostatic pressure. These conditions are necessary for the EIT phenomena reported in this paper, because they lead to modes with close frequencies and varying aerostatic tuning rates. Consider a microbubble of inner and outer radius, and , respectively. A microbubble with a thick wall, i.e., , can be treated equivalent to a microsphere, at least for the radial modes and 2 when the resonances are determined as an asymptotic formula Lam et al. (1992). The sensitivity is given as
| (1) |
where is the refractive index of the microbubble, and is the angular momentum of the resonance. is the root of the Airy function, . Note that in Henze et al. (2011) high order terms in the asymptotic expression were omitted so that . For the two modes, and 2, with the same , the shift rates differ by
| (2) |
Here, and, for a fixed , in general, so that . For a silica microbubble, . Eq. 2 is always positive, therefore low order modes shift faster than higher ones. The larger the value of , the larger the shift rates between the modes. From Henze et al. (2011), is proportional to a geometrical parameter, , and we can write
| (3) |
where m2/N is the elasto-optic constant of silica, and and are the internal and external pressures. Therefore, for a thinner wall, the effect should be more obvious. However, the earlier assumption that the mode distribution is equivalent to that of a microsphere is not valid for thin-walled microbubbles; in the following discussion, we adapt a finite element method Yang et al. (2014) to precisely simulate the microbubble modes. The fact that the strain contribution will lead to a much larger shift rate difference in thin-walled bubbles should also be considered and we will discuss this later.
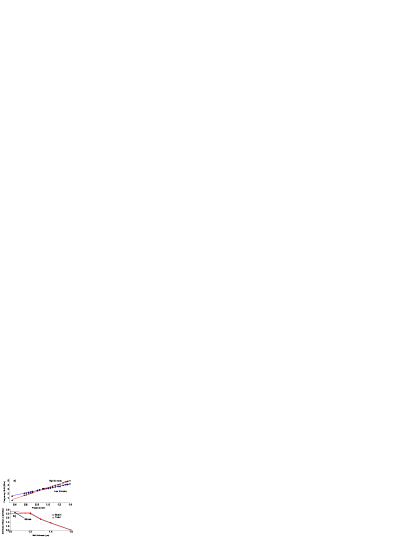
A microbubble was made using the method described in Ward et al. (2013) with one input sealed using a CO2 laser. The radius and wall thickness were measured as m and m. The WGM shifts were recorded using a taper-coupled setup illustrated in Fig. 1(a) and an electronic sensor was calibrated for monitoring the internal pressure. The taper was made by heating-and-pulling standard 1550 nm single-mode fiber down to a waist of less than 1.2 m to ensure single mode operation. To eliminate the influence of vibrations, the microbubble was in contact coupling with the tapered fiber and the whole system was placed in an enclosure. Two modes with different Q factors were chosen for tracking. It is assumed that the low Q mode was and the high Q mode was . Resonant frequencies at different internal pressures are plotted in Fig. 2(a). The linear fits yield shift rates of GHz/bar and GHz/bar for the two modes, resulting in a positive rate difference of GHz/bar.
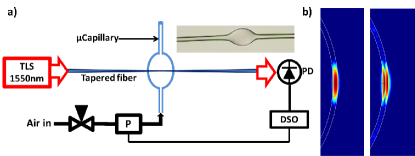
To simulate the experimental results, the frequency shifts due to stress and strain were calculated separately. By setting in Eq. 3 to 0, Pa (i.e., 10 bar) and Pa (i.e., 20 bar) we numerically calculated the frequency shifts for the and 2 modes (Fig 1(b)) in a bubble with a diameter of 90 m and a wall thickness varying from 1 m to 1.6 m. The stress effect, , causes a shift rate difference in the MHz/bar scale only.
Strain affects the WGM resonance by changing the size of the microbubble as . FEM simulations were used to calculate the shifts for the and modes for a given size expansion (i.e., 0.01 m increase in ). Next, the relative change in , given by Henze et al. (2011)
| (4) |
was used to determine the required pressure for the same expansion. This was repeated for different wall thicknesses. The shear and bulk moduli in Eq.4 are Pa and Pa for the silica capillary used. As a summary, Fig 2(b) illustrates the shift rate differences between the two modes originating from the strain and the stress, thus giving the total rate difference. For thin-walled microbubbles the strain-induced rate difference is in the GHz/bar range. The shift rate difference for the and 2 modes for a wall thickness of 1.3 m is calculated to be 1.90 GHz/bar, which is quite close to the measured value from Fig. 2(a).
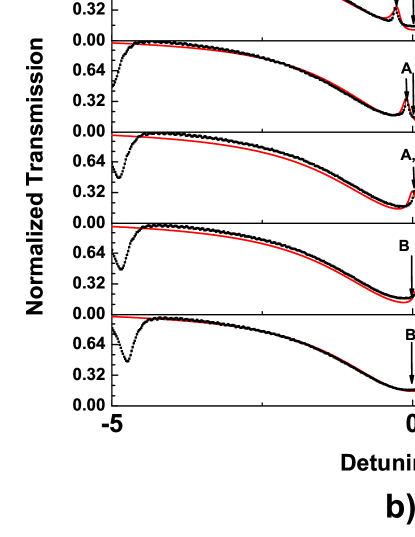
In experiments, the linewidth of the low Q mode is about 2 GHz. We could always find a high Q mode (linewidth of MHz) in the vicinity of the low Q one. With only about 1 bar of input pressure, the high Q mode (A) can be tuned across the low Q mode (B) transmission dip. Fig. 3(b) shows an example of such a crossing, where an EIT-like shape appears as a result of tuning the two modes into resonance.
In Li et al. (2011), the appearance of EIT and Fano shapes in a single microresonator was explained by coupled-mode theory as follows:
| (5) |
A and B are considered to be two quasi TE (TM) WGMs indirectly coupled through the taper mode . are the intrinsic rates and is the polarization orientation of the taper mode , see Fig. 3(a). The coupling strength is determined by the external coupling rates, and , and their polarization angles, , through . Intracavity EM fields of the A, B modes, i.e. and , are coupled back to the taper fiber mode, with a different input/output relationship for two orthogonal polarizations as and . The transmission spectrum is an intensity superposition of these to orthogonal polarizations:
| (6) |
From Eq. 5, can be deduced when in steady state, i.e. . By substituting into Eq. 6, the transmission can be calculated for known and detuning . Thus EIT and Fano-like lineshapes can be manipulated by either changing the detuning or polarization Li et al. (2011); Dong et al. (2009).
In contrast to earlier work Dong et al. (2009), where the detuning of the two modes is modified by varying the coupling gap and, subsequently, by dispersion, our system remains in contact with the coupling fiber. The pressure tuning only changes the detuning of the modes with a much larger range, while keeping other parameters unchanged. Since the rate difference has been determined in the previous discussion, the detuning can be precisely known if the pressure is also known. In practice, the experimental data was fitted with the detuning ranging from 250 MHz to -250 MHz and using one unchanged set of parameters, , which are given in Fig. 3. Note there is still a small discrepancy when adding more pressure (i.e. detuning is more negative). A possible explanation is that silica is a birefringent material, so pressurizing the microbubble may rotate the polarization of the WGMs, thereby distorting the lineshape from EIT-like to Fano-like.
In summary, we have shown that a controllable EIT-like shape can be easily realized in a single aerostatically-tuned microbubble. We proved, both theoretically and experimentally, that, for different radial modes, the pressure tuning rates are different due to the size and refractive index change induced by strain and stress. The experiments show that aerostatic tuning of the microbubble might be a simplified and precise way to implement controllable EIT and Fano lineshapes. Furthermore, by having a Fano-like lineshape due to the coupling of two modes, the sensitivity for pressure sensing in a microbubble can be enhanced, as predicted in Li et al. (2011).
This work was supported by the Okinawa Institute of Science and Technology Graduate University. The authors thank N. Dhasmana for initial contributions to this work.
References
- Aoki et al. (2006) T. Aoki, B. Dayan, E. Wilcut, W. P. Bowen, A. S. Parkins, T. J. Kippenberg, K. J. Vahala, and H. J. Kimble, Nature 443, 671 (2006).
- Park et al. (2006) Y.-S. Park, A. K. Cook, and H. Wang, Nano Lett. 6, 2075 (2006).
- Herr et al. (2013) T. Herr, V. Brasch, J. D. Jost, C. Y. Wang, N. M. Kondratiev, M. L. Gorodetsky, and T. J. Kippenberg, Nature Photon. 8, 145 (2013).
- Aspelmeyer et al. (2014) M. Aspelmeyer, T. J. Kippenberg, and F. Marquardt, Rev. Mod. Phys. 86, 1391 (2014).
- Vollmer and Arnold (2008) F. Vollmer and S. Arnold, Nat. Methods 5, 591 (2008).
- Sumetsky et al. (2010) M. Sumetsky, Y. Dulashko, and R. S. Windeler, Opt. Lett. 35, 898 (2010).
- Watkins et al. (2011) A. Watkins, J. Ward, Y. Wu, and S. Nic Chormaic, Opt. Lett. 36, 2113 (2011).
- Li et al. (2013) M. Li, X. Wu, L. Liu, X. Fan, and L. Xu, Anal. Chem. 85, 9328 (2013).
- Sun and Fan (2011) Y. Sun and X. Fan, Anal. Bioanal. Chem. 399, 205 (2011).
- White et al. (2006) I. M. White, H. Oveys, and X. Fan, Opt. Lett. 31, 1319 (2006).
- Ward et al. (2013) J. M. Ward, Y. Yang, and S. Nic Chormaic, IEEE Photon. Tech. Lett. 25, 2350 (2013).
- Bahl et al. (2013) G. Bahl, K. H. Kim, W. Lee, J. Liu, X. Fan, and T. Carmon, Nature Commun. 4, 1994 (2013).
- Suter et al. (2010) J. D. Suter, W. Lee, D. J. Howard, E. Hoppmann, I. M. White, and X. Fan, Opt. Lett. 35, 2997 (2010).
- Lee et al. (2011) W. Lee, Y. Sun, H. Li, K. Reddy, M. Sumetsky, and X. Fan, Appl. Phys. Lett. 99, 091102 (2011).
- Totsuka et al. (2007) K. Totsuka, N. Kobayashi, and M. Tomita, Phys. Rev. Lett. 98, 213904 (2007).
- Fan (2002) S. Fan, Appl. Phys. Lett. 80, 908 (2002).
- Xiao et al. (2009) Y.-F. Xiao, L. He, J. Zhu, and L. Yang, Appl. Phys. Lett. 94, 231115 (2009).
- Li et al. (2011) B.-B. Li, Y.-F. Xiao, C.-L. Zou, Y.-C. Liu, X.-F. Jiang, Y.-L. Chen, Y. Li, and Q. Gong, Appl. Phys. Lett. 98, 021116 (2011).
- Dong et al. (2009) C.-H. Dong, C.-L. Zou, Y.-F. Xiao, J.-M. Cui, Z.-F. Han, and G.-C. Guo, J. Phys. B: At., Mol. Opt. Phys. 42, 215401 (2009).
- Zheng et al. (2012) C. Zheng, X. Jiang, S. Hua, L. Chang, G. Li, H. Fan, and M. Xiao, Opt. Express 20, 18319 (2012).
- Li et al. (2012) B.-B. Li, Y.-F. Xiao, C.-L. Zou, X.-F. Jiang, Y.-C. Liu, F.-W. Sun, Y. Li, and Q. Gong, Appl. Phys. Lett. 100, 021108 (2012).
- Henze et al. (2011) R. Henze, T. Seifert, J. Ward, and O. Benson, Opt. Lett. 36, 4536 (2011).
- Lam et al. (1992) C. C. Lam, P. T. Leung, and K. Young, J. Opt. Soc. Am. B Opt. Phys. 9, 1585 (1992).
- Yang et al. (2014) Y. Yang, J. Ward, and S. Nic Chormaic, Opt. Express 22, 6881 (2014).