Beyond Strong Coupling in a Massively Multimode Cavity
Abstract
The study of light-matter interaction has seen a resurgence in recent years, stimulated by highly controllable, precise, and modular experiments in cavity quantum electrodynamics (QED) haroche2006exploring . The achievement of strong coupling PhysRevLett.68.1132 ; Wallraff2004 ; Reithmaier2004 , where the coupling between a single atom and fundamental cavity mode exceeds the decay rates, was a major milestone that opened the doors to a multitude of new investigations Mabuchi15112002 ; Schoelkopf2008 . Here we investigate multimode strong coupling (MMSC) Egger2013 ; Krimer2014 , where the coupling is comparable to the free spectral range (FSR) of the cavity, i.e. the rate at which a qubit can absorb a photon from the cavity is comparable to the round trip transit rate of a photon in the cavity. We realize, via the circuit QED architecture Blais2004 ; Devoret2013 , the first experiment accessing the MMSC regime, and report remarkably widespread and structured resonance fluorescence, whose origin extends beyond cavity enhancement of sidebands Kim2014 . Our results capture complex multimode, multiphoton processes, and the emergence of ultranarrow linewidths. Beyond the novel phenomena presented here, MMSC opens a major new direction in the exploration of light-matter interactions.
Interest in going beyond strong coupling has focused on the ultrastrong coupling limit, where the breakdown of the rotating-wave approximation results in excitation non-conserving terms Niemczyk2010 . In contrast, the direction which we pursue is the simultaneous strong coupling of the qubit to numerous modes, leading to qubit mediated mode-mode interactions and many-body physics not present in the single mode problem. Unlike the spin-boson problem, where the continuum bosonic modes are treated as a bath for the qubit, in MMSC the dynamics of individual modes and finite time correlations between modes are essential. Furthermore, the study of MMSC can not rely on the integrability present in the single mode and continuum problems Braak2011 , thus requiring new theoretical ideas for its study.
The closed system is described by the Hamiltonian:
| (1) |
where is the qubit frequency, is the Pauli operator, and represents cavity mode number. Here, () and () are mode (qubit) raising and lowering operators. The coupling strength of the qubit to the th harmonic is , where is the coupling rate to the fundamental cavity mode Houck2008 .
To achieve MMSC, the coupling between qubit and cavity must be comparable to the free spectral range, which is made possible through use of a long cavity. Previously, long cavities have been used for novel comb generation, with a Kerr nonlinearity provided by the bulk medium Erickson2014 . In cavity QED, unique multimode platforms have been studied, where degenerate modes are coupled via ensembles of atoms Gopala2010 ; Wickenbrock2013 . In contrast, here the nonlinearity is provided by a single qubit. In our setup, the coupling to the fundamental mode cohen1992atom , , scales with cavity length as . Holding constant the qubit frequency, we are interested in the harmonic of the cavity which is nearly resonant with the qubit. The ratio of the coupling for this mode to the FSR then scales as . As there are many modes simultaneously interacting with the qubit, many modes can be coupled to each other during the typical lifetime of an excitation in the system, with the effective qubit mediated interaction rate between a pair of modes being , leading to a delocalization of the excitation across many modes.
Within this rich domain, we first focus our attention on resonance fluorescence, or the response of a qubit to coherent drive. Strongly driving a qubit in free space results in emission forming a three peaked structure known as the Mollow triplet, composed of a center peak and two symmetric sidebands Mollow1969 . The sidebands are displaced linearly from the central peak by the Rabi amplitude Savage1989 . This phenomenon, also observed experimentally with superconducting qubits Astafiev2010 , is typically explained using the dressed state picture approach Cohen-Tannoudji1977 . Coupling of a qubit to a single mode cavity strongly modifies the Mollow triplet Muller2007 ; Lang2011 ; Oelsner2013 . For weak coupling, the cavity passively filters the fluorescence, while at strong coupling, the sideband width is proportional to the coupling Savage1989 ; Kim2014 .
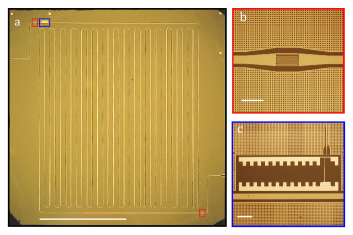
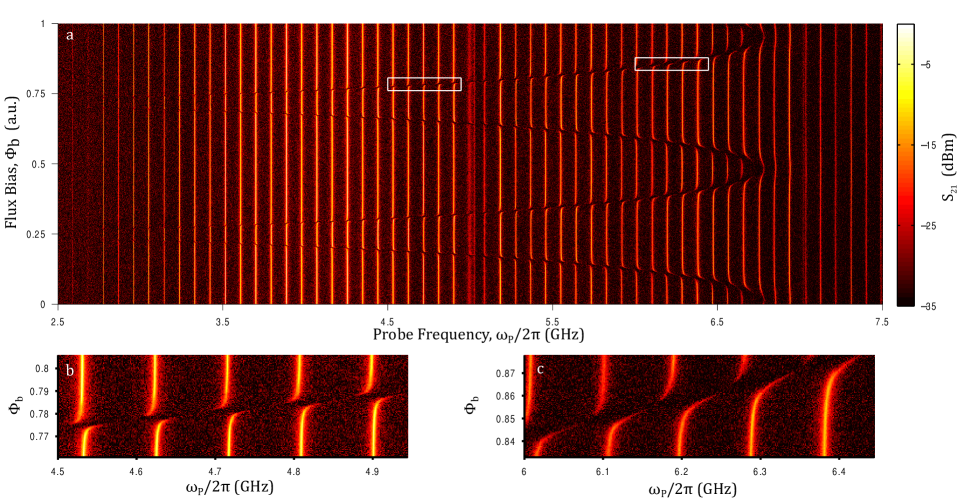
We design a very low frequency cavity such that the of a standard qubit falls near a high harmonic ( 50th-75th) of the cavity, unlike traditional circuit QED experiments. Additionally, this approach allows us to adapt to the typical measurement range (3-8GHz) of existing circuit QED setups (see Methods). The superconducting microwave cavity comprises a 0.68 m transmission line with identical capacitors on either end, resulting in a fundamental frequency, MHz (see Fig. 1 and Methods section for details). We couple a flux-tunable transmon qubit Koch2007 near one end of the resonator, an anti-node for all the modes of the cavity, and achieve a qubit-mode coupling strength for the 75th cavity harmonic exceeding 30 MHz. Coherent drive, at frequency , is introduced only via the input port (Fig. 1b), while radiative decay of cavity photons occurs via both input and output ports. A unitary transformation maps the coherent drive from the cavity to the qubit, yielding a qubit driving term , with the Rabi drive amplitude (see Supplement). The mode linewidths, , span from 0.5-3 MHz to provide reasonable separation between modes. The qubit spontaneous decay rate, , is of the order of 1.6 MHz, due to the multimode Purcell effect Houck2008 .
Measuring transmission while tuning the qubit frequency reveals that the qubit strongly couples to a vast number of modes (Fig. 2a) Wallraff2004 . In fact, we are able to follow the trail of avoided crossings for several GHz as the qubit energy tunes through the uniformly dense mode structure. The smooth transitions between subsequent avoided crossings show that the qubit is perpetually near resonance with some mode and as such the dispersive approximation is never valid. In Figs. 2b-c, the marked difference in the magnitude of the avoided crossings, and thus coupling strength, is apparent. We apply a fit to find MHz, giving rise to 32 MHz.
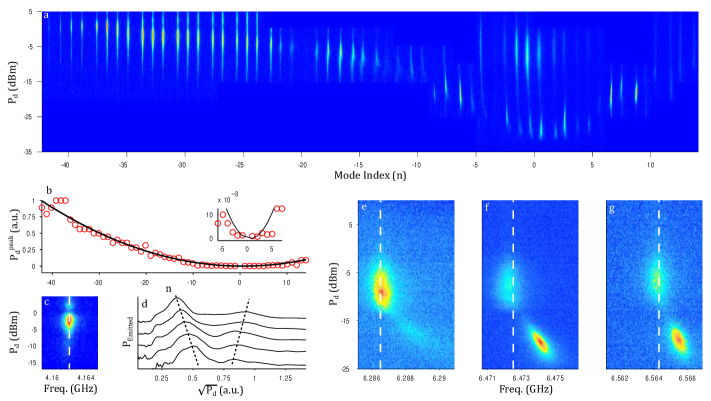
In Fig. 3 we observe fluorescence across more than 50 modes, when the drive and qubit are resonant with a high harmonic of the cavity. Enhanced fluorescence is observed at mode when it is resonant with the Rabi sideband. As the displacement of Mollow sidebands is proportional to drive amplitude , this occurs Kim2014 when detuning from the th mode . For far detuned modes the drive power needed to reach the peak fluorescence at these modes , and hence (Fig. 3b).
At fixed drive power, emission is spread over many modes, with the simultaneous enhancement at many nearby modes, differentiating the multimode fluorescence from the single mode case. With varying drive power, far detuned modes exhibit a multi-lobed fluorescence structure (e.g. Fig. 3c). The drive power for the peak of the secondary lobe approaches twice that of the first lobe for increasing detuning (Fig. 3d), originating from multiphoton decays. Two photon decay processes in single mode cavities, where , have previously been observed Lange1996 ; Ota2011 . For MMSC, the multiphoton decay processes can progress via combinations of many different modes. The resonance condition for single and multiphoton processes is thus shifted away from , for (see Supplement).
At smaller detuning, the drive power for the peak fluorescence deviates from a quadratic dependence on detuning. Multimode effects become increasingly dominant as we approach modes closer to the qubit, with the appearance of a different intricate multi-lobed structure. When the resonant mode is very weakly driven, there is no incoherent scattering to the other modes. However, at a higher drive power, fluorescence appears simultaneously at multiple nearby modes (three of which are displayed in Fig. 3e-g). In addition to detecting bright fluorescence at these nearby modes (three on either side of the center mode) we also observe incoherent scattering at the center mode itself. Furthermore, there is a change in emission frequency at each of these modes, approaching the bare cavity mode from above with increasing drive power. This shift is qualitatively the same for modes on either side of the drive, and cannot be attributed to a simple AC Stark shift.
As drive power is further increased, the simultaneous fluorescence at the nearby modes fades away. At an even higher power, the emission at these modes reappears, but at the bare cavity mode frequencies. This power coincides with that at which the far detuned modes fluoresce, suggesting the emergence of qubit mediated massively multimode correlation.
A remarkable observation of our experiment is the appearance of ultranarrow linewidths in emission. The fluorescence at far detuned modes, captured in Fig. 3, have linewidths that are roughly equal to that of the bare modes. For modes nearest the qubit the fluorescence linewidth is smaller than , e.g. for the nearest mode above being respectively 650 kHz vs. 1.1 MHz. Detuning the drive from the center mode unveils here a linewidth narrowing by over an order of magnitude to 65 kHz (Fig. 4a). The narrowest fluorescence occurs when the drive is detuned by MHz from the resonant mode. This unexpected behavior is robust to qubit frequency; the narrowed fluorescence produced with the MHz detuned drive remains even as the qubit frequency is tuned over MHz away from the cavity mode (see Supplement).
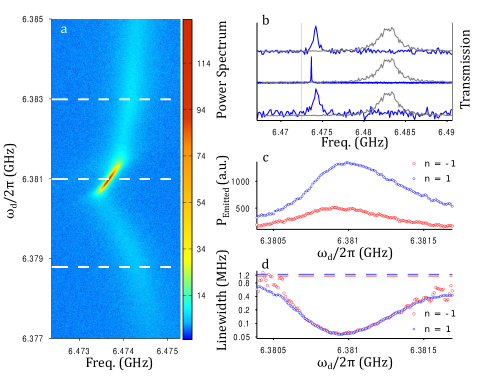
We attribute this narrowing to the spontaneous generation of coherence arising from the coupling of many dressed states through a common vacuum. Such behavior has been predicted and observed in atoms with multiple closely spaced bare atomic levels coupled to vacuum or a single mode of a cavity Zhou1996 ; Kiffner2010 ; Heeg2013 , where the theoretical analysis is aided by the simpler dressed state structure. In our setup, unlike the single mode case, the number of states in a single excitation manifold is not a constant but rather grows as , where is the number of modes and is the excitation manifold. The rapid growth of the number of states per manifold hinders a simplified analysis via the dressed state picture, but makes possible the near resonance of many level spacings (Bohr frequencies), leading to a collective enhancement of the coherences from their mutual couplings. An external coherent drive allows us to dynamically access regions of the dressed states with large generated coherences, as evident in the drive dependence of the narrowing in Fig. 4.
In the region where narrowing is observed, the linewidth and steady state photon number are observed to be inversely proportional, as has been previously suggested for the case of a single mode Freedhoff1994 . For our multimode cavity, the narrowing is in fact observed simultaneously for multiple modes at the same drive frequency, as depicted in Figs. 4c-d for the two modes nearest the drive. While the modes directly neighboring the center mode exhibit the sharpest linewidths of kHz, the next nearest modes also display a narrowed fluorescence, kHz. The multi-lobed power dependent structure of fluorescence also appears at the optimal detuned drive frequency, however, the linewidth of the second lobe is of order , for the nearby modes. For more distant modes, while fluorescence follows a similar dependence, there is no narrowing apparent. Finally, the drive dependent narrowing is not unique to these described experimental parameters. When we translate the drive and qubit to another set of modes, we observe equally narrow linewidth fluorescence which indicates that spontaneous generation of coherence is generic in this system.
In this letter, we realized a new regime of circuit QED, multimode strong coupling. We demonstrated the creation of many-body steady states with long lived quantum coherence, as evidenced by multimode resonance fluorescence with ultranarrow linewidths. Dynamically generated quantum correlations between modes in this driven dissipative system is expected to lead to qualitatively new physics Verstraete2009 . While this new complex regime poses many theoretical challenges, precise circuit QED experiments can guide this exploration. We hope that access to multimode strong coupling will lead to many new advancements in circuit QED and our understanding of light-matter interactions.
Methods
\justify
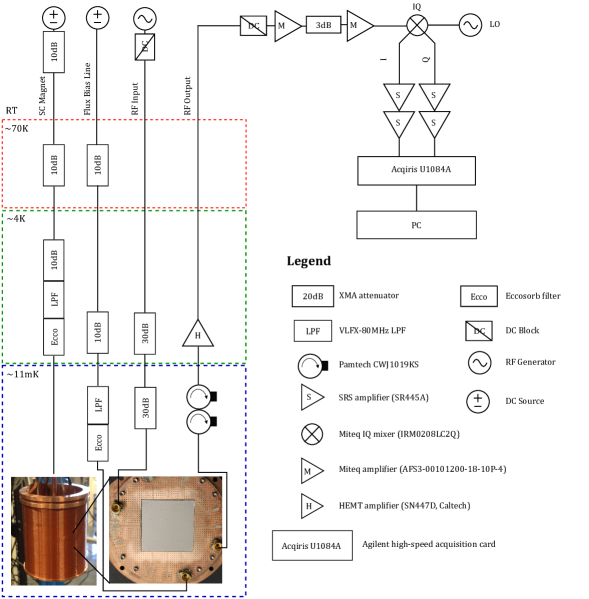
The MMSC device was made using a combination of standard optical and electron-beam lithography techniques on a 25 mm x 25 mm sapphire wafer. The cavity and larger features were etched from a 200 nm thin film of sputtered Niobium, while the qubit was made with evaporated Aluminum using the Dolan Bridge technique. The cavity has a center pin to gap ratio of 10:4.186. The transmon qubit Koch2007 is capacitively coupled near the end of the cavity, at an antinode. The qubit consists of two large islands and a pair of parallel junctions in a SQUID-loop geometry. While there is an on-chip flux bias line, a superconducting magnet was installed around the device to tune the qubit frequency without detrimental thermal heating. The device was extensively wire-bonded to the circuit board to ensure proper connection of all ground planes and reduce the effect of spurious modes. The device was cooled to 11 mK in a dilution refrigerator, and measured using standard low-temperature microwave circuit elements including an IQ mixer, isolators, and a HEMT amplifier.
Acknowledgements
\justify
We thank C. Eichler, S. M. Girvin, J. Koch, D. I. Schuster, W. E. Shanks, S. J. Srinivasan, and J. M. Taylor for helpful conversations and technical support.
Funding
\justify
This work was supported by the US Army Research Office (W911NF-11-1-0086), the US National Science Foundation through the Princeton Center for Complex Materials (DMR-0819860) and CAREER awards (Grant Nos. DMR-0953475 & DMR-1151810), the David and Lucile Packard Foundation, and the DoD through the NDSEG program. There are no competing financial interests.
Author contributions
\justify
N. M. S. fabricated the device, led the experiments, analyzed the data, and wrote the manuscript. Y. L. and D. S. provided key contributions in the experiments and data analysis, helped in writing the manuscript, and performed the numerical simulations. L. J. S. contributed to cavity design. D. U. provided technical advice and built the superconducting magnet. M. M. and H.E.T. provided theoretical support. A. A. H. advised and supervised the project.
References
- (1) Haroche, S. & Raimond, J. Exploring the Quantum: Atoms, Cavities, and Photons. Oxford Graduate Texts (OUP Oxford, 2006).
- (2) Thompson, R. J., Rempe, G. & Kimble, H. J. Observation of normal-mode splitting for an atom in an optical cavity. Phys. Rev. Lett. 68, 1132–1135 (1992).
- (3) Wallraff, A. et al. Strong coupling of a single photon to a superconducting qubit using circuit quantum electrodynamics. Nature 431, 162–167 (2004).
- (4) Reithmaier, J. P. et al. Strong coupling in a single quantum dot-semiconductor microcavity system. Nature 432, 197–200 (2004).
- (5) Mabuchi, H. & Doherty, A. C. Cavity quantum electrodynamics: Coherence in context. Science 298, 1372–1377 (2002).
- (6) Schoelkopf, R. J. & Girvin, S. M. Wiring up quantum systems. Nature 451, 664–9 (2008).
- (7) Egger, D. J. & Wilhelm, F. K., Multimode Circuit Quantum Electrodynamics with Hybrid Metamaterial Transmission Lines. Physical Review Letters 111, 163601 (2013).
- (8) Krimer, D. O., Liertzer, M., Rotter, S. & Türeci, H. E. Route from spontaneous decay to complex multimode dynamics in cavity QED. Physical Review A 89, 033820 (2014).
- (9) Blais, A., Huang, R. S., Wallraff, A., Girvin, S. M. & Schoelkopf, R. J. Cavity quantum electrodynamics for superconducting electrical circuits: An architecture for quantum computation. Physical Review A 69, 062320–1 (2004).
- (10) Devoret, M. H. & Schoelkopf, R. J. Superconducting circuits for quantum information: an outlook. Science 339, 1169–74 (2013).
- (11) Kim, H., Shen, T. C., Roy-Choudhury, K., Solomon, G. S. & Waks, E. Resonant Interactions between a Mollow Triplet Sideband and a Strongly Coupled Cavity. Physical Review Letters 113, 027403 (2014).
- (12) Niemczyk, T. et al. Circuit quantum electrodynamics in the ultrastrong-coupling regime. Nature Physics 6, 772–776 (2010).
- (13) Braak, D. Integrability of the Rabi Model. Physical Review Letters 107, 100401 (2011).
- (14) Houck, A. et al. Controlling the Spontaneous Emission of a Superconducting Transmon Qubit. Physical Review Letters 101, 080502 (2008).
- (15) Erickson, R. P., Vissers, M. R., Sandberg, M., Jefferts, S. R. & Pappas, D. P. Frequency Comb Generation in Superconducting Resonators. Physical Review Letters 113, 187002 (2014).
- (16) Gopalakrishnan, S., Lev, B. L. & Goldbart, P. M. Atom-light crystallization of Bose-Einstein condensates in multimode cavities: Nonequilibrium classical and quantum phase transitions, emergent lattices, supersolidity, and frustration. Physical Review A 82, 043612 (2010).
- (17) Wickenbrock, A., Hemmerling, M., Robb, G. R. M., Emary, C. & Renzoni, F. Collective strong coupling in multimode cavity QED. Physical Review A 87, 043817 (2013).
- (18) Cohen-Tannoudji, C., Dupont-Roc, J. & Grynberg, G. Atom-photon interactions: basic processes and applications. Wiley-Interscience publication (J. Wiley, 1992).
- (19) Koch, J. et al. Charge-insensitive qubit design derived from the Cooper pair box. Physical Review A 76, 042319 (2007).
- (20) Mollow, B. Power Spectrum of Light Scattered by Two-Level Systems. Physical Review 188, 1969–1975 (1969).
- (21) Savage, C. Resonance fluorescence spectrum of an atom strongly coupled to a cavity. Physical review letters 63 (1989).
- (22) Astafiev, O. et al. Resonance fluorescence of a single artificial atom. Science 327, 840–3 (2010).
- (23) Cohen-Tannoudji, C. & Reynaud, S. Dressed-atom description of resonance fluorescence and absorption spectra of a multi-level atom in an intense laser beam. Journal of Physics B: Atomic and Molecular Physics 10, 345–363 (1977).
- (24) Muller, A. et al. Resonance Fluorescence from a Coherently Driven Semiconductor Quantum Dot in a Cavity. Physical Review Letters 99, 187402 (2007).
- (25) Lang, C. et al. Observation of Resonant Photon Blockade at Microwave Frequencies Using Correlation Function Measurements. Physical Review Letters 106, 243601 (2011).
- (26) Oelsner, G. et al. Dressed-State Amplification by a Single Superconducting Qubit. Physical Review Letters 110, 053602 (2013).
- (27) Lange, W., Agarwal, G. & Walther, H. Observation of Two-Photon Decay of Rydberg Atoms in a Driven Cavity. Physical Review Letters 76, 3293–3296 (1996).
- (28) Ota, Y., Iwamoto, S., Kumagai, N. & Arakawa, Y. Spontaneous Two-Photon Emission from a Single Quantum Dot. Physical Review Letters 107, 233602 (2011).
- (29) Zhou, P. & Swain, S. Ultranarrow Spectral Lines via Quantum Interference. Physical Review Letters 77, 3995–3998 (1996).
- (30) Kiffner, Martin and Macovei, M and Evers, J and Keitel, C. 3 Vacuum-Induced Processes in Multilevel Atoms. Progress in Optics 55, 86 (2010).
- (31) Heeg, K. P. et al. Vacuum-Assisted Generation and Control of Atomic Coherences at X-Ray Energies. Physical Review Letters 111, 073601 (2013).
- (32) Freedhoff, H. & Quang, T. Ultrasharp lines in the absorption and fluorescence spectra of an atom in a cavity. Physical review letters 72, 474–477 (1994).
- (33) Verstraete, F., Wolf, M. M. & Ignacio Cirac, J. Quantum computation and quantum-state engineering driven by dissipation. Nature Physics 5, 633–636 (2009).
SUPPLEMENTARY MATERIAL \justify
I Experimental Details
I.1 Fridge Diagram
The experimental measurement setup is shown in Fig. S1.
I.2 Standard Spectroscopy
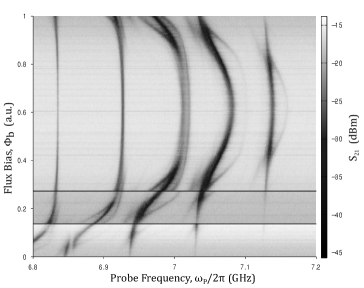
Two-tone spectroscopy or dispersive readout is a standard measurement technique which uses the dispersive shift of a mode to precisely determine the frequency of the qubit Bishop2008 . In our massively multimode strong coupling experiment, such spectroscopy shows that the mode frequency is affected not only by the qubit state, but also by populating the modes nearby to the qubit. This is yet another manifestation of mode-mode interactions mediated via the qubit. The magnitude of transmission, a proxy for the dispersive shift, is indicated by the colorbar in Fig. S2. As the qubit frequency approaches a mode, the strength of interaction between that mode and the measurement mode steadily increases.
This interaction is so strong that the measurement mode shifts substantially even when the qubit is over 200 MHz away. Thus the frequency of the measurement mode needed to be recalibrated for each flux voltage in Fig. S2. Furthermore, to track the qubit in this frequency range with sufficient contrast, the designated measurement mode needed to be changed such that it was farther and farther away from the qubit. For each change of measurement mode, there is a horizontal black line in Fig. S2.
I.3 Ultranarrow Linewidth Versus Qubit and Drive Frequencies
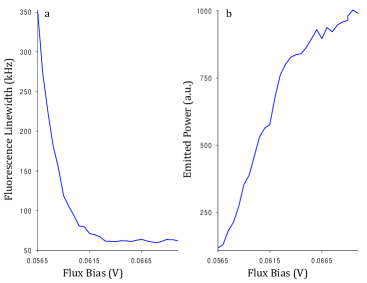
We find that ultranarrow fluorescence is very robust to the flux bias voltage of the transmon qubit as shown in Fig. S3, where we display the linewidth as a function of the flux bias voltage applied to the qubit. This observed robustness will be discussed in the following theoretical analysis. Also displayed is the integrated fluorescence power against the same bias. The power and linewidth are seen to be inversely related. The drive frequency and power here are both fixed to that which results in the minimum linewidth in Fig. 4 of the main text.
II Theoretical Discussion
II.1 Effective Hamiltonian and Master Equation
In order to better interpret the intriguing dynamical phenomena observed in our experiment, here we provide a simplified model to illustrate key aspects of the physics. Even though the model is far from a complete representation of the experimental system, we argue that qualitatively similar physics emerges in the massively multimode system.
This driven dissipative system can be described by the following master equation ( in our units)
| (2) | ||||
| (3) | ||||
| (4) |
with the photon loss rate for mode , and the qubit spontaneous decay rate. The above Hamiltonian is written in the rotating frame of the drive, and the rotating wave approximation (RWA) has been used. is the detuning between the th mode and the drive. Likewise, is the detuning between the qubit and the drive. RWA is a good approximation if we focus on high harmonics ( in the experiment) of this multimode system. is the amplitude of the external drive, and the drive is assumed to be resonant with the th mode. Steady state photon numbers of other modes in the uncoupled system (), are suppressed relative to the resonant term, by multiples of , and we are justified in keeping only the resonant drive. Applying an active drive and dissipation dependent unitary displacement to the state of the system, via , with
| (5) |
transfers the drive in the master equation onto the qubit. The Hamiltonian appearing in the master equation is now , where is the Rabi amplitude. We could in fact directly implement such a drive in our experiment by pumping the flux bias line to qubit. For the sake of simplicity we start from this form of the Hamiltonian (externally driving the qubit) in what follows, and study a restricted two mode system, also taking the drive to be resonant with the qubit. We disregard the mode resonant with the qubit, focusing on the more interesting sideband phenomena.
The master equation for the simplified two mode model is
| (6) | ||||
| (7) |
Without cavity modes, the qubit dynamics result in the famous Mollow triplet. While the single mode case, for a special choice of parameters, can be solved analytically () PRA1993 , this is in general not possible for a general multimode system. We thus resort to numerical simulation based on the above equation (6) in the following discussion.
To motivate the numerical exploration of the two mode master equation, we first analyze some properties of this Hamiltonian to gain intuition. Introducing a new basis for the qubit by defining , yields the Hamiltonian
| (8) |
Applying an atomic-state-dependent mode displacement operator to remove from the interaction, we have
| (9) |
where
| (10) | ||||
| (11) |
This form of the Hamiltonian reveals the complicated multimode multiphoton interactions of arbitrary order.
To further simplify the analysis, as in the RWA, we truncate the Taylor expansion to remove fast oscillating terms. These approximations are only valid in the limit of , and near certain resonance conditions. We thus arrive at a finite order multimode multiphoton Hamiltonian. For example, let us assume that , and that the qubit is resonant with the drive frequency. In this special case, the resonance conditions are simply , for . The effective Hamiltonians for the two different Rabi rates ( and ) become
| (12) | |||||
| (13) |
Note that two photon processes in the second Hamiltonian (13) above are supressed relative to the single photon ones in (12) by . Terms like arise because the second mode carries negative frequency in the rotating frame. The second Hamiltonian is the basis for two photon lasing of driven atoms in a cavity PRL1990 . In our case where only a single qubit is present, keeping high-order quantum correlations beyond semiclassics is essential in explaining relevant coherence properties of the fluorescence light. The full master equation could be derived by applying these transformations on the dissipative part, giving rise to complicated multimode multiphoton dissipative terms. We instead jump directly to the numerical results derived from the two mode master equation (6).
II.2 Multimode Multiphoton Processes
We use the Monte Carlo Wavefunction approach to numerically simulate the dynamics of this driven dissipative multimode system. In our simulation, the size of the Hilbert space needed grows as , with the photon cutoff for mode . The rapid growth of the dimension of the Hilbert limits the number of modes that can be incorporated into the simulation. Expectation values of relevant operators are followed and steady state values for the driven system are presented below. To compute two time correlation functions such as using this method, we have to employ a two step procedure RMP1998 , equivalent to the quantum regression theorem, but at the expense of requiring large numbers of walks to produce reliable results.
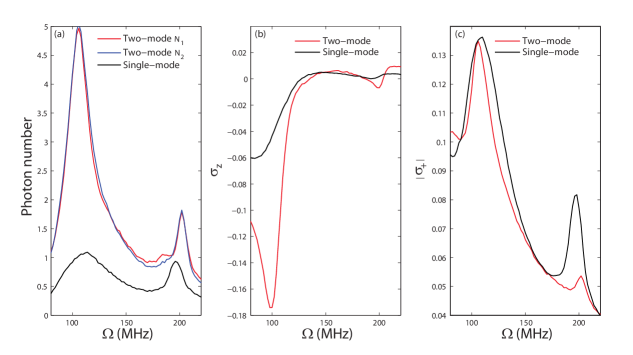
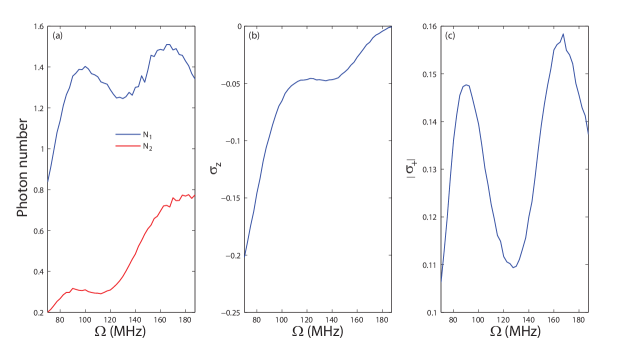
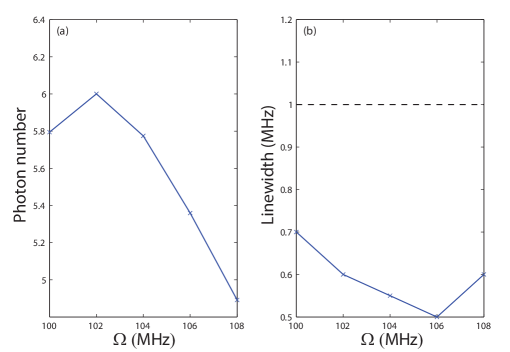
To explain the lobe structure and multimode fluorescence observed in our experiment, we first analyze two special limits of the two mode model. Resonant enhancement by multiphoton processes in a single mode (via the interaction , while tuning the qubit drive , leads to peaks in the steady state photon number near subharmonics of the Rabi rate . This is the physical origin of the lobe structure at far detuned modes in our massively multimode system, as is a good approximation for these modes. Fig. S4 presents numerical results for the special two mode case where the two modes are situated symmetrically around the qubit (and the drive which is resonant with it). Fluorescence at these two modes are equally and simultaneously enhanced. Moreover, the two peaks in photon number and qubit polarization deviate from the bare resonance conditions . The qubit inversion can go above . The results for a single mode model are also shown for comparison. While multiphoton resonances are apparent in both cases, the two mode system reaches much larger photon numbers in the steady state. The difference also appears in the spectral linewidth (see Fig. S6). While the single mode fluorescence shows no spectral narrowing, the spectral linewidth in the two mode model can be much smaller than the natural linewidth. Beside the simple two photon interaction in a single mode () analyzed above, the interaction vertex coupling two different modes () will result in resonant enhancement in modes near harmonics of the Rabi rate . This is demonstrated in Fig. 5 where another special two mode case () is investigated. Similarly to the previous case, this effect leads to co-enhancement of fluorescence at two modes, as evidenced by the brightening of the second mode at . As this is a second-order effect induced by the first mode, is much smaller than . For stronger coupling, we would expect the difference to be smaller.
In our strong coupling multimode system, all multimode multiphoton terms have to be taken into account, which makes the analysis very cumbersome. The competition between these processes will generally make resonances broader and less prominent. The numerical simulations qualitatively agree with our experimental results.
II.3 Multimode Spectral Narrowing
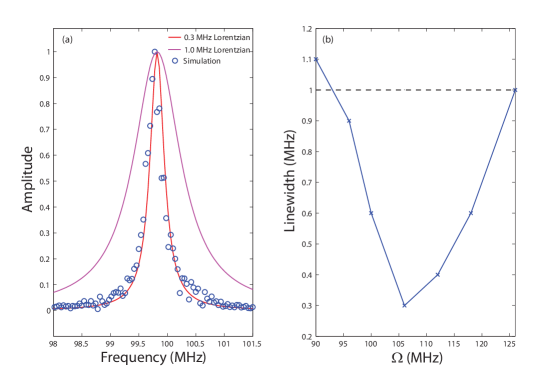
Ultranarrow resonance fluorescence has been predicted for the single mode cavity PRL1994 , where coherence between dressed states of the driven system arises from coupling to common vacuum fluctuations. The resultant spectrum linewidth of the mode could be much smaller than the natural linewidth of the bare system. In fact, the linewidth of the sideband is proportional to the inverse of the steady state photon number . We provide numerical evidence that this is also true in the multimode system. It is worth noting that reference PRL1994 only considered a special value of the parameters, where and . Here we generalize their result to explain our observations.
In Fig. S6, for the symmetric two mode system, it is shown that spectral narrowing appears for a range of the Rabi rate . Moreover, the linewidth is inversely proportional to the photon number (see also Fig. S4(a)) such that the linewidth reaches its minimum as the photon number reaches its maximum at . The left mode also shows the same amount of spectral narrowing (data not shown). The spectral narrowing in this simplified model doesn’t reach that of our experiments (a factor of in the simulation vs. in the experiment), yet it displays qualitively similar features. Moreover, the relation suggests that the linewidth could be made much narrower than that of the current simplified model, when reaching larger steady state photon numbers. For the interacting massively multimode system, the proliferation of the dressed states in the high excitation manifolds leads to enhanced generation of coherence among the dressed states from a collective interference, which relies on the near resonance of many dressed state level spacings. Concomitant with the collective suppression of dissipation for the steady state then is the rise in the steady state occupation. Simulations of such a massively multimode system demands more computational resources due to the growth of the Hilbert space. More extensive results will be presented elsewhere.
Spectral narrowing is generally very insensitive to the qubit frequency. For finite drive-qubit detuning , the effective Rabi rate is , with the amplitude of the drive. Based on the above analysis, spectral narrowing occurs when is within the range , where is again the mode frequency measured with respect to the drive (i.e. its detuning), and is generally determined by the number of modes, the coupling strength and the dissipation. For relatively small detuning and large Rabi rate , this gives a large effective range of qubit frequency over which narrowing occurs. It is worth noting that even if the drive is not resonant with the qubit and the two modes are not symmetric around the drive, spectral narrowing still exists in our simulation.
For a single mode system, it was argued that spectral narrowing requires that the qubit decay rate be comparable to the coupling strength , i.e. the moderate coupling regime PRL1994 . We therefore study the effect of qubit decay rate on steady state properties of the two mode system. Fig. S7(a) presents photon number versus Rabi rate for a different value. From this result, we conclude that spectral narrowing survives when going from moderate coupling to the strong coupling regime, which we attribute to the fact that the eigenstates of the multimode system in high excitation manifolds are more densely spaced than in the single mode system. Dynamically generated coherence between these closely spaced states then results in spectral narrowing of many modes simultaneously.
References
- (1) L. S. Bishop et al Nonlinear Response of the Vacuum Rabi Resonance, Nature Physics 5(2):105-109, (2008).
- (2) T. Quang et al Atomic Population Inversion and Enhancement of Resonance Fluorescence in a Cavity, Phys. Rev. A. 47, 2285 (1993).
- (3) M. Lewenstein et al Two-Photon Gain and Lasing in Strongly Driven Two-Level Atoms, Phys. Rev. Lett. 64, 3131 (1990).
- (4) H. Freedhoff et al Ultrasharp Lines in the Absorption and Fluorescence Spectra of an Atom in a Cavity, Phys. Rev. Lett. 72, 474 (1994).
- (5) M. B. Plenio et al The Quantum-Jump Approach to Dissipative Dynamics in Quantum Optics, Rev. Mod. Phys. 70, 101 (1998).