Multiwavelength campaign on the HBL PKS 2155-304 :
A new insight on its spectral energy distribution
Abstract
The blazar PKS 2155-304 was the target of a multiwavelength campaign from June to October 2013 which widely improves our knowledge of its spectral energy distribution. This campaign involved the NuSTAR satellite (3-79 keV), the Fermi Large Area Telescope (LAT, 100 MeV-300 GeV) and the High Energy Stereoscopic System (H.E.S.S.) array phase II (with an energy threshold of few tens of GeV). While the observations with NuSTAR extend the X-ray spectrum to higher energies than before, H.E.S.S. phase II, together with the use of the LAT PASS 8, enhance the coverage of the -ray regime with an unprecedented precision. In this work, preliminary results from the multi-wavelength analysis are presented.
I Introduction
Several new and upgraded instruments have come online in the last few years. In the X-ray regime, NuSTAR, using true focusing optics, is providing an unprecedented view of the hard-X-ray sky with its wide energy range (3-79 keV). In the very-high-energy -ray regime, H.E.S.S. is now operating with five telescopes including the largest Cherenkov telescope ever constructed. Additionally, a major upgrade to the Fermi-LAT instrumental response functions (IRFs), PASS 8 p8 , is now being implemented, increasing the sensitivity on the high-energy -ray sky.
The high frequency peaked BL Lac (HBL) object PKS 2155-304 was the target of a new multi-wavelength campaign from April to October 2013 involving these three instruments. This campaign provides a more complete coverage of the X-ray and -ray range than the previous campaign held in 2008, which involved Fermi, H.E.S.S. and also ATOM, Swift and RXTE and lasted for 11 days 2008 .
NuSTAR observed PKS 2155-304 multiple times, starting with a 40 ks observation in April 2013 designed for cross-calibration purposes of various high energy astrophysical instruments. Seven subsequent observations (lasting 10 ks each), in July, August, and September 2013, were scheduled to be strictly simultaneous with H.E.S.S., during local moonless night-time periods at the H.E.S.S. location. Furthermore, some independent observations of PKS 2155-304 were conducted with H.E.S.S. for calibration and monitoring purposes. In its normal operation mode, the Fermi-LAT is observing the full sky and each source is seen 30 minutes every 3 hours.
II Observations
II.1 H.E.S.S. Mono-mode
The H.E.S.S. experiment consists of an array of 5 telescopes: four diameter dish telescopes in operation since 2004 and and a fifth, CT5, a diameter dish, in operation since 2012. This yields an energy threshold of the instrument to be of the order of a few tens of GeV. The results of the first observations conducted with the fifth H.E.S.S. telescope standalone (in the so-called Mono-mode) are here presented in this work.
The data have been analysed with the Model analysis model with cuts adapted for this telescope. PKS 2155-304 is detected at a level of 26.4 in 35 hours of live time. The spectrum is well described by a simple power-law with an energy threshold of 98 GeV:
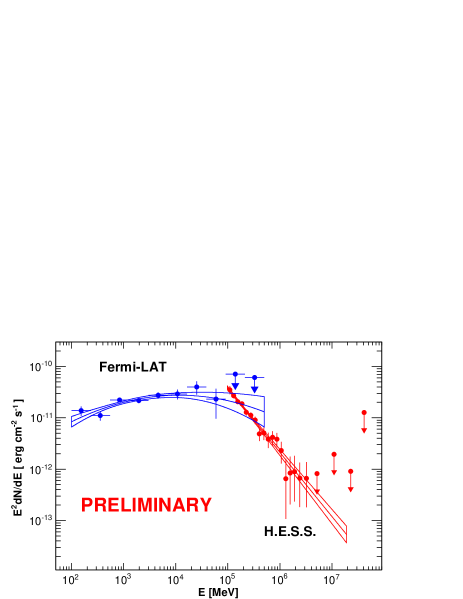
with the decorrelation energy. This spectrum is consistent with the source being at a low flux state, lower than the flux measured in 2008. Figure 1 presents the spectral energy distribution (SED) measured with CT5.
Variability has been found on the night-by-night light curve with a fractional excess variance , higher than what has been found in 2008.
II.2 Fermi-LAT data
The Fermi-LAT fermi data have been analysed using the ScienceTools v9R34P1 and the new PASS 8 IRFs yielding an extended energy range with respect to previous analysis and an increased effective area, better PSF and background rejection with respect to the PASS 7 IRFs.
Photons with an energy from 100 MeV to 500 GeV region of interest within 15 degrees of the source coordinates were used. Data have been analysed using a binned maximum likelihood analysis implemented in gtlike. The sky model has been built using the 4 years catalogue of point sources 3FGL and the spectrum is found to be best fitted by a log-parabola model of the form:
where , for an integrated flux above 100 MeV cm-2 s-1 (see Fig. 1).
The spectrum is found to be consistent with results obtained with PASS 7 IRFs but with increased statistic. No variability has been found in the Fermi light curve, nevertheless the flux is lower than the one measured in 2008 during the first Fermi-H.E.S.S. campaign on this object.
II.3 NuSTAR observations and results
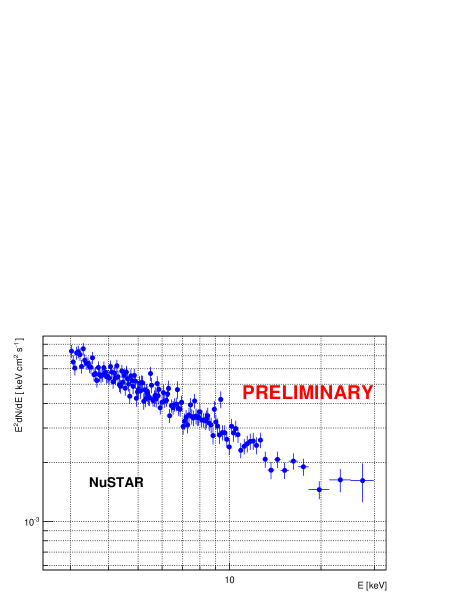
NuSTAR nustar consists of two co-aligned telescopes, and the data from both telescopes were fitted simultaneously to a spectral model using XSPEC. For all observations, the source was detected at high significance from the lower end of NuSTAR bandpass (3 keV) up to (typically) 40 keV. The data were reduced using the standard NuSTAR pipeline (NuSTARDAS) with the source extracted from a region in radius around the centroid of the source, and the background subtracted from a similarly sized source-free region. Each pointing was analyzed independently. We found that in all cases, the source was adequately fitted with a power law model.
Flux variability have been found from one observation to another and the NuSTAR spectrum seems to be steeper when the source is fainter (ranging roughly from 2.5 to 3) - a trend also seen in other HBL objects studied by NuSTAR.
We also searched for the onset of the inverse Compton component, expected to appear at some point in the hard X-ray/soft gamma-ray spectrum. Here, we searched for statistically significant improvement of the quality of fit with the addition of a hard (assumed ) spectral component. There is no clear indication for a presence of such component (primarily because the cosmic X-ray background and instrumental background become more significant at higher energies), and we can limit the flux of this component in the 20–40 keV band to be less than erg cm-2 s-1 (Fig. 2).
III Spectral energy distribution
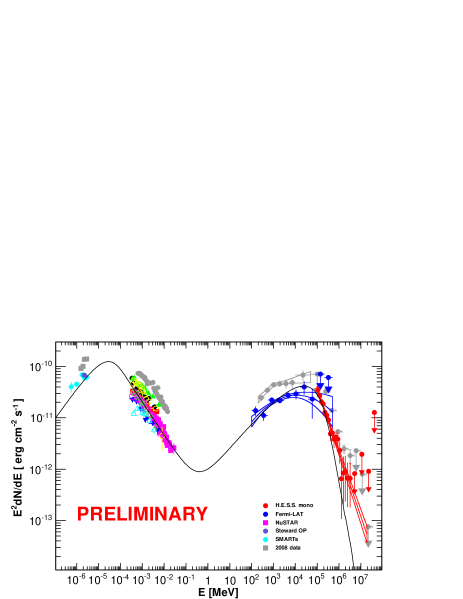
The time-averaged SED of the source measured from April to October 2013 is presented on Fig 3. In the optical wavelengths, data from the SMARTs smart and Steward Observatory sop programs have been used (light blue points). Nine exposures of Swift-XRT data have been analysed to extend the X-ray spectrum at lower energies. The archival data from 2008 are also shown for comparison. The source was at a lower flux state in all wavebands during the 2013 campaign.
A one zone synchrotron self-Compton model ssc has been used to reproduce the observed data. The emitting population of electrons is described by a broken power law with an index below and above for a total number of electrons of . The spherical zone of radius cm is filled with a constant magnetic field Gauss. The emission zone has a bulk Lorentz factor . The extragalactic background light absorption is taken into account using the model of fra .
The ratio of the escape time over the synchrotron cooling time is 0.3, between 0.3 and 3 as recommended by tav1998 . The particle energy density dominates the magnetic energy with an equipartition factor of . The broken power law shape used for the electrons distrubtion can be fitted in a restricted energy range by a curve model since the photon spectra is not strictly a broken power law. A more detailed SSC modelisation will be presented in a forecoming paper.
IV Conclusion
The HBL PKS 2155-304 has been observed in 2013 with NuSTAR, Fermi-LAT and H.E.S.S. (CT5) allowing the SED to be measured with an unprecedented precision. The source is found to be at a lower flux state in the -ray regime with respect to the campaign led in 2008.
No contamination of the X-ray flux by the inverse Compton component has been found in the NuSTAR data. The SED is well described be an one zone SSC model which is self-consistent and with a jet that is particle dominated.
Acknowledgments
The support of the Namibian authorities and of the University of Namibia in facilitating the construction and operation of H.E.S.S. is gratefully acknowledged, as is the support by the German Ministry for Education and Research (BMBF), the Max Planck Society, the French Ministry for Research, the CNRS-IN2P3 and the Astroparticle Interdisciplinary Programme of the CNRS, the U.K. Science and Technology Facilities Council (STFC), the IPNP of the Charles University, the Polish Ministry of Science and Higher Education, the South African Department of Science and Technology and National Research Foundation, and by the University of Namibia. We appreciate the excellent work of the technical support staff in Berlin, Durham, Hamburg, Heidelberg, Palaiseau, Paris, Saclay, and in Namibia in the construction and operation of the equipment.
The Fermi-LAT Collaboration acknowledges support for LAT development, operation and data analysis from NASA and DOE (United States), CEA/Irfu and IN2P3/CNRS (France), ASI and INFN (Italy), MEXT, KEK, and JAXA (Japan), and the K.A. Wallenberg Foundation, the Swedish Research Council and the National Space Board (Sweden). Science analysis support in the operations phase from INAF (Italy) and CNES (France) is also gratefully acknowledged.
The work of DS has been supported by the Investissements d’avenir, Labex ENIGMASS.
References
- (1) Aharonian, F.,et al. 2009, ApJl, 696, L150
- (2) Atwood, W. B., et al. 2009, ApJ, 697, 1071
- (3) Band, D. L. & Grindlay, J. E. 1985, ApJ, 298, 128
- (4) Bonning, E. et al. 2012, ApJ, 756, 13
- (5) Bruel, P. these proceedings
- (6) de Naurois, M. & Rolland, L. 2009, Astroparticle Physics, 32, 231
- (7) Franceschini, A., Rodighiero, G., & Vaccari, M. 2008, A&A, 487, 837
- (8) Harrison, F. A. al. 2013, ApJ, 770, 103
- (9) Tavecchio, F. et al. 1998, ApJ, 509, 608
- (10) The Fermi-LAT Collaboration 2015, submited to ApJ, arXiv:1501.02003
- (11) http://james.as.arizona.edu/~psmith/Fermi/