Emergence of the nematic electronic state in FeSe
Abstract
We present a comprehensive study of the evolution of the nematic electronic structure of FeSe using high resolution angle-resolved photoemission spectroscopy (ARPES), quantum oscillations in the normal state and elastoresistance measurements. Our high resolution ARPES allows us to track the Fermi surface deformation from four-fold to two-fold symmetry across the structural transition at K which is stabilized as a result of the dramatic splitting of bands associated with and character in the presence of strong electronic interactions. The low temperature Fermi surface is that of a compensated metal consisting of one hole and two electron bands and is fully determined by combining the knowledge from ARPES and quantum oscillations. A manifestation of the nematic state is the significant increase in the nematic susceptibility approaching the structural transition that we detect from our elastoresistance measurements on FeSe. The dramatic changes in electronic structure cannot be explained by the small lattice effects and, in the absence of magnetic fluctuations above the structural transition, point clearly towards an electronically driven transition in FeSe, stabilized by orbital-charge ordering.
A nematic state is a form of electronic order which breaks the rotational symmetries without changing the translational symmetry of the lattice, and this state may play an important role in understanding high temperature superconductivity. There has been great interest in determining such electron nematic states Fradkin et al. (2010), most recently in iron-based superconductors Fernandes et al. (2014). Several scenarios have been proposed to explain the observed nematicity based on phonon-driven and electronically-driven tetragonal symmetry breaking. As the lattice effects are very small and such a state is found in close proximity to a magnetic state, it has been suggested that the nematicity is generated by spin fluctuations and is a precursor of the incipient antiferromagnetic state Fernandes et al. (2014). Other models emphasizes the tendency towards orbital order for the Fe electrons in different local environments, resulting in the development of unequal occupancy of and orbitals which drives the symmetry-breaking, and the magnetism is stabilized as a consequence Lv et al. (2009). Electronic nematic order can be revealed through its strongly anisotropic resistivity and findings so far in iron-based superconductors have supported the spin-fluctuations scenario Chu et al. (2012a); Kuo et al. (2013). Understanding the dominant electronic interactions is of great importance, for they could determine the symmetry and properties of the superconducting state Fernandes et al. (2014).
With a superconducting transition of K, FeSe is a special case amongst Fe-based superconductors, since it undergoes a structural transition at K but does not order magnetically at any temperature. It has also attracted a lot of interest due to the strong increase in to 37 K under pressure Medvedev et al. (2009), the existence of high- intercalates of FeSe Burrard-Lucas et al. (2013) and, that a monolayer of FeSe grown on SrTiO3 could have its superconducting transition temperature in excess of 100 K Ge et al. (2014). The availability of high quality bulk crystals, grown using chemical vapour transport Böhmer et al. (2013), have recently re-opened investigations into the electronic properties of FeSe. ARPES has found evidence of a large band splitting caused by orbital ordering below the structural transition Nakayama et al. (2014); Shimojima et al. (2014) but the resolution of the available data cannot clarify the changes that occur at the Fermi level. Moreover, quantum oscillation experiments at low temperatures have detected an unusually small Fermi surface Terashima et al. (2014); Audouard et al. (2014). As magnetic fluctuations are detected only below the structural transition in FeSe, it is expected that they are not the driving force for this transition Böhmer et al. (2015); Baek et al. (2015). Thus, the nature of the structural transition in FeSe is rather unusual and how the electronic structure is stabilized by breaking of the rotational symmetry could be the key to understanding its superconductivity and how it can be further enhanced.
In this paper we explore the electronic structure of FeSe by using high-resolution ARPES, quantum oscillations and elastoresistivity measurements on the same batch of high-quality FeSe single crystals. These techniques provide a comprehensive picture of the evolution of the electronic structure of FeSe from the high-temperature tetragonal phase through the fourfold-symmetry-breaking structural transition at and into the electronic nematic phase. We observe strong in-plane -wave like deformation of the Fermi surface from four-fold to two-fold symmetry as a result of band splitting with and character. A direct manifestation of a nematic Fermi surface of FeSe, is the significant increase in the nematic susceptibility measured by elastoresistance measurements when approaching , not emerging due to anisotropic magnetic fluctuations but being driven by the orbital/charge degrees of freedom. The low temperature Fermi surface, based on our high resolution data from ARPES and quantum oscillations, consist of an in-plane distorted quasi-two dimensional hole band and two electron bands; the inner electron pocket is extremely elongated and quasi-two dimensional, whereas the outer electron band, with predominantly character, is not detected by ARPES but is present in quantum oscillations. The high-temperature bands have orbital dependent band renormalisation, with respect to band structure calculations, due to many-body interactions, which are particularly significant for the band; this leads to a significant shrinkage of the Fermi surfaces (a factor of 5, compared with calculations). Our measurements also detect the band splitting induced by spin-orbit coupling ( meV at the point).
Experimental details Samples were grown by the KCl/AlCl3 chemical vapour transport method. Magnetotransport measurements were performed as function of in-situ rotation in high magnetic field up to 33 T at HFML in Nijmegen, using an excitation current of 0.8 mA. Good electrical contacts were achieved by using In solder. Quantum oscillations were observed in more than three samples with good agreement. ARPES measurements were performed at the I05 beamline of Diamond Light Source, UK. Single crystal samples were cleaved in-situ in a vacuum lower than 210-10 mbar and measured at temperatures ranging from 6-120 K. Measurements were performed using linearly-polarised synchrotron light from 20-120 eV and employing Scienta R4000 hemispherical electron energy analyser with an angular resolution of 0.2-0.5 deg and an energy resolution of 3 meV. Elastoresistance measurements were performed by measuring the in-plane anisotropic transport properties while straining the crystals along the [110] direction in the tetragonal phase, by applying a voltage to a piezoelectric stack, similar to those discussed in Ref. Kuo et al. (2013) and detailed in SM. Band structure calculations were performed using the experimental crystal structure of FeSe in Wien2k using the GGA approximation with spin-orbit coupling included. Since FeSe does not show magnetic order, ARPES spectra are compared to non-spin-polarized band structure, with the relaxed lattice parameters, Å, = 5.5178 Å, = 0.24128 Kumar et al. (2012).
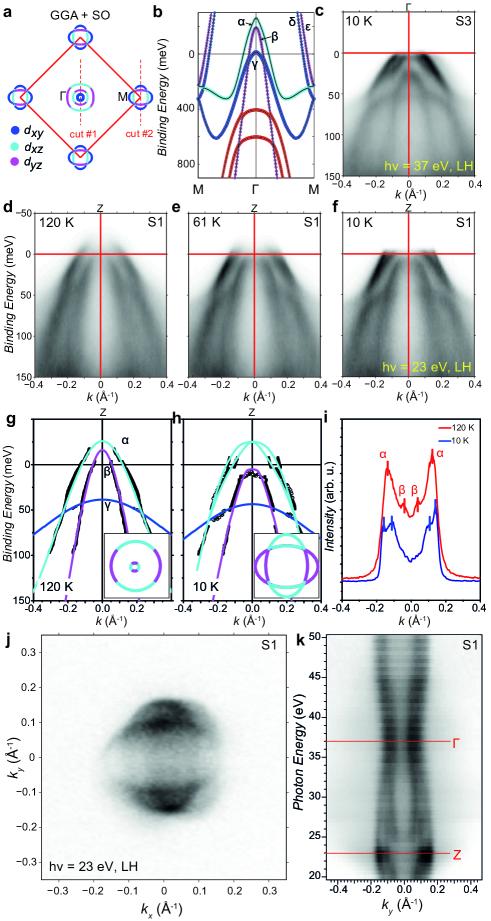
Temperature dependence of the hole bands. Fig. 1a shows the calculated Fermi surface of FeSe in the tetragonal paramagnetic phase, which consists of three hole pockets (, and ) around the Brillouin zone center () and two electron-like pockets ( and ), similar to other reports Maletz et al. (2014). The bands which cross the Fermi level have mainly , and character (Fig.1a and b). Due to the matrix elements effects in ARPES experiments the light polarization and the scattering geometry allows us to select mainly either or bands using LH () or LV ()-polarization, respectively, and to identify the orbital character of the measured bands, as shown in Supplementary Material (SM) and detailed in Ref. Zhang et al., 2012.
Fig. 1d-f show the evolution of the hole bands by performing high-symmetry cuts, either through M--M () or A-Z-A (), as shown in Fig. 1c-f as a function of temperature. In the high-temperature tetragonal phase with preserved rotational symmetry, both and bands cross the Fermi level at the Z point, as shown by the Fermi-level momentum distribution curves (MDCs) at 120 K in Fig.1i. The degeneracy between the and bands is lifted by the spin-orbit coupling Cvetkovic and Vafek (2013) which we can directly estimate from our data as being meV, similar to results reported for LiFeAs Borisenko et al. (2014). On lowering the temperature below the structural transition at K (Fig.1f), the band at Z is pushed below the Fermi level, as shown in Fig. 1. About meV below the Fermi level we also detect the presence of a broad band that is the band, , in Fig. 1g, having weaker intensity due to matrix elements and being shifted significantly in relation to the band structure calculations for the tetragonal structure in Fig. 1b. The effect of the loss of rotational symmetry through the structural transition from tetragonal to orthorhombic symmetry at is clearly observed in the detailed Fermi surface map at the Z point, showing that the pocket elongates to become elliptical, shown in Fig.1h and j. Due to the natural twinning of the samples, however, we observe two ellipses (in Fig.1h) rotated 90∘ with respect to each other. The dependence can be determined by measuring the Fermi-level MDC as a function of incident photon energy, shown in Fig. 1k; we detect a quasi-two dimensional shape for the hole pocket, the only hole band that crosses the Fermi level at low temperature. The experimental area for the hole bands, at 120 K is strongly reduced by a factor 5, as compared with band structure calculations in the tetragonal phase (see SM) and we will later discuss the consistency with our quantum oscillations results at low temperatures (see Table 1 in SM).
The effect of electronic correlations can be estimated by comparing band structure calculations with the band dispersion in the tetragonal phase at 120 K, as shown in Fig. 1g. The obtained band renormalisation factors for FeSe are 3.2, 2.1 and 8 for the , and pockets respectively - suggesting particularly strong orbital-dependent electronic correlations on the band with orbital character. These values are close to those reported for FeSe in Ref. Maletz et al. (2014), whereas in the case of FeSexTe1-x, the band-selective renormalization varies strongly with values between 1 and 17 Tamai et al. (2010), the significantly higher value being assigned to the band. Band structure calculations including correlations (DMFT) on FeSe Yin et al. (2012) give band renormalisations of 2.8 for the orbitals, comparable to the measured values, whereas the predicted value of 3.5 for the band is smaller than in experiments.
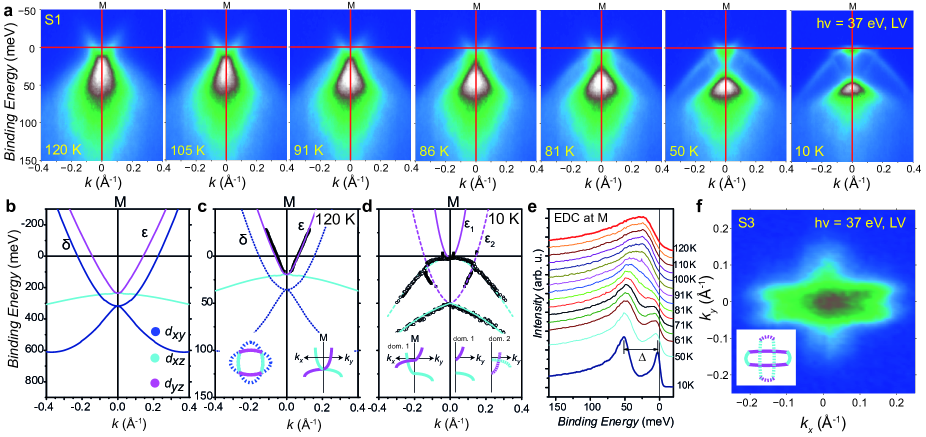
Temperature dependence of the electron-like bands. We now focus on the temperature dependence of the electron-like bands in FeSe shown in Fig. 2a, visualizing the dramatic changes occurring through the structural transition. In the high-temperature tetragonal phase of FeSe, band structure calculations predict two cylindrical electron pockets, as shown in Fig. 1a and Fig. 2b. The outer electron-like band (labelled ) has a dominant character whereas the inner electron band (labelled ) has orbital character. At high temperatures (120 K), the inner band has a strong intensity at the M point, where bands disperse both along and perpendicular to the cut direction and are four-fold degenerate, as shown in Fig.2a. However, a combination of low intensity caused by matrix element effects for the orbital Zhang et al. (2012), as well as broadening due to either impurity scattering Ye et al. (2014) or strong correlations may cause band incoherence Lanatà et al. (2013); Yin et al. (2012) and difficulty to observe the band in ARPES at the M point Shimojima et al. (2014); Mandal et al. (2014); Tan et al. (2013).
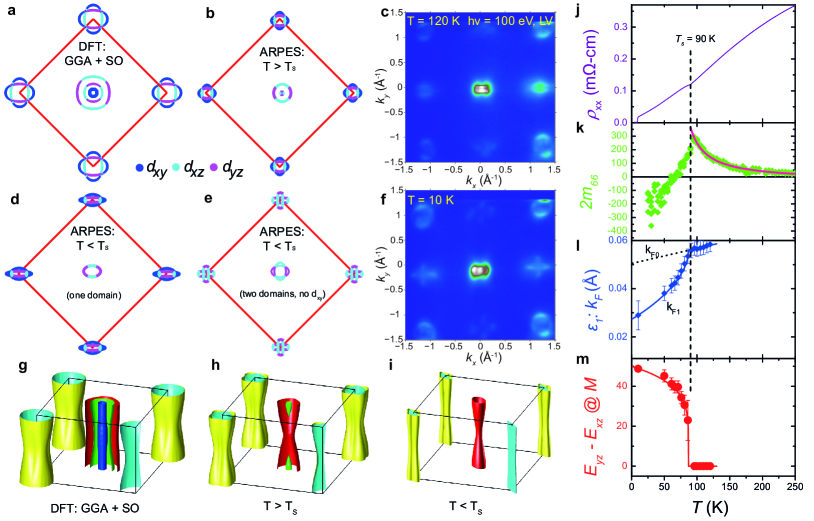
Following the temperature dependence of the inner electron bands with orbital character, in the experimental -M- cut (cut 2 in Fig.1a), the band crossing the Fermi level would have character, whereas the downwards dispersing band from the M point would have character (see Fig. 2c). Below the structural transition which breaks the rotational symmetry, we observe a large band splitting which can only occur if the degeneracy is broken and the and orbitals develop an unequal occupation. As a result, the band moves up ( in Fig. 2d), and the band moves down (solid lines), but for the other structural domain the opposite occurs, the band moves up and the () moves down indicated by the dashed lines in Fig. 2d and further detailed in SM ( and are defined in the experimental coordinate frame). This picture is consistent with that suggested from ARPES studies on detwinned crystals of FeSe Shimojima et al. (2014), but the high resolution of our data allows us to detect the precise changes in the Fermi surface across the transition. The large band splitting of meV at the M point at 10 K (Fig. 2e) indicates the lifting of of and degeneracy in FeSe. This was also observed in NaFeAs and BaFe2As2 over a very limited temperature range between the structural transition and magnetic transition, Yi et al. (2011, 2012); He et al. (2010); Zhang et al. (2012). In FeSe, this dramatic energetic shift observed below is much larger than that expected from a simple structural orthorhombic distortion of (()/()), which would cause a 17 meV shift in the absence of the renormalization effects (see SM). At the Fermi level, the resulting electron pocket is strongly elongated, with a Å-1 and Å-1. However, due to twinning, the Fermi surface consists of two ellipses at 90∘ to each other, resulting in a cross-shaped Fermi surface (Fig. 2f), similar to the hole pocket. The degree of Fermi surface distortion is measured by the temperature dependence of , and the ellipticity (), shown in Fig. 4l, is suggestive of an order parameter of a second order phase transition at . Thus, the observed experimental elongation of both the electron and hole pockets at low temperatures in FeSe can be thought of as a consequence of the electronic anisotropy induced by orbital ordering in the presence of interactions. Another possible scenario for this behaviour can be thought as a Pomeranchuk instability Pomeranchuk (1958) that results in the spontaneous deformation of the Fermi surface from a four-fold symmetric almost circular shape at high temperature to an elliptical shape at low temperatures. In either cases, this electronically-induced Fermi surface deformation is also supported by the small specific heat jump at compatible with an electronic contribution Böhmer et al. (2013).
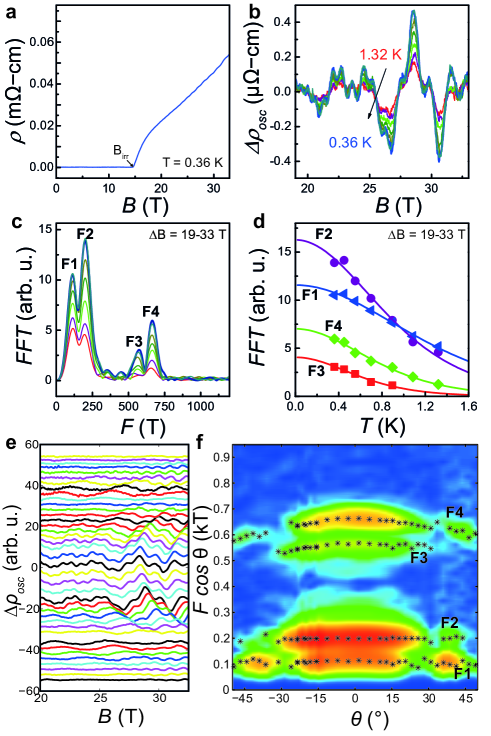
Comparison with quantum oscillations. In order to provide a complete and consistent picture of the Fermi surface of FeSe, we have also measured quantum oscillations in samples from the same batch used in the ARPES experiments. Quantum oscillations are a powerful technique that allows precise determination of cross-sectional areas of the Fermi surface and the corresponding orbitally-averaged quasiparticle masses but it usually needs to rely on band structure or ARPES to provide the exact -space location of these orbits. Magnetotransport measurements are performed in the normal state of FeSe at very low temperatures and high magnetic fields, as shown in Fig. 3a. The oscillatory signal, periodic in , is made clear by subtracting a high order polynomial from the raw data in Fig. 3b. The fast Fourier transform of shown in Fig. 3c, identifies four different quantum oscillation frequencies, labelled in ascending order, that are directly linked to the extremal areas on the Fermi surface by the Onsager relation, , for a particular field orientation. All frequencies are lower than 1 kT in agreement with previous reports Terashima et al. (2014); Audouard et al. (2014). This is smaller than the frequencies of other iron-based superconductors that do not show any Fermi surface reconstruction, such as LaFePO Coldea et al. (2008) or LiFeAsPutzke et al. (2012). Band structure calculations predict the existence of five different quasi-two dimensional cylinders with sizes (1-2.6 kT), much larger than those found in experiments (below 1 kT) (see SM). The angular dependence of these frequencies also suggest a quasi-two dimensional nature of these bands (see that the angular dependence of frequencies varies almost like in Fig.3f), and previous studies have suggested that at low temperatures FeSe has either only quasi-two dimensional electron bands or electron and hole bands Terashima et al. (2014).
The cyclotron-averaged effective masses of the quasiparticles, extracted from the temperature-dependence of the quantum oscillations amplitudes (Fig.3d) for each orbit, are listed in Table 1 in SM). We find a reasonably good agreement between the values of the effective masses for our different samples with those reported previously in Ref. Terashima et al., 2014; Audouard et al., 2014. The and orbits have similar effective masses of around 4 , which may indicate that they originate from the same band, but with different -values, as in the case of a corrugated quasi-two dimensional band, whereas the orbit has a particularly heavy effective mass of , in agreement with other reports Terashima et al. (2014). However, in the case of the pocket there is a variation of the quasiparticle masses between 0.7(2) Audouard et al. (2014) to 3(1) . The strong disparity between the lighter masses and the heavier masses of points towards different band origin for these orbits at the Fermi level.
Next, we compare the absolute size of the different values at the Fermi level extracted from ARPES with those from quantum oscillations (Table 1 in SM). At low temperatures, ARPES detects a single quasi-two dimensional hole band (see Fig. 1k) along the (Z) direction, which has a two-fold symmetry, with a maximum area around Z and minimum around , and a small carrier density of 2.53 cm-3. Similarly, ARPES gives clear indication of the presence of an electron-band centered at M which is a strongly elongated cylinder, but it is lacking the information concerning the behaviour of the outer electron-like band crossing the Fermi level, which may be present according to band structure calculations. Since ARPES data suggest that there is only one hole pocket but possibly more than one electron pocket, the largest maximum orbit observed in quantum oscillations, , must corresponds to the hole pocket in order to maintain charge balance in the system; thus two quantum oscillation frequencies with similar effective masses, and , belong to this quasi-two dimensional hole band, in close agreement with the size of this quasi-two dimensional band detected from ARPES (Fig.1k). Furthermore, the frequency in quantum oscillations has a substantially larger effective mass than all the other frequencies, which is of similar value to the band renormalization found in the ARPES experiments for the band ( in Fig.1g), suggesting that the outer electron pocket that is detected in quantum oscillations but not in ARPES has character. The inner elongated electron band from ARPES (with areas smaller than 100 T), can be assigned to the frequencies, as this band is almost two-dimensional (as in seen at the A-point in Fig.1 in SM). Thus, by combining the knowledge about the sizes and quasiparticle masses from the ARPES and quantum oscillations data, we suggest that bulk FeSe at low temperatures has one hole and two-electron bands, as represented schematically in Fig.4. There are some small discrepancies in the absolute values of the cross section areas extracted from ARPES and quantum oscillations, but these could be caused by field-induced Fermi surface effects in quantum oscillations or possible surface effects in ARPES. This interpretation is also consistent with the three-band description of a recent magnetotransport study on FeSe Watson et al. (2015), in which a very small high mobility carrier was also detected, in agreement with the size of small electron band from our ARPES data. It is important to note that our measured electronic structure of bulk FeSe is similar to that of multilayers of FeSe on SrTiO3, in which the splitting of bands at the M point was wrongly assigned to a possible formation of a spin-density wave Tan et al. (2013). However, the FeSe monolayer is rather different and its electronic and high superconducting state was suggested to be influenced by the SrTiO3 substrate Lee et al. (2013).
One important finding from our the experimental studies of the electronic structure of FeSe is that the band structure calculations significantly overestimate the size of the Fermi surface of FeSe, even in the tetragonal phase. Shrinking of Fermi surfaces in other iron-based superconductors has been assigned to the interband coupling to a bosonic mode in LaFePO, Ortenzi et al. (2009), and/or the strength of the antiferromagnetic correlations close to a quantum critical point in BaFe2(As1-xPx)2 Shishido et al. (2010). It is clear that in FeSe, the significant shrinking of the Fermi surface, combined with the strong renormalization effects both in ARPES and quantum oscillations as evidenced by the relatively large effective masses of 4-8 and the orbital-dependent correlations (largest for the band) suggest that the electronic correlations significantly affect the electronic structure of FeSe.
The nematic susceptibility of FeSe. A clear manifestation of a nematic Fermi surface is its strong in-plane anisotropy in transport properties and sensitivity to external parameters, in particular in-plane strain. The resistivity anisotropy is determined by both the electronic structure and the scattering, and the expected Fermi surface deformation give rise naturally to anisotropic electronic properties, whereas the spin-nematic ordering leads to an anisotropy of the electron scattering Chu et al. (2012a).
Fig.4k shows the induced change in resistivity to in-plane strain measured by the parameter from elastoresistance tensor in FeSe, which provides a direct measure of the electronic nematic order parameter, as detailed in Fig.SM5 and in Ref.Kuo et al., 2013. We observe a large increase in approaching , similar to large divergent behaviour observed in Ba(Fe/Co)2As2 Kuo et al. (2013); Chu et al. (2012b), but of even larger magnitude. The data on FeSe can be well-described by a fit to the function , which gives K and =-31(3) (solid line in Fig.4k). Recently, nematic susceptibility measurements of the elastic shear modulus, which probe the lattice response to strain, suggest that the structural transition in FeSe is accompanied by a large shear-modulus softening, identical to that of underdoped Ba(Fe,Co)2As2, implying a very similar strength of the electron-lattice coupling, which is much smaller than the electronic response Böhmer et al. (2015).
The sign of is also opposite to what is found in the electron-doped pnictides, but similar to FeTe Zhang et al. (2012), where it was suggested that the resistance along the (AFM) direction is larger than that along axis (FM direction)Zhang et al. (2012). However, a small sign-change of the in-plane anisotropy was also found for highly hole doped (Ba/K)Fe2As2 Blomberg et al. (2012). This may suggest that the positive sign of may be either a general feature of chalcogenides, as opposed to most of the pnictides, or it is also possible that the development of the anisotropic properties in all these systems may be driven by a different mechanism.
Below the structural transition, , the behaviour of is rather striking, having an almost linear temperature dependence with no sign of saturation, as the degree of ellipticity grows larger (see Fig.4l); it changes sign around 65 K, which, coincidentally, is the same scale as the value of determined earlier. While the interpretation of nematic susceptibility below may be difficult due to domain formation and the fact that the nematic order parameter now takes a finite value, we suggest that one possible explanation for this crossover may be linked to the development of anisotropic scattering from spin-fluctuation, which become strong below Baek et al. (2015); Böhmer et al. (2015). Sign-change of the in-plane anisotropy has been found between the electron and hole-doped BaFe2As2 Blomberg et al. (2012), being assigned to differences in the spin fluctuations scattering rates corresponding to different Fermi velocities at the hot-spots for electron- and hole-doped systems Breitkreiz et al. (2014); Blomberg et al. (2012). Magnetotransport studies in FeSe also suggest that anisotropic scattering may develop below Watson et al. (2015).
As the size of our measured nematic susceptibility is much larger than the response of the lattice Böhmer et al. (2015), we suggest that the structural transition in FeSe is electronically driven and is an instability of the electronic structure which breaks tetragonal symmetry, with the lattice orthorhombicity simply responding to these electronic changes. Furthermore, the absence of spin-fluctuations above indicates that the structural transition in FeSe is not magnetically-driven Baek et al. (2015); Böhmer et al. (2015). Thus, our resistivity anisotropy measurements favor an orbital/charge ordering scenario, which show a strong splitting of the bands with and orbital character, (Fig.2 and summarized in Fig.4m) and it is likely responsible for the in-plane Fermi surface deformation which give rise to significant anisotropy in the in-plane electronic structure.
While the orbital ordering scenario is a likely contender to explain the existing data on FeSe, the Fermi surface deformation and its relatively constant volume conservation (small changes occur due to the temperature dependence of the lattice parameters) bears the similarities of a - Pomeranchuck instability. An isotropic Fermi liquid in the presence of sufficiently strong interactions was predicted by Pomeranchuk to be unstable Pomeranchuk (1958) and as a signature of this instability the Fermi surface would spontaneously deform, changing its shape or topology to lower its energy and break the rotational symmetry, similar to what is observed in FeSe at the Fermi level. The two scenarios are likely to generate different kinds of pairing interactions either at finite momentum Kontani and Onari (2010) or at zero momentum Halboth and Metzner (2000) and future theoretical work will need to address these issues.
In summary, we report a comprehensive study of the development of the nematic phase in FeSe. The Fermi surface of FeSe undergoes a spontaneous distortion from fourfold-symmetric to two-fold symmetric elliptical pockets. The symmetry breaking arises from the electronic degrees of freedom and, in the absence of magnetism, it is likely to be caused by orbital ordering in the presence of strong interactions. The elongated Fermi surface causes strongly anisotropic electronic properties and enhanced nematic suceptibility. This nematic electronic phase is that from which superconductivity emerges, which is suggested to have a two-fold gap symmetry Song et al. (2011). While interactions favoring orbital ordering dominate near , magnetic fluctuations grow towards , and may still assist the superconducting pairing. Moreover, the existence of a relatively flat hole band just below the Fermi level at the M point raises the question if whether the presence of van Hove singularities could also play a role in pairing. Given the observed small and strongly anisotropic Fermi surfaces with low carrier densities, it is perhaps not surprising that the physical properties, including the superconducting and structural transitions are susceptible to external parameters (e.g. pressure, strain, doping) so that controlling these one could turn FeSe into a high-temperature superconductor.
Acknowledgements We acknowledge fruitful discussions with B. Andersen, A. Chubukov, R. Fernandes, P. Hirschfeld, L. Gannon, Z. Liu, L. de’Medici, J. C. A. Prentice, R. Valenti, I. Vekter, T. Shibauchi and P. Dudin. This work was mainly supported by EPSRC (EP/L001772/1, EP/I004475/1, EP/I017836/1). We thank Diamond Light Source for access to beamline I05 (proposal number SI9911) that contributed to the results presented here. Part of the work was performed at the HFML, member of the European Magnetic Field Laboratory (EMFL). The authors would like to acknowledge the use of the University of Oxford Advanced Research Computing (ARC) facility in carrying out part of this work. AIC and AJS are grateful to KITP centre for hospitality which was supported in part by the National Science Foundation under Grant No. NSF PHY11-25915. YLC acknowledges the support from the EPSRC (UK) grant EP/K04074X/1 and a DARPA (US) MESO project (no. N66001-11-1-4105). AIC acknowledges an EPSRC Career Acceleration Fellowship (EP/I004475/1).
References
- Fradkin et al. (2010) E. Fradkin, S. A. Kivelson, M. J. Lawler, J. P. Eisenstein, and A. P. Mackenzie, Annual Review of Condensed Matter Physics 1, 153 (2010).
- Fernandes et al. (2014) R. M. Fernandes, A. V. Chubukov, and J. Schmalian, Nature Physics 10, 97–104 (2014).
- Lv et al. (2009) W. Lv, J. Wu, and P. Phillips, Phys. Rev. B 80, 224506 (2009).
- Chu et al. (2012a) J.-H. Chu, H.-H. Kuo, J. G. Analytis, and I. R. Fisher, Science 337, 710 (2012a).
- Kuo et al. (2013) H.-H. Kuo, M. C. Shapiro, S. C. Riggs, and I. R. Fisher, Phys. Rev. B 88, 085113 (2013).
- Medvedev et al. (2009) S. Medvedev, T. M. McQueen, I. A. Troyan, T. Palasyuk, M. I. Eremets, R. J. Cava, S. Naghavi, F. Casper, V. Ksenofontov, G. Wortmann, and C. Felser, Nat. Mater. 8, 630 (2009).
- Burrard-Lucas et al. (2013) M. Burrard-Lucas, D. G. Free, S. J. Sedlmaier, J. D. Wright, S. J. Cassidy, Y. Hara, A. J. Corkett, T. Lancaster, P. J. Baker, S. J. Blundell, and S. J. Clarke, Nat. Mater. 12, 15 (2013).
- Ge et al. (2014) J.-F. Ge, Z.-L. Liu, C. Liu, C.-L. Gao, D. Qian, Q.-K. Xue, Y. Liu, and J.-F. Jia, Nat Mater advance online publication (2014).
- Böhmer et al. (2013) A. E. Böhmer, F. Hardy, F. Eilers, D. Ernst, P. Adelmann, P. Schweiss, T. Wolf, and C. Meingast, Phys. Rev. B 87, 180505 (2013).
- Nakayama et al. (2014) K. Nakayama, Y. Miyata, G. N. Phan, T. Sato, Y. Tanabe, T. Urata, K. Tanigaki, and T. Takahashi, Phys. Rev. Lett. 113, 237001 (2014).
- Shimojima et al. (2014) T. Shimojima, Y. Suzuki, T. Sonobe, A. Nakamura, M. Sakano, J. Omachi, K. Yoshioka, M. Kuwata-Gonokami, K. Ono, H. Kumigashira, A. E. Böhmer, F. Hardy, T. Wolf, C. Meingast, H. v. Löhneysen, H. Ikeda, and K. Ishizaka, Phys. Rev. B 90, 121111 (2014).
- Terashima et al. (2014) T. Terashima, N. Kikugawa, A. Kiswandhi, E.-S. Choi, J. S. Brooks, S. Kasahara, T. Watashige, H. Ikeda, T. Shibauchi, Y. Matsuda, T. Wolf, A. E. Böhmer, F. Hardy, C. Meingast, H. v. Löhneysen, M.-T. Suzuki, R. Arita, and S. Uji, Phys. Rev. B 90, 144517 (2014).
- Audouard et al. (2014) A. Audouard, L. Drigo, P. Duc, Fabienne Toulemonde, S. Karlsson, P. Strobel, and A. Sulpice, arXiv:1409.6003 (2014).
- Böhmer et al. (2015) E. Böhmer, A., T. Arai, F. Hardy, T. Hattori, T. Iye, T. Wolf, v. Löhneysen, H., K. Ishida, and C. Meingast, Phys. Rev. Lett. 114, 027001 (2015).
- Baek et al. (2015) S.-H. Baek, D. V. Efremov, J. M. Ok, J. S. Kim, J. van den Brink, and B. Büchner, Nat. Mat. 14 (2015).
- Kumar et al. (2012) J. Kumar, S. Auluck, P. K. Ahluwalia, and V. P. S. Awana, Supercond. Sci. Technol. 25, 095002 (2012).
- Maletz et al. (2014) J. Maletz, V. B. Zabolotnyy, D. V. Evtushinsky, S. Thirupathaiah, A. U. B. Wolter, L. Harnagea, A. N. Yaresko, A. N. Vasiliev, D. A. Chareev, A. E. Böhmer, F. Hardy, T. Wolf, C. Meingast, E. D. L. Rienks, B. Büchner, and S. V. Borisenko, Phys. Rev. B 89, 220506 (2014).
- Zhang et al. (2012) Y. Zhang, C. He, Z. R. Ye, J. Jiang, F. Chen, M. Xu, Q. Q. Ge, B. P. Xie, J. Wei, M. Aeschlimann, X. Y. Cui, M. Shi, J. P. Hu, and D. L. Feng, Phys. Rev. B 85, 085121 (2012).
- Cvetkovic and Vafek (2013) V. Cvetkovic and O. Vafek, Phys. Rev. B 88, 134510 (2013).
- Borisenko et al. (2014) S. Borisenko, D. Evtushinsky, I. Morozov, S. Wurmehl, B. Buchner, A. Yaresko, T. Kim, and M. Hoesch, arXiv:1409.8669 (2014).
- Tamai et al. (2010) A. Tamai, A. Y. Ganin, E. Rozbicki, J. Bacsa, W. Meevasana, P. D. C. King, M. Caffio, R. Schaub, S. Margadonna, K. Prassides, M. J. Rosseinsky, and F. Baumberger, Phys. Rev. Lett. 104, 097002 (2010).
- Yin et al. (2012) Z. P. Yin, K. Haule, and G. Kotliar, Phys. Rev. B 86, 195141 (2012).
- Ye et al. (2014) Z. R. Ye, Y. Zhang, F. Chen, M. Xu, J. Jiang, X. H. Niu, C. H. P. Wen, L. Y. Xing, X. C. Wang, C. Q. Jin, B. P. Xie, and D. L. Feng, Phys. Rev. X 4, 031041 (2014).
- Lanatà et al. (2013) N. Lanatà, H. U. R. Strand, G. Giovannetti, B. Hellsing, L. de’ Medici, and M. Capone, Phys. Rev. B 87, 045122 (2013).
- Mandal et al. (2014) S. Mandal, R. E. Cohen, and K. Haule, Phys. Rev. B 89, 220502 (2014).
- Tan et al. (2013) S. Tan, Y. Zhang, M. Xia, Z. Ye, F. Chen, X. Xie, R. Peng, D. Xu, Q. Fan, H. Xu, J. Jiang, T. Zhang, X. Lai, T. Xiang, J. Hu, B. Xie, and D. Feng, Nat. Mater. 12, 634 (2013).
- Yi et al. (2011) M. Yi, D. Lu, J.-H. Chu, J. G. Analytis, A. P. Sorini, A. F. Kemper, B. Moritz, S.-K. Mo, R. G. Moore, M. Hashimoto, W.-S. Lee, Z. Hussain, T. P. Devereaux, I. R. Fisher, and Z.-X. Shen, Proceedings of the National Academy of Sciences 108, 6878 (2011).
- Yi et al. (2012) M. Yi, D. H. Lu, R. G. Moore, K. Kihou, C.-H. Lee, a. Iyo, H. Eisaki, T. Yoshida, a. Fujimori, and Z.-X. Shen, New J. Phys. 14, 073019 (2012).
- He et al. (2010) C. He, Y. Zhang, B. P. Xie, X. F. Wang, L. X. Yang, B. Zhou, F. Chen, M. Arita, K. Shimada, H. Namatame, M. Taniguchi, X. H. Chen, J. P. Hu, and D. L. Feng, Phys. Rev. Lett. 105, 117002 (2010).
- Pomeranchuk (1958) I. I. Pomeranchuk, JETP Letters 35, 524 (1958).
- Coldea et al. (2008) A. I. Coldea, J. D. Fletcher, A. Carrington, J. G. Analytis, A. F. Bangura, J.-H. Chu, A. S. Erickson, I. R. Fisher, N. E. Hussey, and R. D. McDonald, Phys. Rev. Lett. 101, 216402 (2008).
- Putzke et al. (2012) C. Putzke, A. I. Coldea, I. Guillamón, D. Vignolles, A. McCollam, D. LeBoeuf, M. D. Watson, I. I. Mazin, S. Kasahara, T. Terashima, T. Shibauchi, Y. Matsuda, and A. Carrington, Phys. Rev. Lett. 108, 047002 (2012).
- Watson et al. (2015) M. D. Watson, T. Yamashita, S. Kasahara, W. Knafo, M. Nardone, F. Beard, F. Hardy, A. McCollam, A. Narayanan, S. F. Blake, T. Wolf, A. A. Haghighirad, C. Meingast, A. J. Schofield, H. v. Löhneysen, Y. Matsuda, A. I. Coldea, and T. Shibauchi, in preparation (2015).
- Lee et al. (2013) J. J. Lee, F. T. Schmitt, R. G. Moore, S. Johnston, Y.-T. Cui, W. Li, M. Yi, M. Liu, Z. K. Hashimoto, Y. Zhang, D. H. Lu, T. P. Devereaux, D. H. Lee, and Z.-X. Shen, arXiv:1312.2633 (2013).
- Ortenzi et al. (2009) L. Ortenzi, E. Cappelluti, L. Benfatto, and L. Pietronero, Phys. Rev. Lett. 103, 046404 (2009).
- Shishido et al. (2010) H. Shishido, A. F. Bangura, A. I. Coldea, S. Tonegawa, K. Hashimoto, S. Kasahara, P. M. C. Rourke, H. Ikeda, T. Terashima, R. Settai, Y. Ōnuki, D. Vignolles, C. Proust, B. Vignolle, A. McCollam, Y. Matsuda, T. Shibauchi, and A. Carrington, Phys. Rev. Lett. 104, 057008 (2010).
- Chu et al. (2012b) J.-H. Chu, H.-H. Kuo, J. G. Analytis, and I. R. Fisher, Science 337, 710 (2012b), http://www.sciencemag.org/content/337/6095/710.full.pdf .
- Blomberg et al. (2012) E. C. Blomberg, M. A. Tanatar, R. M. Fernandes, I. I. Mazin, B. Shen, H.-H. Wen, M. D. Johannes, J. Schmalian, and R. Prozorov, Nat. Commun. 4 (2012), 2013/05/28/online.
- Breitkreiz et al. (2014) M. Breitkreiz, P. M. R. Brydon, and C. Timm, Phys. Rev. B 90, 121104 (2014).
- Kontani and Onari (2010) H. Kontani and S. Onari, Phys. Rev. Lett. 104, 157001 (2010).
- Halboth and Metzner (2000) C. J. Halboth and W. Metzner, Phys. Rev. Lett. 85, 5162 (2000).
- Song et al. (2011) C.-L. Song, Y.-L. Wang, P. Cheng, Y.-P. Jiang, W. Li, T. Zhang, Z. Li, K. He, L. Wang, J.-F. Jia, H.-H. Hung, C. Wu, X. Ma, X. Chen, and Q.-K. Xue, Science 332, 1410 (2011).