Transient X-ray pulsar V 0332+53: pulse phase-resolved spectroscopy and the reflection model
Abstract
We present the results of the pulse phase- and luminosity-resolved spectroscopy of the transient X-ray pulsar V 0332+53, performed for the first time in a wide luminosity range erg s-1 during a giant outburst observed by the RXTE observatory in Dec 2004 – Feb 2005. We characterize the spectra quantitatively and built the detailed “three-dimensional” picture of spectral variations with pulse phase and throughout the outburst. We show that all spectral parameters are strongly variable with the pulse phase, and the pattern of this variability significantly changes with luminosity directly reflecting the associated changes in the structure of emission regions and their beam patterns. Obtained results are qualitatively discussed in terms of the recently developed reflection model for the formation of cyclotron lines in the spectra of X-ray pulsars.
keywords:
X-ray:binaries – (stars:)pulsars:individual – V 0332+531 Introduction
The observed emission of X-ray pulsars originates from one or two hot regions, located near the neutron star magnetic poles where the accreting matter is funneled to by the strong magnetic field of the neutron star. The geometry of the emission regions depends mostly on the accretion rate, magnetic field structure and strength, and can be described as spots, mounds or columns (see e.g., Basko & Sunyaev, 1976; Burnard et al., 1991; Becker & Wolff, 2007; , Mushtukov et al.2014). The geometry and the beaming properties of these hot regions shape the observed X-ray spectrum, its pulse-phase and accretion-rate dependences which can be studied observationally and used to uncover intrinsic properties of the emission regions.
Significant progress in X-ray astronomy has been achieved in the last decades with the Compton-GRO, RXTE, BeppoSAX, INTEGRAL and Swift observatories, which allowed to study several dozens of X-ray pulsars in details (see, e.g., reviews of Bildsten et al., 1997; dal Fiume et al., 2000; Coburn et al., 2002; Filippova et al., 2005; Lutovinov & Tsygankov, 2009a; Caballero & Wilms, 2012). A combination of excellent timing capabilities of the RXTE observatory with its good spectral characteristics allowed also to perform a pulse phase-resolved analysis for a number of X-ray pulsars (see, e.g., Kreykenbohm et al., 2004; Klochkov et al., 2008; Fürst et al., 2011).
| # | Observation | Date | Luminosity a | Phase b |
| ID | MJD | ( erg s-1) | ||
| 1 | 90089-11-04-04 | 53360.0 | m | |
| 2 | 90089-11-04-02G | 53358.6 | b | |
| 3 | 90089-11-04-00G | 53356.5 | b | |
| 4 | 90089-11-03-01G | 53354.7 | b | |
| 5 | 90089-11-03-03 | 53352.8 | b | |
| 6 | 90089-11-03-04 | 53353.7 | b | |
| 7 | 90427-01-03-01 | 53385.1 | d | |
| 8 | 90427-01-03-05 | 53387.0 | d | |
| 9 | 90427-01-03-06 | 53387.4 | d | |
| 10 | 90427-01-03-09 | 53388.4 | d | |
| 11 | 90427-01-03-12 | 53389.3 | d | |
| 12 | 90014-01-02-13 | 53390.4 | d | |
| 13 | 90089-11-02-03 | 53343.8 | b | |
| 14 | 90089-11-02-00 | 53342.8 | b | |
| 15 | 90014-01-03-020 | 53394.4 | d | |
| 16 | 90014-01-03-03 | 53395.3 | d | |
| 17 | Group 1: | d | ||
| 90014-01-04-00 | 53398.5 | |||
| 90014-01-04-01 | 53399.6 | |||
| 90014-01-04-02 | 53401.4 | |||
| 18 | 90014-01-05-01 | 53407.6 | d | |
| 19 | 90427-01-04-04 | 53413.8 | d | |
| 20 | Group 2: | d | ||
| 90427-01-04-02 | 53414.3 | |||
| 90427-01-04-03 | 53413.8 | |||
| 90427-01-04-05 | 53414.8 | |||
| 21 | 90427-01-04-01 | 53416.6 | d | |
| 22 | Group 3: | d | ||
| 90014-01-07-01 | 53419.4 | |||
| 90014-01-07-02 | 53420.7 | |||
| 90014-01-07-03 | 53420.7 | |||
| 23 | 90014-01-07-00 | 53424.4 | d |
| a | Luminosity in the 3–100 keV energy band assuming the source distance of kpc |
| b | Outburst phase: b – brightening, d – declining, m – near the maximum |
In this work we focus on the detailed pulse phase-resolved spectroscopy for the X-ray pulsar V 0332+53 in a wide dynamical luminosity range (here erg s-1, assuming the distance to the source of 7 kpc, Negueruela et al. 1999). It is important to emphasize, that such systematic analysis has not been carried out before.
The X-ray pulsar V 0332+53 was observed by the RXTE observatory during a powerful outburst in 2004–2005, that provided a very good coverage of different outburst stages. An additional reason to choose V 0332+53 for the study of physical conditions and geometry of the emission regions in X-ray pulsars and for an examination of a recently developed reflection model (Poutanen et al., 2013) is a presence of the cyclotron absorption line (so-called cyclotron resonant scattering feature, CRSF) and its higher harmonics in the source spectrum (Makishima et al., 1990; Pottschmidt et al., 2005; Kreykenbohm et al., 2005). A study of the source pulse-averaged spectra showed that the cyclotron line energy, as well as parameters of the spectral continuum, significantly change with the source luminosity (Tsygankov et al., 2006; Mowlavi et al., 2006; Tsygankov et al., 2010; Nakajima et al., 2010) along the outburst. This behaviour was interpreted as a result of changes in the height of the accretion column where the cyclotron absorption line was assumed to originate (see, e.g., Mihara, 1995; Schönherr et al., 2007; Nishimura, 2008, 2014; Becker et al., 2012, and references therein). However, alternative scenario has recently been proposed by Poutanen et al. (2013), where the line forms in the illuminated atmosphere of the neutron star. In our paper, we focus on the latter model when discussing observed spectral variations.
According to the model calculations the cyclotron line parameters should strongly depend on the viewing angle, pulse phase, bulk velocity of the falling plasma, etc. (Isenberg et al., 1998; Araya & Harding, 1999; Araya-Góchez & Harding, 2000; Serber, 2000; Schönherr et al., 2007). Parameters of the continuum should also depend on the viewing angle due to the significant angular dependence of the continuum opacity in the strong magnetic field near the neutron star surface (see, e.g., Kaminker et al., 1982, 1983). Thus, observations of V 0332+53 give us an unique possibility to build for the first time a detailed “three-dimensional” picture (parameter vs pulse phase vs luminosity) of the source spectrum behaviour, and ultimately uncover the physical and geometrical picture of the accretion onto a magnetized neutron star.
Note, that first results on the pulse phase-resolved spectroscopy for V 0332+53 were obtained by Pottschmidt et al. (2005), however, available observations did not contain the PCA data with the required energy and time resolution, so the analysis was limited to the HEXTE data and, therefore, it was not trivial to constrain the parameters of the broadband spectrum. As a result, no significant variations of spectral parameters with the pulse phase had been reported. Later, some preliminary results (using only two observations of V 0332+53) on the phase and luminosity dependence of the continuum and CRSF parameters were published by Lutovinov & Tsygankov (2009b) and the results on variability of the iron emission line with the pulse phase and luminosity by Tsygankov & Lutovinov (2009). Also no attempts to interpret the obtained results have been made.
2 Observations, spectral model and data analysis
| Phase | (d.o.f.) | ||||||||
| keV | keV | keV | keV | keV | |||||
| Obs.1, | |||||||||
| 0.5625–0.625 | 91.9 (90) | ||||||||
| 0.9375–1.0 | 97.5 (90) | ||||||||
| 0.5–0.5625 | 94.1 (90) | ||||||||
| Obs.8, | |||||||||
| 0.75–0.8125 | 111.9 (107) | ||||||||
| 0.5–0.5625 | 90.1 (107) | ||||||||
| 0.375–0.4325 | 99.5 (107) | ||||||||

As already mentioned, V 0332+53 has been observed with the RXTE observatory during the so-called giant outburst, which started in the end of 2004 (Swank et al., 2004) and lasted for about two months. In the current work we use the same data set as in Tsygankov et al. (2010) apart from a number of observations (ObsIDs. 90014-01-01-XX, 90089-11-05-XX, 90089-22-01-XX, 90427-01-01-XX, 90427-01-02-XX), performed with time resolution insufficient for the pulse-phase resolved analysis (typically 16 s, while the source pulse period is about of 4.35 s). The used data set covers both brightening and declining phases of the outburst more or less uniformly. There is only a small gap between luminosities of and due to the absence of observations of the required timing quality. To improve the statistic for observations at lower luminosities or with small exposures we grouped closely spaced observations with approximately the same averaged source intensity into three groups with the averaged luminosities of , and . The list of analysed observations with corresponding averaged luminosities in the 3–100 keV energy range is presented in Table 1. These luminosity values may be regarded as close to the bolometric ones under the assumption that the bulk of the energy is released in the X-rays.
To extract pulse phase-resolved spectra from the PCA and HEXTE instruments onboard RXTE we used standard programs of the ftools/lheasoft v. 6.14 package and methods described in the RXTE cookbook111http://heasarc.nasa.gov/docs/xte/recipes/cook_book. html. Depending on the spectrum quality photons were folded into 16, 8 or 4 phase bins, using individually determined (per observation) and barycentrically corrected pulse periods.
The obtained spectra were approximated by a powerlaw model with an exponential cutoff (cutoffpl in the xspec package)
| (1) |
where is the photon index, is the cutoff energy, is a normalization. The spectrum was modified by one or several cyclotron absorption lines in the form
| (2) |
where , and are the energy, width and depth of the cyclotron line () and harmonics (), respectively (cyclabs in the xspec package; Mihara et al. 1990). The same model was used earlier for the analysis of pulse-phase averaged spectra and reasons for the choice of the continuum and line models were discussed by Tsygankov et al. (2006, 2010). Note, that inclusion of the photoelectric absorption in the model does not affect the results of fitting in the 3–100 keV energy range and thus it was not taken into account.
The first harmonic of the cyclotron absorption line was not confidently observed and its parameters were not well constrained in all data sets. Therefore, we examined possible effects of the inclusion of higher harmonics in the model in such cases on the parameters of the cyclotron line and of the continuum. Similarly to the analysis of the pulse-averaged spectra (Tsygankov et al., 2006), the energy of the first harmonic was assumed either to be a free parameter or fixed equal to the doubled energy of the fundamental . We have found that the parameters of the continuum within the uncertainties do not depend on whether the higher harmonics are included in the model. The energy and width of the cyclotron line were found to slightly vary with the systematic uncertainty of about 0.1 and 0.2 keV, respectively. In the following analysis these values were taken into account when calculating uncertainties of these parameters. Finally, to take into account the iron fluorescent line at keV a Gaussian line at this energy with a fixed width 0.1 keV was included in the model as well.
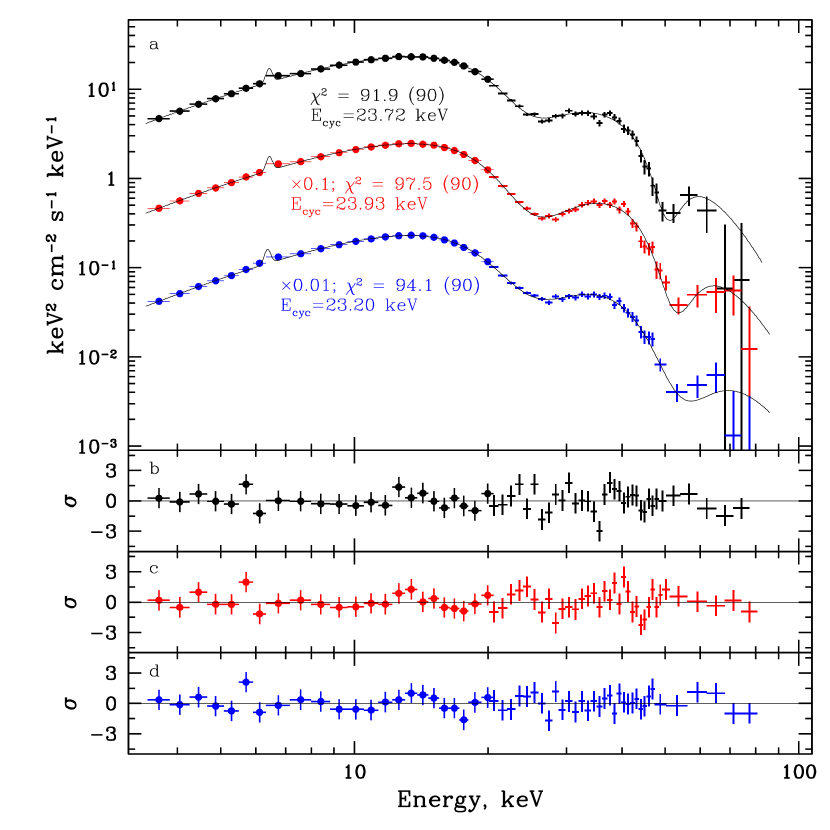
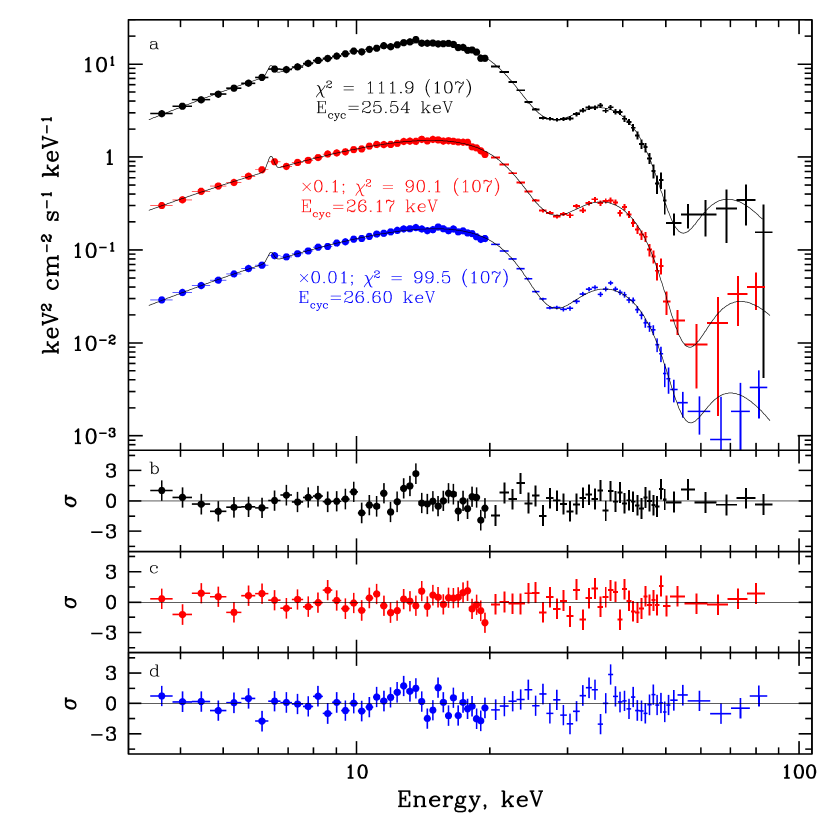
The total number of spectra which were analysed in the paper exceeds two hundreds and, therefore, it is not possible to fully discuss the results of fitting of the individual spectra here. We thus present in Fig. 1 several examples of pulse-phase resolved spectra for two luminosity levels to give some impression on the quality of the data and typical variation of spectral parameters with pulse phase. The best-fitting parameters are summarised in Table 2. It can be seen from Fig. 1 that the model adequately describes observations in a wide energy range 3–100 keV. Pottschmidt et al. (2005) and Nakajima et al. (2010) have discussed a complex structure of the V 0332+53 spectrum near the cyclotron line. This is also visible in the residuals of our spectra. These are likely related to the oversimplified description of the CRSF (i.e. with a Gaussian or a Lorentzian absorption profiles), whereas in reality it has probably a more complex shape (as discussed e.g. by Schönherr et al. 2007 and Mukherjee & Bhattacharya 2012).
3 Results
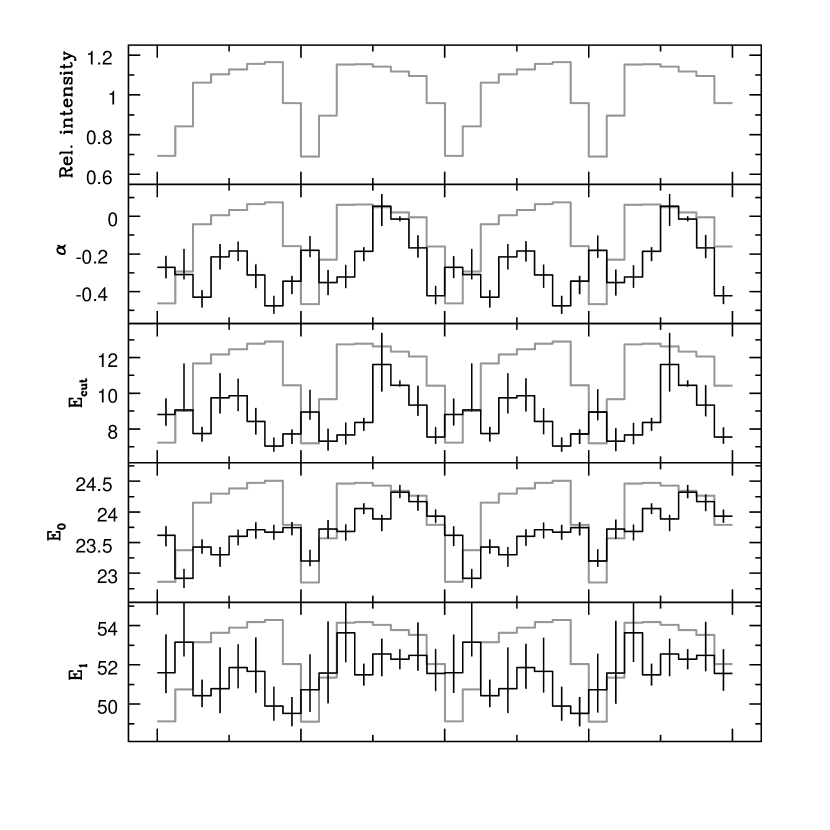
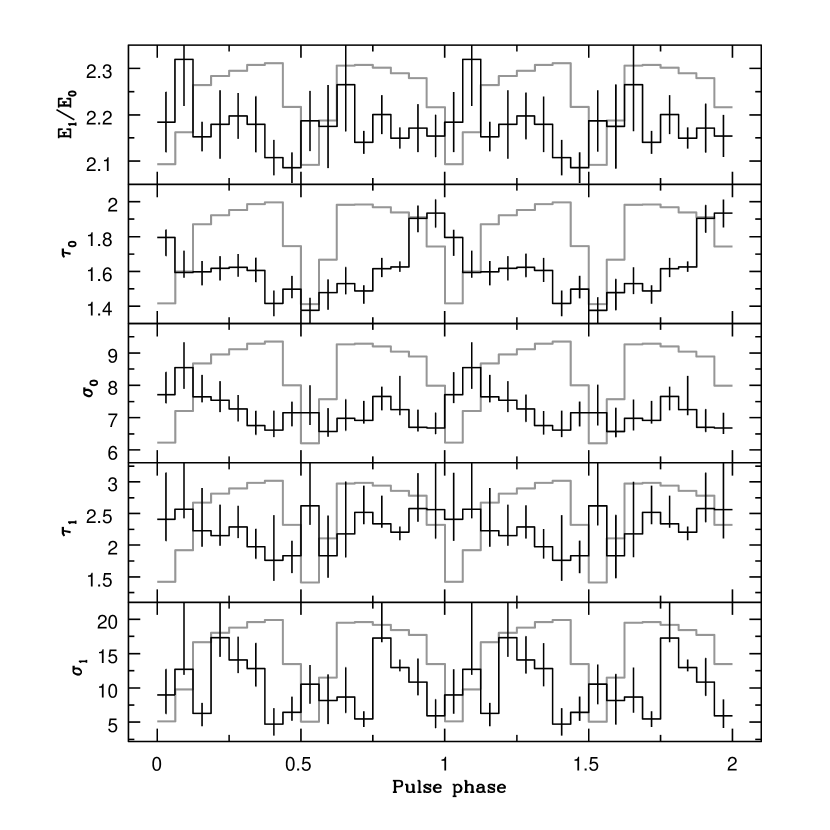
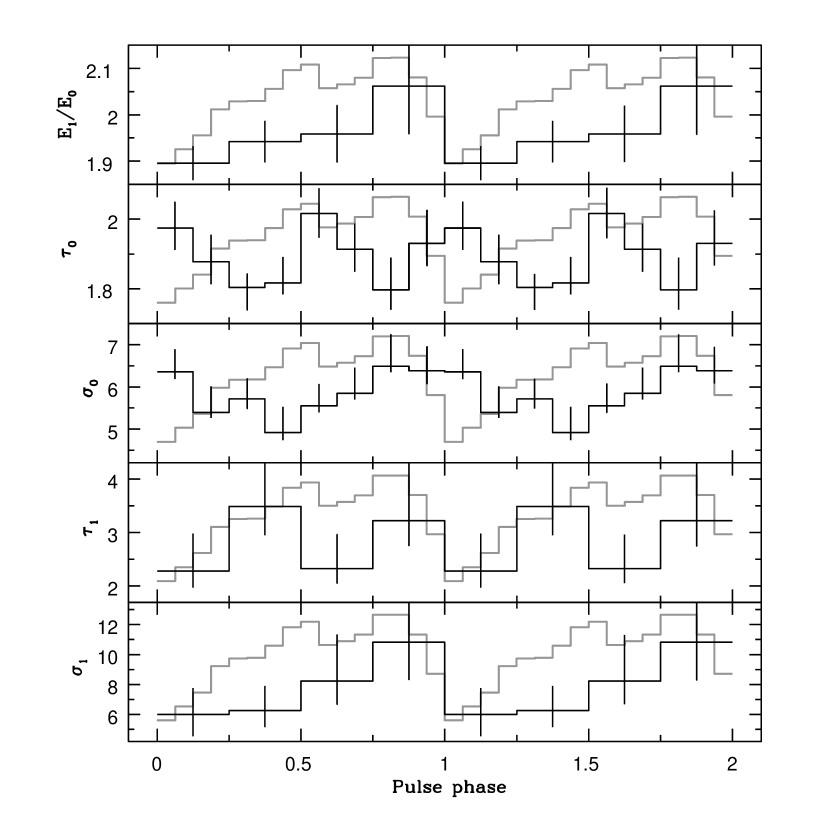
The analysis had been carried out uniformly for all observations and a strong variation of both the continuum and the cyclotron line parameters with the pulse phase had been found at all luminosities. An example of such variability for two luminosities ( and ) is presented in Fig. 2 together with the source pulse profile in the 3–20 keV energy band. To align the phases of individual observations we use the pulse profiles in 3–20 keV energy range. Due to significant variation of the spin period and the pulse profile shape with luminosity, finding a robust timing solution coherently defining pulse phase at all luminosities is problematic (Raichur & Paul, 2010). Therefore, we roughly aligned pulse profiles obtained for individual observations to have the zero phase coincide with the main minimum of the pulse, and further on only discuss variations of the spectral parameters over the pulse profile. This approach does not require precise phase connection over the whole outburst.
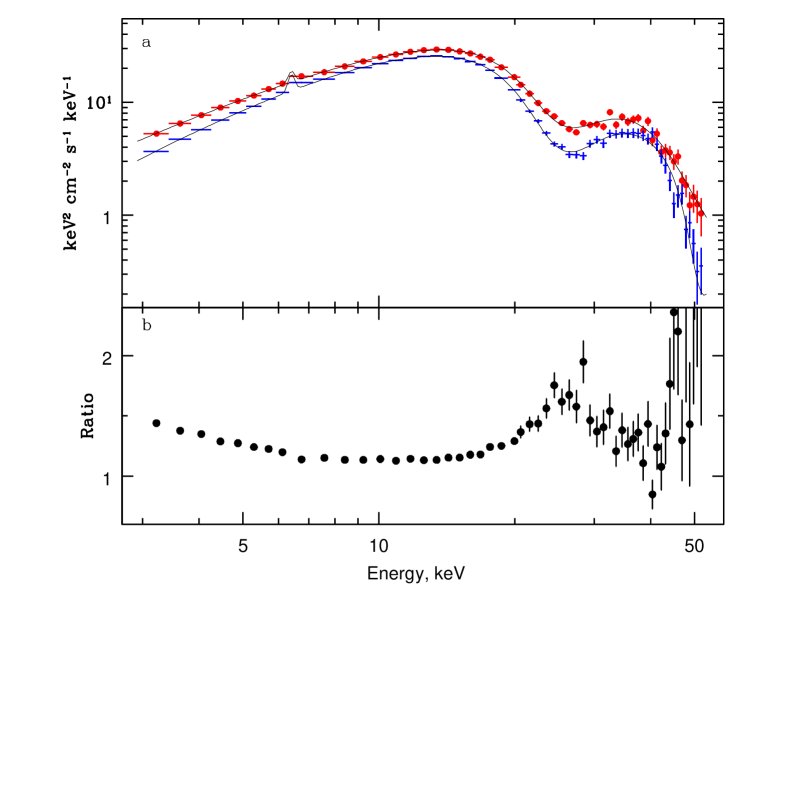
As can be seen from Fig. 2, the spectrum of the source is strongly variable with pulse phase. Moreover, the pulse-phase dependence of most parameters appears to be different at different luminosities (see detailed descriptions in following sections). We note that our spectral model has many parameters, some of which can be correlated (e.g., photon index versus cutoff energy, cutoff energy versus cyclotron line energy, see Coburn et al. 2002; Lutovinov & Tsygankov 2011 for results and discussion). Therefore, a change in one parameter might in principle be compensated by a change in another parameter with no change in the overall spectral shape. To demonstrate that this is not generally the case, and that the spectrum does indeed significantly change its shape, we present (as an example) in Fig. 3 two spectra obtained at different pulse phases as well as their ratio. The variability both in the continuum and near the cyclotron line energy is apparent. Below, we discuss in details these variations.
3.1 Continuum
Currently there are no commonly accepted theoretical models to describe the spectra of accreting pulsars in details provided by observations, so empirical models are typically used instead. As it was noted above, the broadband spectra of V 0332+53 (both the pulse-averaged and the phase-resolved) were described with an absorbed power law with exponential cutoff at high energies. The study of the pulse-averaged spectra showed that the spectrum becomes softer and the cutoff energy increases when luminosity drops (Lutovinov & Tsygankov, 2011). Moreover, the cutoff and cyclotron line energies were found to correlate (Lutovinov & Tsygankov, 2011), although the physical reasons besides this correlation are not fully clear. In this paper, we use the same model as it is the simplest model which seems to capture all relevant features of the spectrum.
3.2 Variations of the cyclotron fundamental line parameters with phase and luminosity
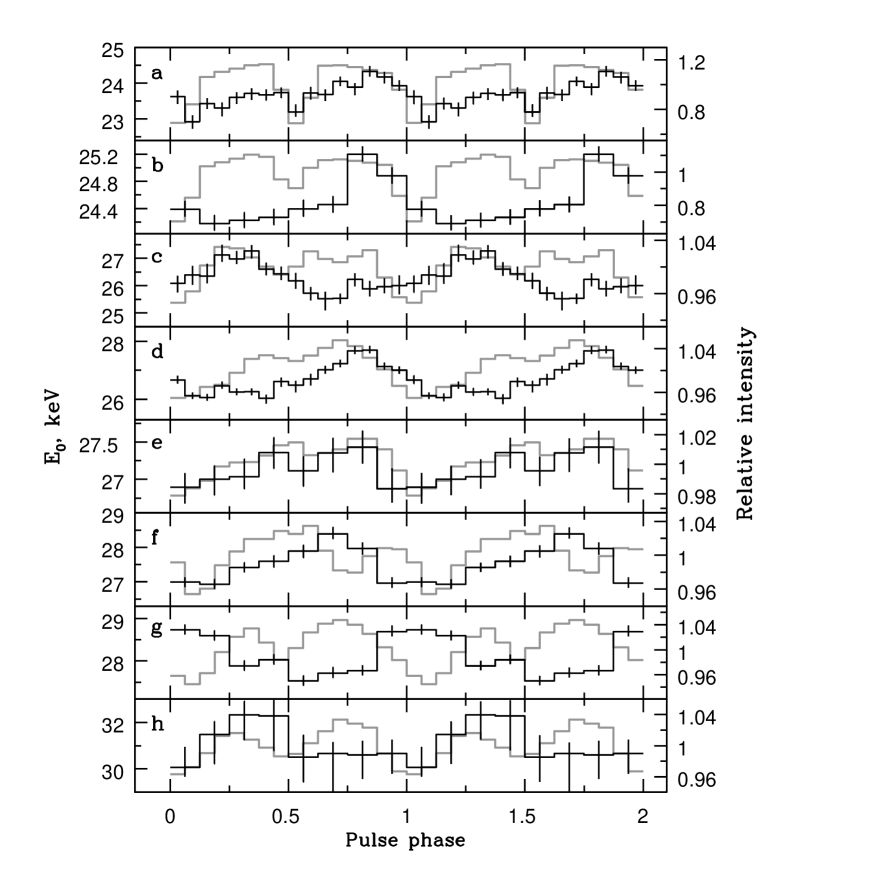
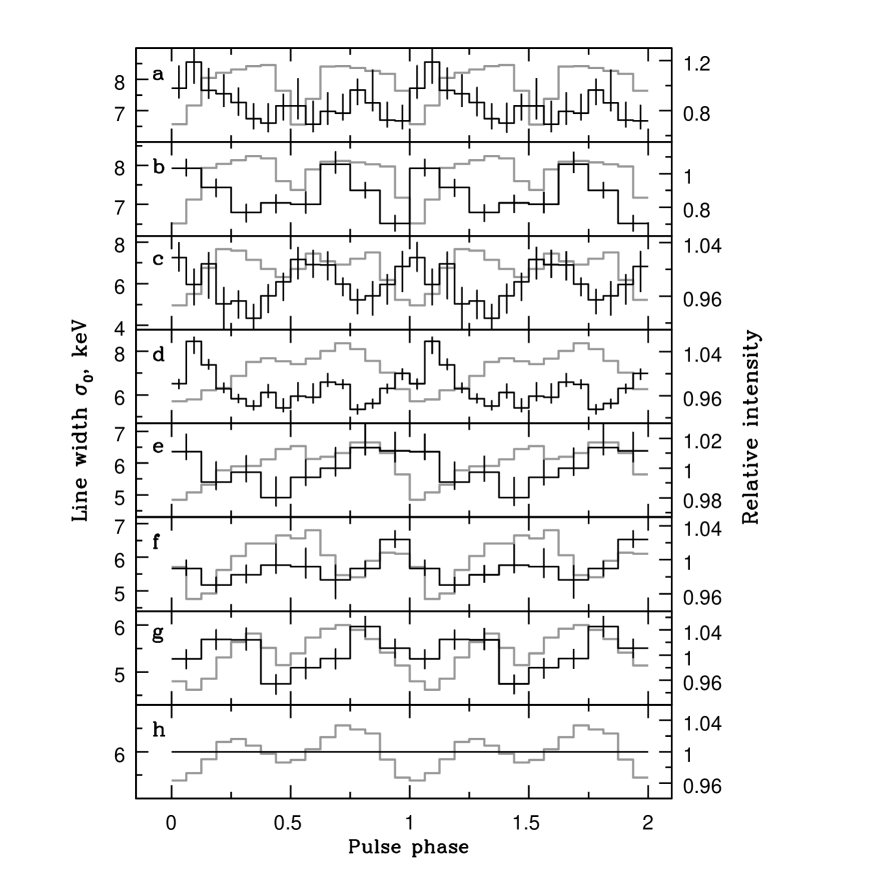
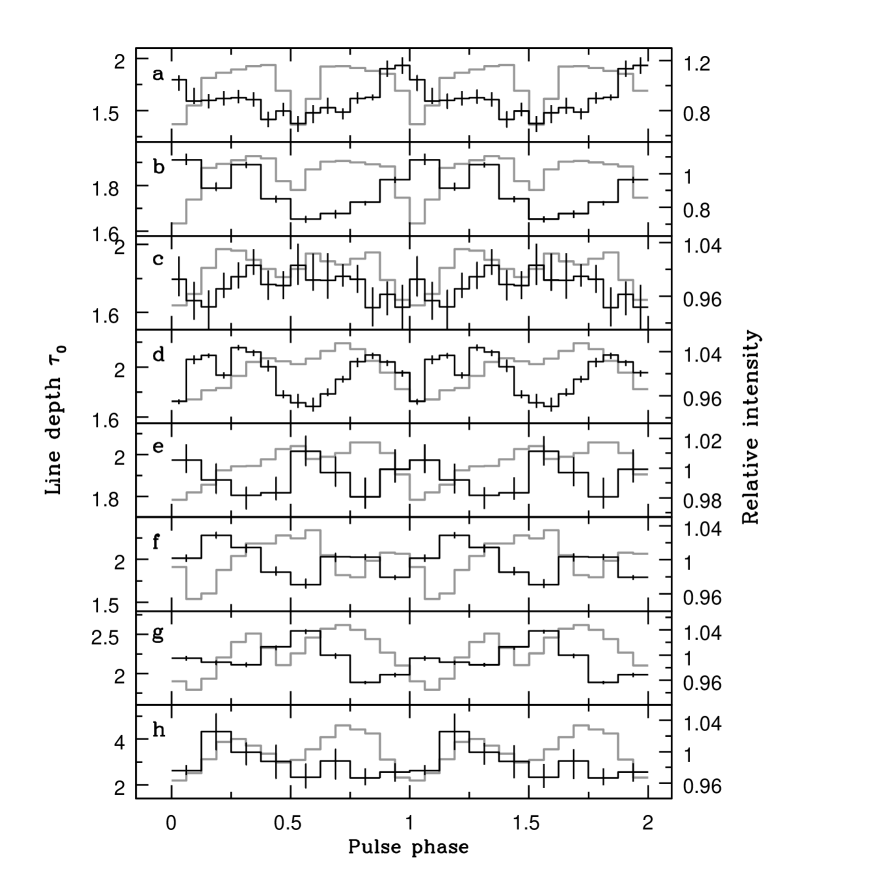
As is evident from Fig. 2, the cyclotron line parameters significantly vary with the pulse phase and the shape of these variations (below we refer to them as ‘cyclotron energy/width/depth profiles’ for simplicity) depends on the source luminosity. The observed changes of these profiles should directly reflect changes in the structure of emission regions and their beam patterns with luminosity. To trace this variability we constructed the cyclotron energy/width/depth profiles for all observations from Table 1 and compared them with the corresponding pulse profiles. In Fig. 4, the pulse-phase dependencies of the cyclotron line parameters are presented for eight levels of the source luminosity =36.9 (a), 32.8 (b), 20.2 (c), 16.3 (d), 12.7 (e), 9.7 (f), 6.2 (g), and 1.7 (h).
At high luminosities 32–37 the cyclotron energy profile has a double-peaked shape with the maxima roughly coinciding with the maxima of the pulse profile. With decreasing of the luminosity to the profile becomes single peaked. Such a shape remains then more or less stable down to luminosity of . At even lower luminosities, the maximum of the cyclotron energy profile moves to the inter-peak minimum of the pulse profile and can be clearly seen for luminosities below .
The evolution of the cyclotron depth profile with the luminosity differs from the described above behaviour of the cyclotron energy profile. In particular, practically for all luminosities its maximum roughly corresponds to the inter-peak minimum of the pulse profile, and only at the very low luminosities covered by observations () the maximum of the cyclotron depth profile shifts to one of pulse profile peaks.
The cyclotron line width tends to anti-correlate with the flux at high luminosities (Fig. 4a, b, d) and to correlate with it at low luminosities (Fig. 4e, f, g). Such a behaviour is indeed expected in the reflection model. Generally speaking, although the width depends on several factors, it is expected to be broader in the case when we see the illuminated neutron star surface from aside and narrower when the illuminated surface is seen from the poles (see an extended discussion in Section 4.2).
3.3 Variations of the energy of the first harmonic
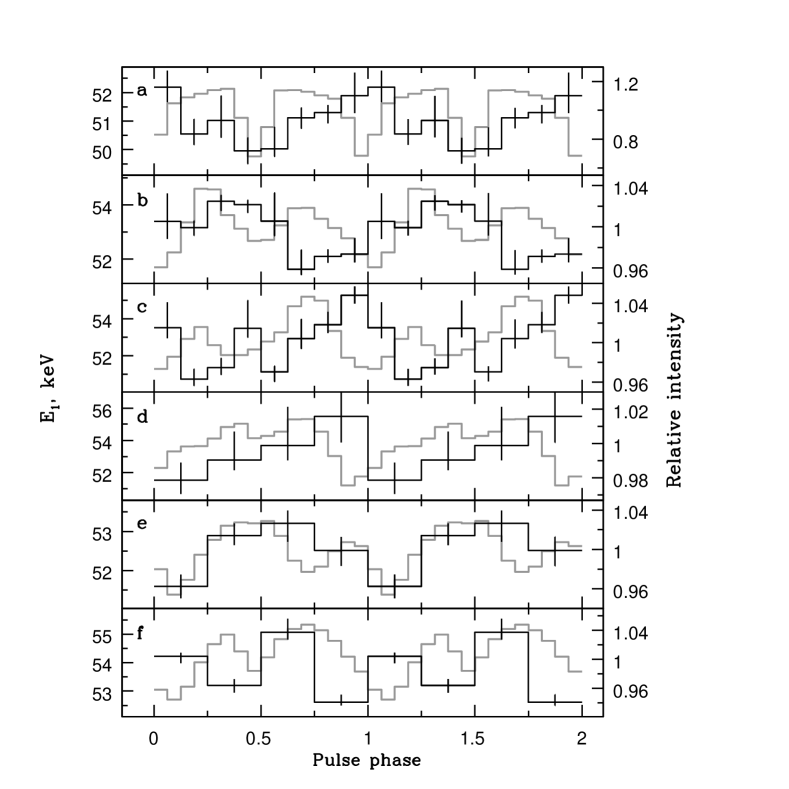
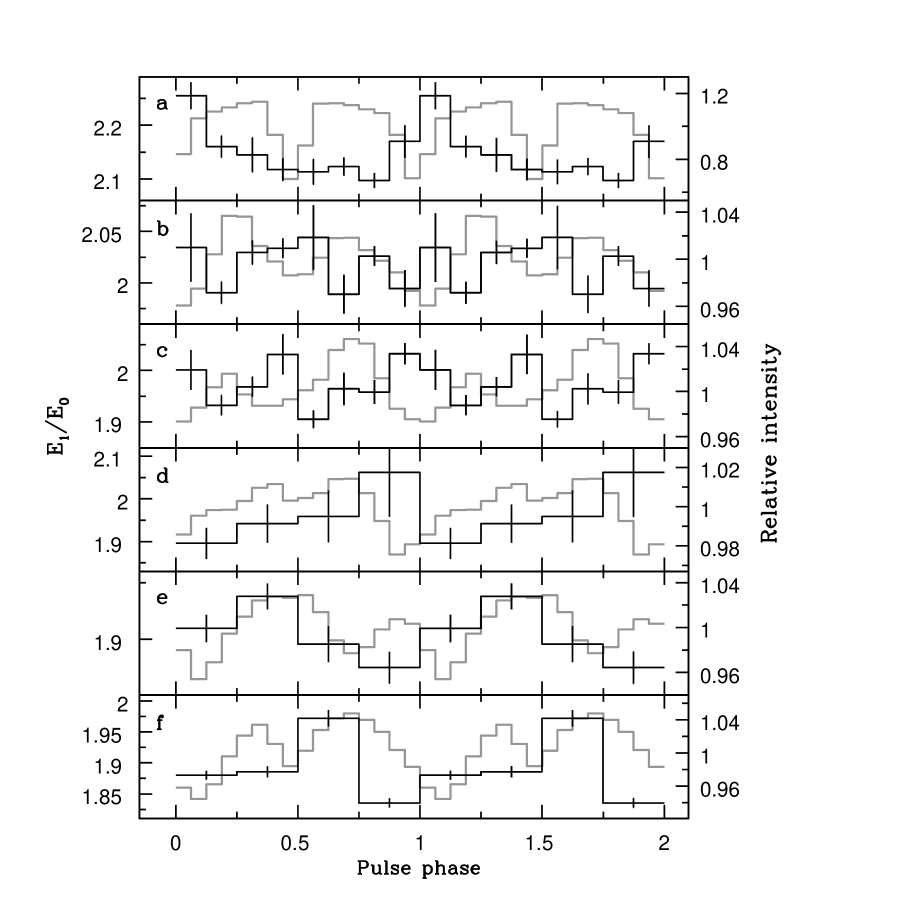
Tsygankov et al. (2006) showed that the centroid energy of the first harmonic roughly follows the luminosity dependence of the cyclotron line . However, the ratio of the energies of the first harmonic to the fundamental one does change slightly with luminosity, from about at highest luminosities to at the lowest (Tsygankov et al., 2006; Nakajima et al., 2010). Taking into account that during the pulse different parts of the emission regions are observed at different viewing angles and that the cyclotron line and the first harmonic could potentially be formed in slightly different regions, it would be interesting and important to trace the behaviour of the first harmonic energy and of the ratio both with the pulse phase and luminosity.
Note that the parameters of the first harmonic are reasonably constrained only in a subset of all observations even for pulse-averaged spectra (see detailed discussion in Tsygankov et al., 2006). The situation is even worse for the phase resolved analysis due to lower number of photons. Nevertheless, we found a number of observations, covering a luminosity range from to , where a combination of the source intensity and exposure allowed us to determine and constrain the parameters of the first harmonic. Profiles of its centroid energy and corresponding ratio as a function of the pulse phase are presented in Fig. 5.
It is difficult to make a detailed comparison of the behaviour with , however, it can be seen that their profiles are not coincident (see Figs. 4 and 5). This is probably due to the fact that different parts of emission regions are responsible for the formation of the cyclotron line and first harmonic of the CRSF. The ratio is also strongly variable (up to %) during the pulse. On the average, it demonstrates also a decrease with the luminosity, similar that found for pulse-average spectra (Tsygankov et al., 2006; Nakajima et al., 2010).
4 Discussion
We now will try to describe qualitatively the observed pulse-phase changes of the cyclotron line parameters using the recently proposed reflection model (Poutanen et al., 2013). According to the widely accepted paradigm (Basko & Sunyaev, 1976), bright X-ray pulsars have relatively tall (comparable with the neutron star radius) accretion columns at both magnetic poles. The columns are supported by the radiative pressure of the X-rays trapped within the optically thick accretion flow and slowly diffusing through the sides of the columns, so the plasma is most effectively slowed down in the core of the column, whereas the outer shell falls almost freely (Lyubarskii & Syunyaev, 1988). As a result, the emerging emission is expected to be strongly beamed towards the neutron star surface due to the scattering on fast free-falling electrons (Kaminker et al., 1976; Lyubarskii & Syunyaev, 1988). The formation of a cyclotron feature in the directly observed column spectrum is rather problematic due to a strong gradient of the magnetic field along the column and scattering on free-falling electrons (see discussion in Nishimura, 2008, 2014). On the other hand, such a feature can be formed in the spectrum reflected from a neutron star atmosphere where the magnetic field change is smaller (Poutanen et al., 2013). The size of the spot on the neutron star surface illuminated by the accretion column depends on the column height, which, in turn, depends on the X-ray pulsar luminosity. The fraction of the column emission which is intercepted by the neutron star remains, however, large at all luminosities, so one does expect that a large fraction of the observed emission is reflected off the surface of the neutron star. It is not unlikely, therefore, that the observed cyclotron features also form in the atmosphere of the neutron star. This scenario allows to explain many important observational features of the CRSFs that otherwise are difficult to explain. For instance, the luminosity of V 0332+53 in the considered outburst (and, therefore, the height of the accretion columns) changes by factor of twenty, whereas the line energy varies by just per cent, which is hard to explain if the line is formed within the column. On the other hand, the dipole magnetic field over the neutron star surface decreases only by factor of two from the magnetic pole to the equator, so smaller variations of the CRSF energy are easier to accommodate. In fact, Poutanen et al. (2013) showed that the expected variation of the CRSF energy in this case is compatible with observations. Moreover, the reflection model was also capable of explaining the observed correlation of the line energy with luminosity. Below we will discuss qualitatively how the observed variation of CRSF parameters with pulse phase and luminosity can be qualitatively explained within this model.
4.1 Phase dependence of the cyclotron line energy as function of luminosity
The quantitative comparison of results of the phase-resolved spectroscopy with the predictions of any theoretical models, including the reflection model, will be possible only after a self-consistent model emerges that describes the accretion column structure and the radiation field around the pulsar including the reflection from the neutron star surface. Nevertheless some observational features described above could be understood qualitatively.

If reflection off the neutron star surface is indeed responsible for the formation of the CRSF, the observed line parameters such as its energy, width and depth will depend on the size of illuminated spot(s). This, in turn, depends on many factors including the accretion columns height, beaming of the emerging radiation, the neutron star compactness, etc. Moreover, the observable part of the illuminated hot spots also depends on the relative position of the observer, being a function of the pulse phase. Thus, the cyclotron line parameters should be variable with the pulse phase.
From geometric considerations, the line energy is expected to be maximal when one of magnetic poles is directed to the observer, so that the polar regions with the strongest field are observed. At other angles large fraction of reflected radiation will be scattered further from the poles, where the field is lower, and a slight decrease in the observed CRSF energy is expected.
It is interesting to note that the observed line energy maximum tends to coincide with one of the total flux maxima at high luminosities (see Figs 4a-e) and it tends to be between two flux maxima at low luminosities (Figs 4f-h). A quantitative analysis this behaviour is not simple. Pulse profiles as well as the dependence of the line energy on the phase are very different and variable. This makes the standard correlation analysis problematic. Instead, a phase shift between the maxima of the considered curves can be used to quantify the potential correlation. To account for the apparent asymmetry of the profiles, we used the centre of the segment connecting rising and declining parts of the pulsed maximum at half of the maximum flux as a reference phase. Results of such an analysis are presented in Fig. 7 and they are in agreement with our expectations – the phase shift is a relatively small () at high luminosities and increases at low luminosities.
In the framework of the reflection model, the cyclotron line only contributes to the reflected spectrum, whereas total flux at a given pulse phase includes both reflected and directly observed emission. Therefore, the observed change in the pulse phase behaviour of the cyclotron line energy can be explained if the ratio between these two components changes with luminosity. The ratio of the reflected emission to that observed directly from the column depends on total fraction of intercepted emission and on the beaming characteristics of the two components. The reflected component is expected to have a broad pencil-like beam pattern directed along the magnetic dipole axis. The beam pattern of the emission observed directly is more complicated and depends on luminosity.
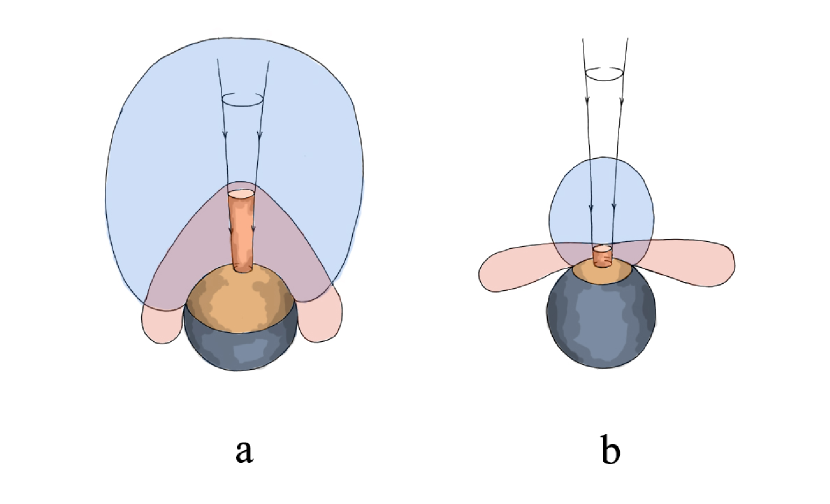
At high luminosities, both columns are expected to contribute to the observed flux at all pulse phases with the combined beam pattern similar to that of the reflected component (see Fig. 6a). Therefore, the pulse profile is expected to have two maxima corresponding to the two illuminated spots around the two magnetic poles. In such a situation, the maximum of the cyclotron line energy profile will coincide with one of the pulse profile maxima, which in turn corresponds to the pole with the smallest inclination angle to the line of sight.

At lower luminosities, the height of the column decreases, and the illuminated spot around the second pole becomes less visible or even fully obscured by the neutron star. As a result, a fan-like beam pattern from the two columns is expected in this case to have two maxima when both columns are observed sideways (see Fig. 6). The reflected component retains the pencil-like beaming and, therefore, is expected to be in anti-phase with the direct emission. Even though the total fraction of the reflected emission is expected to increase at lower luminosities, only contribution from one pole can be observed at a time. On the other hand, both columns are expected to be visible when the contribution of the directly observed component is maximal, so the overall maximum of the pulse profile shall be defined by the component observed directly. Still, the cyclotron line is only present in the reflected component, which is in anti-phase with the directly observed emission. Therefore, the maximum of the cyclotron line energy profile is expected to move away from the pulse-profile maximum at lower luminosities in agreement with observations.
We can find a relative column height in the framework of the reflection model (Poutanen et al., 2013). We used equation (2) in that paper and substituted model parameters which give the best fit to the observed dependence versus (see Fig. 5 in Poutanen et al. 2013). We find that the relative column height decreases from 0.89 for the brightest state to 0.07 for the dimmest one (the relative column heights for all the luminosities are given in the caption to Fig. 4). In framework of this model, the first described scenario with the pencil-like reflection component domination is realised during the high-luminosity states and relatively tall columns with . The second scenario, with the direct fan-like component, is likely realised for short columns with .
Finally, we note that the light bending is an important factor influencing the visibility of illuminated spots (see e.g. Beloborodov, 2002; Annala & Poutanen, 1999) which we did not account in out qualitative discussion. However, estimations of are done on the base of the model by Poutanen et al. (2013) who accounted for light bending.
4.2 Correlations between the parameters of the cyclotron line
Based on the spectral analysis of several X-ray pulsars, Coburn et al. (2002) found that there are two types of correlations between cyclotron line parameters: between its width and energy , and between the relative cyclotron line width and the line depth . Later, similar correlations were reported by Kreykenbohm et al. (2004) for pulse phase-resolved spectra of the X-ray pulsar GX 301–2. At the same time no obvious correlations were found by Tsygankov et al. (2010) from the analysis of pulse-average spectra of V 0332+53 in a wide energy band.
| Model | (d.o.f.) | ||||||||
| keV | keV | keV | keV | keV | |||||
| 1st bin (phase 0.0–0.125) | |||||||||
| gabs | 105.9(107) | ||||||||
| cyclabs | 109.2(107) | ||||||||
| 7th bin (phase 0.75–0.875) | |||||||||
| gabs | 108.3(107) | ||||||||
| cyclabs | 107.2(107) | ||||||||
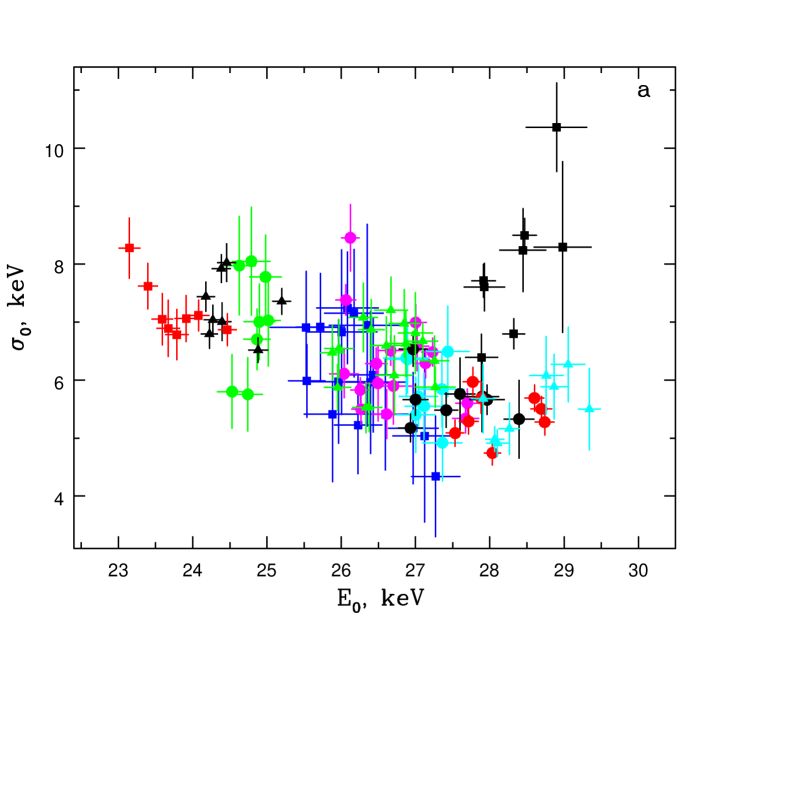
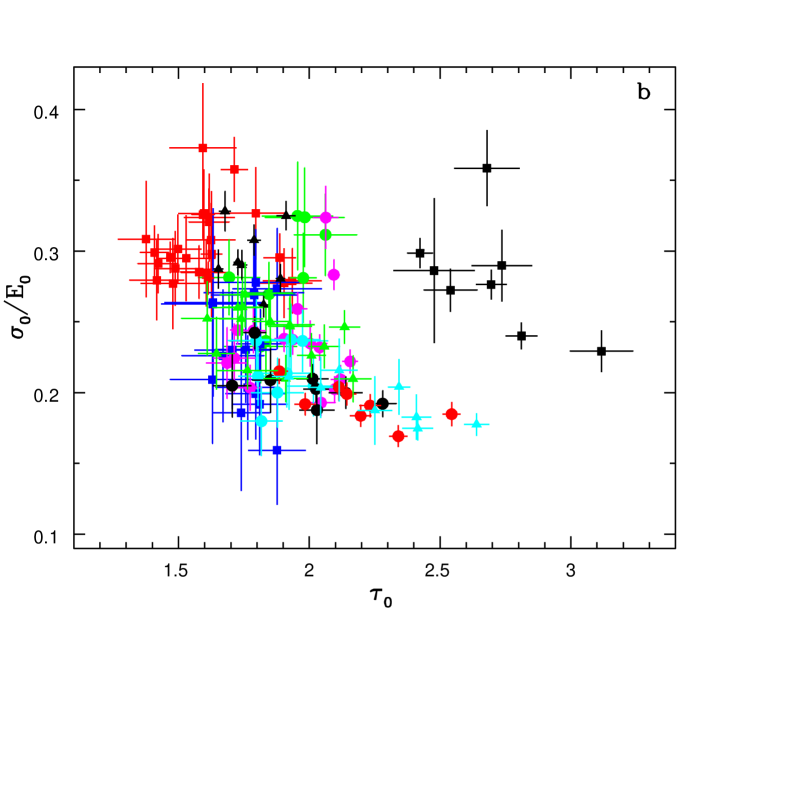
To obtain the relations and ( we have reanalysed uniformly all data sets from Table 1, dividing the corresponding pulse profiles into eight phase bins and approximating the obtained spectra with the model described above (cutoffpl + cyclabs). The observations where cyclotron line parameters were not reasonably constrained due to insufficient statistics (effectively limiting the number of phase bins to four or less) were excluded from further analysis. Obtained results are presented in Fig. 8. In general, its left panel is similar to the figure 5 from the paper of Tsygankov et al. (2006), where the dependence of the cyclotron line width on its energy was shown for pulse phase averaged spectra. Note a fairly strong scatter of the data points for large cyclotron energies, which is probably caused by lower statistics at low luminosities.
Note that we used the cyclabs model to describe the cyclotron absorption line as opposed to many other authors (e.g., Coburn et al., 2002; Kreykenbohm et al., 2004; Klochkov et al., 2008), who used the gaussian absorption line profile (gabs in the xspec package):
| (3) |
where , , and are the energy, width and optical depth of the cyclotron line () and harmonics (), respectively. Both models adequately approximate cyclotron absorption line and its harmonics (see Table 3, where best-fitting parameters for both cyclabs and gabs models are presented). Note, that the cyclotron line energy derived from the cyclabs model is systematically lower (by 1–3 keV) than the energy derived from the gabs model (see e.g. Mihara, 1995; Nakajima et al., 2010; Tsygankov et al., 2012).
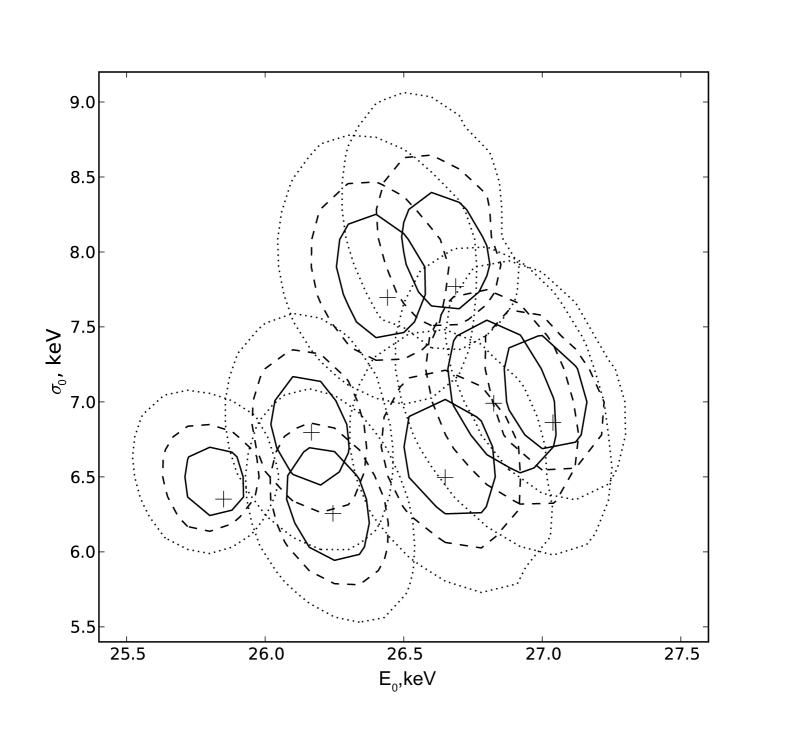
In this paper, we attempt not only to find spectral parameters of V 0332+53, but also to search for their dependence on the pulse phase and luminosity and possible physical correlations between them. Therefore, a correlation analysis was carried out to investigate potential intrinsic correlations of CRSF parameters for cyclabs and gabs models. To illustrate obtained results, we plot in Fig. 9 the confidence contours of the cyclotron line width versus cyclotron line energy obtained with cyclabs and gabs models for luminosity (obs. 15) (results for other luminosities are similar).
Several conclusions can be made from this analysis: the line energy depends on the CRSF models (see above); an accuracy of the line energy measurements is better for the cyclabs model, while the accuracy of the line width measurements is better for the gabs model; there is an intrinsic correlation between and for the gabs model, while no correlation and fairly significant scatter of the data points or even anti-correlation are seen for the cyclabs model.
A linear regression fit to the data shown in both panels of Fig. 8 gives a hint that there is indeed some weak anti-correlation: and . Thus, we confirm here the previous result by Tsygankov et al. (2010) that there is no positive correlation between the cyclotron line parameters for V 0332+53 if the cyclabs model is used for the cyclotron line. Finally, we note that if the faintest observation is excluded from Fig. 8 (black squares), the significance of the anti-correlation is increased and in this case and .
Formation of the CRSF in the framework of the reflection model is still pretty much work in progress, so here we restrict ourselves to qualitative discussion of the results. The cyclotron line width is mainly determined by two factors. First of all, the line is thermally broadened by a factor which depends on the plasma temperature in the line forming region and the angle between photon momentum direction and the magnetic field. The maximum thermal line width is realised for the radiation propagating along the magnetic field , or about 4 keV for the X-ray pulsar V 0332+53 ( 25 keV, 5–10 keV). It is also well known and might be important for the future quantitative analysis, that the cyclotron line opacity strongly depends on the direction as well (see e.g. Fig. 1 in , Suleimanov et al.2012). The second important factor is a dispersion of the magnetic field strength over the line forming region. We focusing below on this factor. According to the reflection model, the CRSF originates in radiation reflected by the NS atmosphere at different latitudes. The magnetic field decreases from poles to equator by factor of two, so the dispersion of the field within the line forming region depends on the size of the illuminated hot spot around the magnetic pole. If we assume that the thermal broadening does not depend on the accretion column height, the line width will increases with the pulsar luminosity, while the cyclotron line energy will decrease (see Fig. 4 in Poutanen et al. 2013). Indeed, this agrees with observation (see Figs 4 and 8a). Strong deviations from these dependences take place only at low luminosities when the relative column height is quite small (the black squares in Fig. 8). In this case the situation can be more complicated because the cyclotron line can be formed not only on the stellar surface but also in the small accretion column and/or (probably hotter) plasma deceleration region.

4.3 Variations of the cyclotron line energy during the pulse as function of luminosity
To character quantitatively the variability of the cyclotron line energy with the pulse phase we introduce a parameter , which is the difference between maximum and minimum values of the cyclotron line energy over the pulse. If we expect that during the pulse different parts of the emission regions are observed, this parameter should be related to the geometrical size of these regions and should reflect their changes with variations of the source luminosity. In the case of super-critical sources (with the accretion column above the surface), the parameter is related to the column height and size of the illuminated part of the neutron star surface, correspondingly (Poutanen et al., 2013).
The dependence of on the luminosity
is shown in Fig. 10a. Despite of some scattering, we see
that decreases with increase of the
luminosity up to . At higher
luminosities increases quickly practically up
to values, typical for low luminosities. To quantify this,
we approximated the dependence
with the linear fit in different luminosity ranges. We found that
for
and for
. This gives per cent significance that the
difference in slopes is real. Finally, we note that although it is hard to interpret such behaviour
of , it is similar to the behaviour of the pulse
fraction with the source luminosity (Fig. 10b).
5 Summary
The pulse phase-resolved spectroscopy of X-ray pulsars provides a lot of additional information in a comparison with the analysis of the pulse-averaged spectra, therefore it can be used as a powerful instrument for the discrimination between different models for the X-ray pulsars emission mechanisms. Up to date the pulse phase-resolved spectroscopy has been done for several sources. However, until now the limitations of observational data did not allow to investigate the influence of the source luminosity which determines geometrical structure of the emitting region.
In this paper we presented results of the pulse phase-resolved spectroscopy of the transient X-ray pulsar V 0332+53 based on the RXTE observations carried out during the powerful outburst in Dec 2004 – Feb 2005. For the first time such a study was performed for the same source in a wide luminosity range .
It was shown that both continuum and cyclotron line parameters are strongly variable with the pulse phase at all luminosities. The most important conclusion is that all spectral parameters are variable not only with the pulse phase, but the pattern of this variability with respect to the pulse profile is different for different luminosities. Such a behaviour reflects directly changes in the structure of emission regions and their beam pattern with the luminosity changes.
For instance, at very high luminosities , the cyclotron energy profile has double-peaked shape almost coinciding with the pulse profile. With the decrease of the source intensity to the cyclotron energy profile is transformed to the single broad peak with the maximum at the same phases where the pulse profile peaks. Such a shape remains more or less stable till the luminosity of . At even lower luminosities below the maximum of the cyclotron energy profile moves to the inter-peak minimum of the pulse profile.
We interpreted these observational results qualitatively in the framework of the recently proposed reflection model for the cyclotron line formation (Poutanen et al., 2013). Nevertheless, it is necessary to say that deep observations with more sensitive instruments in hard X-rays (e.g., NuSTAR) are needed to make quantitative conclusions and verify an applicability of competitive models (see, e.g., Nishimura, 2014).
Acknowledgements
This work was supported by the Russian Scientific Foundation grant 14-12-01287 (AAL, AAM). Authors also acknowledge support for grant RFBR 12-02-97006-r-povolzhe-a, Deutsche Forschungsgemeinschaft (DFG) grant WE 1312/48-1, the COST Action MP1304 and the Magnus Ehrnrooth Foundation (VFS), the Deutsches Zentrums für Luft-und Raumfahrt and DFG grant DLR 50 OR 0702 (VD), the Saint Petersburg State University grants 6.0.22.2010, 6.38.669.2013, 6.38.18.2014 (DIN), and the Academy of Finland grant 268740 (JP). The research used the data obtained from the HEASARC Online Service provided by the NASA/GSFC.
References
- Annala & Poutanen (1999) Annala M., Poutanen J., 2010, A&A, 520, A76
- Araya & Harding (1999) Araya R. A., Harding A. K., 1999, ApJ, 517, 334
- Araya-Góchez & Harding (2000) Araya-Góchez R. A., Harding A. K., 2000, ApJ, 544, 1067
- Basko & Sunyaev (1976) Basko M. M., Sunyaev R. A., 1976, MNRAS, 175, 395
- Becker et al. (2012) Becker P. A. et al., 2012, A&A, 544, A123
- Becker & Wolff (2007) Becker P., Wolff M., 2007, ApJ, 654, 435
- Beloborodov (2002) Beloborodov A., 2002, ApJ, 566, L85
- Bildsten et al. (1997) Bildsten L. et al., 1997, ApJS, 113, 367
- Burnard et al. (1991) Burnard D. J., Arons J., Klein R. I., 1991, ApJ, 367, 575
- Caballero & Wilms (2012) Caballero I., Wilms J., 2012, Mem. Soc. Astron. Italiana, 83, 230
- Coburn et al. (2002) Coburn W., Heindl W. A., Rothschild R. E., Gruber D. E., Kreykenbohm I., Wilms J., Kretschmar P., Staubert R., 2002, ApJ, 580, 394
- dal Fiume et al. (2000) dal Fiume D. et al., 2000, Adv. Sp. Res., 25, 399
- Filippova et al. (2005) Filippova E. V., Tsygankov S. S., Lutovinov A. A., Sunyaev R. A., 2005, Astr. Lett., 31, 729
- Fürst et al. (2011) Fürst F. et al., 2011, A&A, 535, A9
- Isenberg et al. (1998) Isenberg M., Lamb D. Q., Wang J. C. L., 1998, ApJ, 505, 688
- Kaminker et al. (1976) Kaminker A. D., Fedorenko V. N., Tsygan A. I., 1976, Soviet Ast., 20, 436
- Kaminker et al. (1982) Kaminker A. D., Pavlov G. G., Shibanov I. A., 1982, Ap&SS, 86, 249
- Kaminker et al. (1983) Kaminker A. D., Pavlov G. G., Shibanov I. A., 1983, Ap&SS, 91, 167
- Klochkov et al. (2008) Klochkov D., Santangelo A., Staubert R., Ferrigno C., 2008, A&A, 491, 833
- Kreykenbohm et al. (2005) Kreykenbohm I. et al., 2005, A&A, 433, L45
- Kreykenbohm et al. (2004) Kreykenbohm I., Wilms J., Coburn W., Kuster M., Rothschild R. E., Heindl W. A., Kretschmar P., Staubert R., 2004, A&A, 427, 975
- Lutovinov & Tsygankov (2009a) Lutovinov A. A., Tsygankov S. S., 2009a, Astr. Lett., 35, 433
- Lutovinov & Tsygankov (2009b) Lutovinov A., Tsygankov S., 2009b, in The Extreme Sky: Sampling the Universe above 10 keV, p. 10
- Lutovinov & Tsygankov (2011) Lutovinov A., Tsygankov S., 2011, in Fast X-ray Timing and Spectroscopy at Extreme Count Rates (HTRS 2011), p. 60
- Lyubarskii & Syunyaev (1988) Lyubarskii Y. E., Syunyaev R. A., 1988, Sov. Astr. Lett., 14, 390
- Makishima et al. (1990) Makishima K. et al., 1990, ApJ, 365, L59
- Mihara (1995) Mihara T., 1995, PhD thesis, Dept. of Physics, Univ. of Tokyo
- Mihara et al. (1990) Mihara T., Makishima K., Ohashi T., Sakao T., Tashiro M., 1990, Nature, 346, 250
- Mowlavi et al. (2006) Mowlavi N. et al., 2006, A&A, 451, 187
- Mukherjee & Bhattacharya (2012) Mukherjee D., Bhattacharya D., 2012, MNRAS, 420, 720
- (31) Mushtukov A. A., Suleimanov V. F., Tsygankov S. S., Poutanen J., 2014, MNRAS, accepted (arXiv:1409.6457)
- Nakajima et al. (2010) Nakajima M., Mihara T., Makishima K., 2010, ApJ, 710, 1755
- Negueruela et al. (1999) Negueruela I., Roche P., Fabregat J., Coe M. J., 1999, MNRAS, 307, 695
- Nishimura (2008) Nishimura O., 2008, ApJ, 672, 1127
- Nishimura (2014) Nishimura O., 2014, ApJ, 781, 30
- Raichur & Paul (2010) Raichur H., Paul B., 2012, MNRAS, 406, 2663
- Pottschmidt et al. (2005) Pottschmidt K. et al., 2005, ApJ, 634, L97
- Poutanen et al. (2013) Poutanen J., Mushtukov A. A., Suleimanov V. F., Tsygankov S. S., Nagirner D. I., Doroshenko V., Lutovinov A. A., 2013, ApJ, 777, 115
- Schönherr et al. (2007) Schönherr G., Wilms J., Kretschmar P., Kreykenbohm I., Santangelo A., Rothschild R. E., Coburn W., Staubert R., 2007, A&A, 472, 353
- Serber (2000) Serber A. V., 2000, Astr. Rep., 44, 815
- (41) Suleimanov, V. F., Pavlov, G. G., Werner, K., 2012, ApJ, 751, 15
- Swank et al. (2004) Swank J., Remillard R., Smith E., 2004, ATel, 349, 1
- Tsygankov & Lutovinov (2009) Tsygankov S., Lutovinov A., 2009, in The Extreme Sky: Sampling the Universe above 10 keV, p. 70
- Tsygankov et al. (2006) Tsygankov S. S., Lutovinov A. A., Churazov E. M., Sunyaev R. A., 2006, MNRAS, 371, 19
- Tsygankov et al. (2010) Tsygankov S. S., Lutovinov A. A., Serber A. V., 2010, MNRAS, 401, 1628
- Tsygankov et al. (2012) Tsygankov S. S., Krivonos R. A., Lutovinov A. A., 2012, MNRAS, 421, 2407