Complete phase diagram and topological properties of interacting bosons in one-dimensional superlattices
Abstract
The interacting bosons in one-dimensional inversion-symmetric superlattices are investigated from the topological aspect. The complete phase diagram is obtained by an atomic-limit analysis and quantum Monte Carlo simulations and comprises three kinds of phases: superfluid, persisted charge-density-wave and Mott insulators, and emergent insulators in the presence of nearest-neighbor hoppings. We find that all emergent insulators are topological, which are characterized by the Berry phase and a pair of degenerate in-gap boundary states. The mechanism of the topological bosonic insulators is qualitatively discussed and the ones with higher fillings can be understood as a -filling topological phase on a background of trivial charge-density-wave or Mott insulators.
pacs:
03.65.Vf, 73.21.Cd 37.10.Jk 67.85.HjI Introduction
Topological phases of matter have bulk gap but gapless boundary states rev1 ; rev2 ; rev3 ; rev4 . These studies have been extended to interacting fermions and bosons. Specially much progress has been made for one-dimensional (1D) topological bosonic phases. Classification schemes have been proposed for such phases bcla0 ; bcla1 ; bcla2 . It is recognized that long-known 1D Haldane phase for spin-1 chain is a topological bosonic phase haldane . While these studies are important for our understanding of topological bosonic states, it is also highly desirable to study nontrivial bosonic phases in experimental accessible systems.
Motivated by the experimental progress in studying topological phases with ultracold atoms cold1 , exploring topologically nontrivial phases of interacting bosons in 1D superlattices has attracted intensive attentions. It is found that by simply replacing free fermions with interacting bosons in 1D topological superlattices tf1 ; tf2 ; su1 , the resulting extended Bose-Hubbard models display nontrivial topological property tb1 ; tb2 ; tb3 ; tb4 ; tb5 , which are well understood from the hard-core limit. As the Bose-Hubbard model exhibits rich quantum phases due to multiple occupations of bosons on a single site bhm1 ; bhm2 ; jordan , one may expect some novel phenomena emerging in topologically nontrivial superlattice systems beyond the hard-core limit. As we shall display in this work, surprisingly plentiful phase diagram, including the emergence of topological bosonic insulators at both fractional and integer fillings and various phase transitions induced by varying the chemical potential and the strength of superlattice potential, are found in the simple superlattice system, which is realizable in cold-atom experiments cold2 ; Roati .
We firstly determine the complete phase diagram of the system by a combination of atomic-limit analysis and quantum Monte Carlo (QMC) simulations. While the phase diagram in the atomic limit contains charge-density-wave (CDW) and Mott insulating phases with various fillings, these insulating phases persist but are separated by superfluid phases when hopping terms are included. It is interesting that some nontrivial insulating phases emerge between two adjacent persisted insulators and these emergent insulators are topologically nontrivial, characterized by the Berry phase . On the other hand, the persisted insulators are topologically trivial as they are adiabatically connected to the insulators in the atomic limit. The nontrivial topological property of the emergent insulators is further confirmed by the presence of a pair of degenerate in-gap boundary states under open boundary condition (OBC), which leads to the splitting of topological plateau in the curve. By varying the superlattice strength, one may observe phase transitions between the topologically different insulating phases. Our results present a complete understanding on the topological phase diagram of interacting bosons in 1D superlattices, which may shed light on the experimental exploration of the predicted exotic topological phases and phase transitions.
II Model of interacting bosons in 1D superlattices
We consider the interacting bosons loaded into the optical superlattice with inversion symmetry in the grand canonical ensemble, whose basic physics is described by the extended Bose-Hubbard model with a superlattice potential:
| (1) | |||
where () is the bosonic annihilation (creation) operator, is the number operator of bosons, the hopping amplitude is set to be the unit of the energy , represents a superlattice potential with the period , represents the strength of on-site interactions, and is the chemical potential. The inversion symmetry further requires with , which can be realized by a simple bichromatic superlattice potential by tuning the phase to or , with the strength of the potential Roati . Without loss of generality, we shall focus our study on the case with and in the following calculations.
In the hard-core limit , Eq.(1) can be mapped to the free fermionic model in the superlattice jordan , which has been shown that 1D topological phases protected by inversion symmetry exist at inversion-symmetric point for fillings of , respectively spt . The 1D topological phase is characterized by the Berry phase, , with the Berry connection and the occupied Bloch state berry1 ; berry2 ; zak . Due to the protection of the inversion symmetry, the Berry phase mod takes two values: for a topological phase and for a trivial phase. Corresponding to the nontrivial Berry phase , there appear a pair of degenerate in-gap states under OBC, whose distributions are localized near the boundaries.
III Phase diagram of softcore case
It is useful to firstly consider the atomic limit . Whether a boson can be added to the th site with bosons is determined by the energy difference with the total energy of the bosons on the th site. If , the total energy is lowered and one more boson can be added to the site. Thus a series of lines determined by separate different insulating phases. The phase diagram of the atomic limit in the plane is shown in Fig.1(a). The set of parallel lines determine the occupation on the middle site of the unit cell and the separated regions have gradually increasing occupation numbers. The set of parallel lines determine the occupation on the side sites. There are two kinds of insulators in the phase diagram: Mott insulator with a uniform density (or ) with the number of bosons on the side (middle) sites of the unit cell; CDW insulator with a density profile reflecting the modulation and an average density . Different insulators are characterized by the values of structure factor . For the Mott insulators, the structure factor has one peak at with . In the CDW insulator, a peak develops at with .
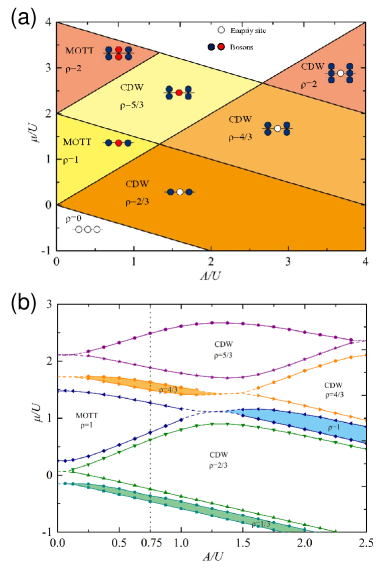
Next we turn on nearest-neighbor (NN) hoppings and the phase diagram obtained from QMC simulations is shown in Fig.1(b). Compared to the atomic one, the phase diagram is considerably modified. Although each insulator in the atomic limit persists, the phase boundaries are deformed and incommensurate superfluid regions appear between the commensurate insulating regions. Moreover between two adjacent regions separated by the line , a insulator with intermediate filling emerges ( are the fillings of the two regions). Except of the insulator with , the emergent insulating regions are connected to the persisted ones with the same fillings, e.g., the shaded regions in Fig.1(b) with and , and are separated from others by superfluid phases.
The above phase diagram is obtained by calculating the structure factor ,
| (2) |
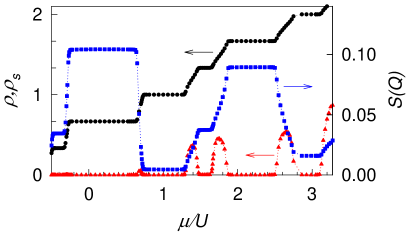
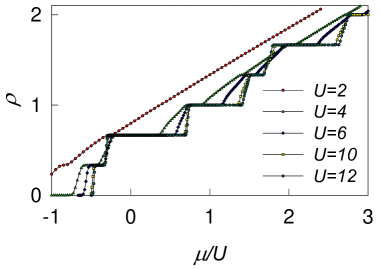
and the superfluid density with the winding number and the inverse temperature sandvik . An insulator is characterized by and , while a superfluid phase by and . To see the details, we present the numerical results on the cut with fixed in the phase diagram, along which all the typical insulating phases are met. As shown in Fig.2, the average density exhibits various plateaus at commensurate fillings, on which the superfluid density vanishes. So the plateaus correspond to the imcompressive insulators, whose gaps are the widths of the plateaus. Between the insulators, the average density increases continuously with the chemical potential and the superfluid density is finite, implying the system is in superfluid phase. Among the insulators, those persisted Mott and CDW insulators are distinguished by the values of the structure factors (see the Appendix).
IV Topological property of the insulators
The topological property of the interacting bosonic insulators is characterized by the Berry phase defined with the twisted boundary phase exact ; twist1 ,
| (3) |
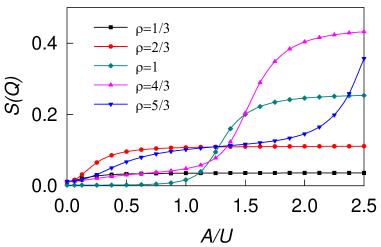
where takes values from to and is the corresponding many-body ground-state wave-function. In Fig.3(a), we calculate the Berry phase as a function of the strength of the superlattice potential at different fillings. The () insulators are in one piece of the phase diagram. For the insulators, the Berry phase is and they are topological. However for the insulators, the Berry phase is , thus they are trivial. There are two pieces for the insulators with (), which are connected at a critical point. For insulators, the Berry phase changes its value from to at the critical point, implying the insulators emerging at large are topological ones. However for insulators, the Berry phase changes its value from to at the critical point, and the insulators emerging at small are topological ones. The topological property of insulators at other fillings can be analyzed similarly. So phase transitions between topologically different insulators can be realized by tuning the superlattice strength. Moreover these results provide a complete understanding of the topological properties of the insulating phases exhibited by interacting bosons in 1D superlattices: all emergent insulators in the presence of NN hoppings are topological, while those persisted CDW or Mott insulators are trivial since they are adiabatically connected to the atomic ones.
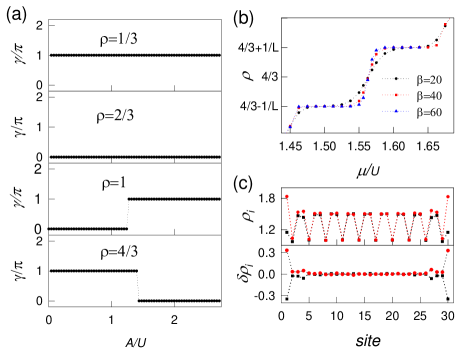
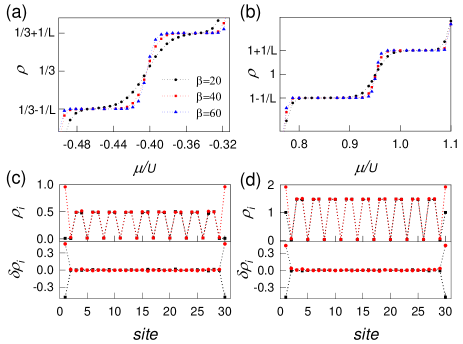
Due to the bulk-boundary correspondence, there should appear a pair of degenerate in-gap boundary states under OBC in the topological phases. The plateau of the topological insulating phase in the curve should be altered: below the critical chemical potential corresponding to the energy of the in-gap states, none of the in-gap states are occupied and the average density changes to ; above the critical chemical potential, both of the in-gap states are occupied and the average density changes to . It is verified by our QMC simulations. As shown in Fig.3(b), the plateaus of the topological phases split into two pieces with a jump at the critical chemical potential and the magnitude of the jump is exactly . Moreover the jump tends to be vertical in the limit of zero temperature, implying the two in-gap states are degenerate. To verify the in-gap states are boundary ones, we calculate the distribution of the bosons under OBC on two representative points of the split plateaus. As shown in Fig.3 (c), the distribution on the bulk sites are nearly unchanged, thus the filling of the in-gap states happens near the boundaries. When none of the in-gap states are filled (the lower plateau), there is - fractional boson less at each boundary compared to the bulk sites. However after both are filled (the higher plateau), there is - fractional boson more. The results for the topological phases with other fillings are similar. As a contrast, we do not observe the splitting of plateaus and boundary states for trivial insulators. Thus our results give clear evidence that in the topological phases a pair of degenerate in-gap states appear and they are localized near the boundaries.
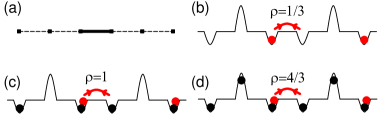
The nature of the topological phases can be qualitatively understood from the aspect of their analog to the famous topological trimerized model su2 , whose configuration is shown in Fig. 4 (a). The main character of the model is that the bonds connecting different unit cells have larger hopping amplitude, while those inside a unit cell are equal and smaller. For the topological bosonic insulating phase at filling, the bosons tend to reside on the sites in the minima of the superlattice and averagely there is one boson on two adjacent low energy sites [see Fig.4 (b)]. Since the two sites are identical, the boson can hop freely between them with a larger amplitude to gain more kinetic energy. However the hoppings between other sites are barriered by the potentials and the amplitudes are relatively small. Thus the effective hopping amplitudes form a configuration similar to that of the topological trimerized model and the system exhibits nontrivial topological property. The topological phase at higher filling is similar except that it has a background of CDW or Mott insulator with , e.g., the cases with the fillings shown in Fig.4 (c), (d). Furthermore the qualitative picture is consistent with the values of the structure factor (see the Appendix). So we can term the topological phases with higher fillings as topological bosonic CDW or Mott insulators depending on the background.
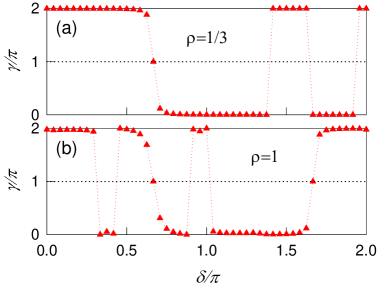
Finally we emphasize that although the system exhibits emergent insulating phases at other s where there are two identical sites in one unit cell, only those emerging at inversion- symmetric points are topological. In Fig.5, we calculate the Berry phase as a function of at two typical fillings for . It shows that the Berry phases of the insulators are only quantized to 0 or at inversion-symmetric points. However when an insulator is emergent, its Berry phase has nontrivial value . So the identified topological bosonic insulators are protected by inversion symmetry, which provide concrete models for the classifications of 1D topological bosonic phases bcla0 ; bcla1 .
V Summary
We study the topological phase diagram of interacting bosons in 1D superlattices with inversion symmetry. The complete phase diagram is obtained and the topological properties of the identified insulators are determined. It is found that the persisted CDW and Mott insulators are topological trivial since they are adiabatically connected to the atomic ones, while all emergent ones are topologically nontrivial. We present a qualitative mechanism for the topological bosonic insulators. This finding is of interests to cold-atom experiments. The studied model represents a simple experimentally accessible system and the various topological bosonic phases can be realized. One may use Bloch oscillations to measure the Berry phase cold2 , and in situ microscopy to detect the boundary states exp1 ; exp2 ; exp3 .
Acknowledgements.
This work is supported by NSFC under Grants Nos. 11274032, 11104189 (H. G.); Nos. 11425419, 11374354 and 11174360 (S. C.), and the Research Grant Council of Hong Kong under Grant No. HKU7037 13P (S. S. and H. G.).Appendix A More results from QMC simulations
We use QMC simulations to identify different insulators. Among them the trivial CDW and Mott insulators are distinguished by the values of the structure factor at . However one should notice the fact that the limit values are reached when is away from the critical points, while the values deviate much from the atomic ones near the critical points, as shown in Fig.6.
For the emergent nontrivial insulators, the values of the structure factor support our qualitative physical picture of the topological phases with higher fillings. In the picture, we can approximate: , with the boson number of CDW or Mott insulating backgrounds and that of a -filling topological phase. Then we have , where
The value of the structure factor in the topological phase away from the critical points can be approximated by the above formulas.
For the phase diagram of the softcore case, we take the on-site interaction . We also perform QMC simulations with other values of . As shown in Fig.7, some insulating phases tend to vanish when is decreased, which are replaced by the superfluid phases.
We show the QMC simulations under OBC for the topological phase with the filling in Sec.IV. The splitting of topological plateau reflects the existence of the topological boundary states and the results are general for all topological phases. In Fig.8 we show two other cases with the fillings , and similar results are obtained.
References
- (1) J. E. Moore, Nature 464, 194 (2010).
- (2) M. Z. Hasan and C. L. Kane, Rev. Mod. Phys. 82, 3045 (2010).
- (3) X. L. Qi and S. C. Zhang, Rev. Mod. Phys. 83, 1057 (2011).
- (4) S. Q. Shen, Topological Insulators (Springer, Berlin, 2012).
- (5) Y.-Z. You and C. Xu, Phys. Rev. B90, 245120 (2014).
- (6) X. Chen, Z.-C. Gu, and X.-G.Wen, Phys. Rev. B83, 035107 (2011).
- (7) X.-G. Wen, Phys. Rev. B89, 035147 (2014).
- (8) F. D. M. Haldane, Phys. Lett. A 93, 464 (1983).
- (9) V. Galitski, and I. B. Spielman, Nature 494, 49 (2013).
- (10) L. J. Lang, X. Cai and S. Chen, Phys. Rev. Lett. 108, 220401 (2012).
- (11) S. Ganeshan, K. Sun and S.D. Sarma, Phys. Rev. Lett. 110 180403 (2013).
- (12) W. P. Su, J. R. Schrieffer and A. J. Heeger, Phys. Rev. B22, 2099 (1980).
- (13) S.-L. Zhu, Z.-D. Wang, Y.-H. Chan and L.-M. Duan, Phys. Rev. Lett. 110, 075303 (2013).
- (14) F. Grusdt, M. Honing and M. Fleischhauer, Phys. Rev. Lett. 110, 260405 (2013).
- (15) X. Deng and L. Santos, Phys. Rev. A89, 033632 (2014).
- (16) R. Barnett, Phys. Rev. A88, 063631 (2013).
- (17) F. Matsuda, M. Tezuka, and N. Kawakami, J. Phys. Soc. Jpn. 83, 083707 (2014).
- (18) T. Kuhner, and H. Monien, Phys. Rev. B58, 14741R, (1998).
- (19) B.-L. Chen, S.-P. Kou, Y. Zhang, and S. Chen, Phys. Rev. A 81, 053608 (2010).
- (20) V.G. Rousseau, D.P. Arovas, M. Rigol, F. Hebert, G.G. Batrouni and R.T. Scalettar, Phys. Rev. B73, 174516 (2006).
- (21) M. Atala, M. Aidelsburger, J. T. Barreiro, D. Abanin, T. Kitagawa, E. Demler and I. Bloch, Nature Phys. 9, 795 (2013).
- (22) G. Roati, C. D’ Errico, L. Fallani, M. Fattori, C. Fort, M. Zaccanti, G. Modugno, M. Modugno, and M. Inguscio, Nature (London) 453, 895 (2008).
- (23) H. M. Guo, and S. Chen, Phys. Rev. B91, 041402(R) (2015); C. Yang, H. M. Guo, L.-B. Fu, and S. Chen, Phys. Rev. B91, 125132 (2015).
- (24) R. Resta, Rev. Mod. Phys. 66, 899 (1994).
- (25) D. Xiao, M.C. Chang and Q. Niu, Rev. Mod. Phys. 82, 1959 (2010).
- (26) J. Zak, Phys. Rev. Lett. 62, 2747 (1989).
- (27) Olav F. Syljuosen, and Anders W. Sandvik, Phys. Rev. E66, 046701 (2002).
- (28) J. M. Zhang and R.X. Dong, Eur. J. Phys. 31, 591 (2010).
- (29) H. M. Guo and S. Q. Shen, Phys. Rev. B84, 195107 (2011); H. M. Guo, S. Q. Shen and S. P. Feng, Phys. Rev. B86, 085124 (2012).
- (30) W. P. Su and J. R. Schrieffer, Phys. Rev. Lett. 46, 738 (1981).
- (31) W. S. Bakr, A. Peng, M. E. Tai, R. Ma, J. Simon, J. I. Gillen, S. Folling, L. Pollet, and M. Greiner, Science 329, 547 (2010).
- (32) J. F. Sherson, C. Weitenberg, M. Endres, M. Cheneau, I. Bloch, and S. Kuhr, Nature (London) 467, 68 (2010).
- (33) C. Weitenberg, M. Endres, J. F. Sherson, M. Cheneau, P. Schausz, T. Fukuhara, I. Bloch, and S. Kuhr, Nature (London) 471, 319 (2011).