Detailed study of parton energy loss via measurement of
fractional momentum loss of high hadrons in heavy ion collisions
Takao Sakaguchi
for the PHENIX Collaboration
Brookhaven National Laboratory, Physics Department, Upton, NY 11973-5000, USA
takao@bnl.gov
Abstract
PHENIX measurement of the fractional momentum loss () of
high identified hadrons are presented. The of high which are computed from 39 GeV Au+Au over to 2.76 TeV Pb+Pb are found
to vary by a factor of six. We plotted the against several
global variables, , and , and found global features.
It was found that 200 GeV Au+Au points are merging into the central
2.76 TeV Pb+Pb points when plotting against .
1 Introduction
The interaction of hard scattered partons with the medium created by heavy ion
collisions (i.e., quark-gluon plasma, QGP) has been of interest since the
beginning of the RHIC running [1]. A large suppression of the
yields of high transverse momentum () hadrons which are the fragments of
such partons was observed, suggesting that the matter is sufficiently dense
to cause parton-energy loss prior to hadronization [2].
The PHENIX experiment [3] has been exploring the highest
region with single mesons which are leading hadrons of jets.
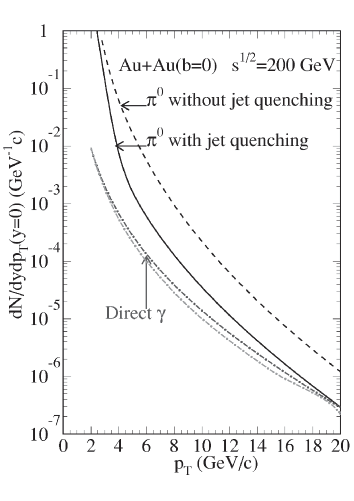
We show a calculation on the energy loss of partons published almost
20 years ago in Fig. 1(a).
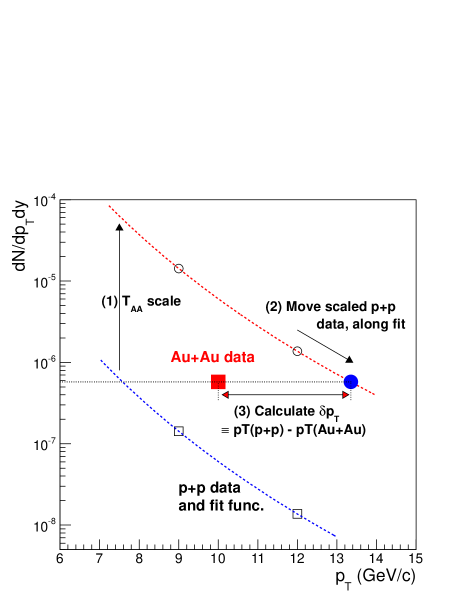
Figure 1: (a, left) A calculation demonstrating that the suppression of the
yield is resulted in from the shift of the momentum
spectra in A+A collisions. (b, right) Method of calculating average .
We scaled the yield by corresponding to centrality
selection of Au+Au data, shifted the points closest to Au+Au in yield,
and calculated the momentum difference of and Au+Au points.
Although the measurement of the momentum shift is the ultimate goal,
the paper suggested looking at
the ratio of the high single hadrons in Au+Au and p+p collisions
as an alternate way. Since then, most of the experiments including
PHENIX have looked at the nuclear modification factors,
(),
and quantified the energy loss effect via its suppression.
We here present the momentum shift of high hadrons instead of .
2 Fractional momentum loss
With a larger statistics of both and AuAu data recently collected,
it became possible to measure the momentum shift directly.
Fig. 1(b) depicts the method to compute such shift.
We have statistically extracted the fractional momentum loss
(, , where is the transverse
momentum of the data, and ’ is that of the Au+Au data) of the
partons using the hadron spectra measured in and Au+Au
collisions [4].
Since the number of data points is finite, a fit to the scaled is
needed to evaluate at a given AuAu invariant yield.
The uncertainty of the is calculated by inversely converting
the quadratic sum of the uncertainties on the yields of AuAu and points, using the fit function. Statistical and systematic
uncertainties are individually calculated in the same way. The
uncertainties on and p+p luminosity are not plotted but mentioned
in plots.
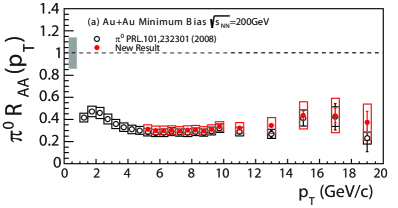
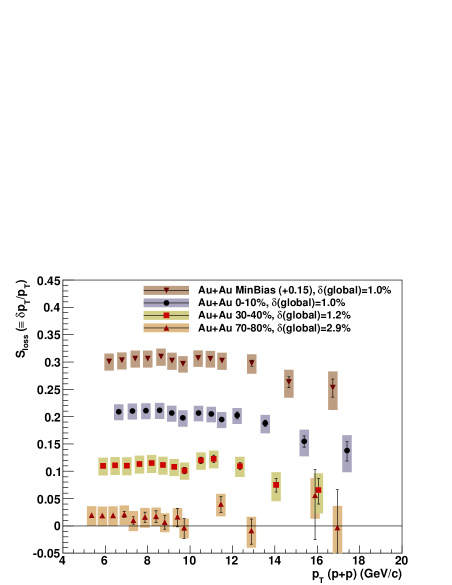
Fig. 2(a) show the for the ’s in Au+Au collisions
at =200 GeV from the RHIC Year-7 run. Using the calculation
method, we obtained the for the same dataset as shown in
Fig. 2(b).
Figure 2: (a, left) of ’s for 200 GeV Au+Au collisions obtained from RHIC Year-7 run. (b, right) for the same dataset.
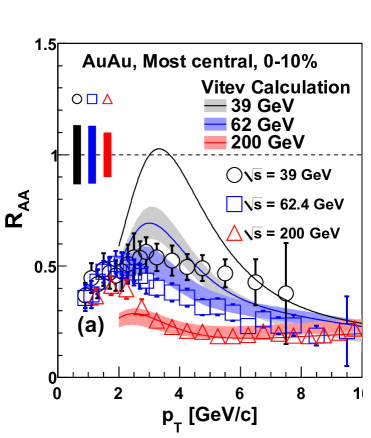
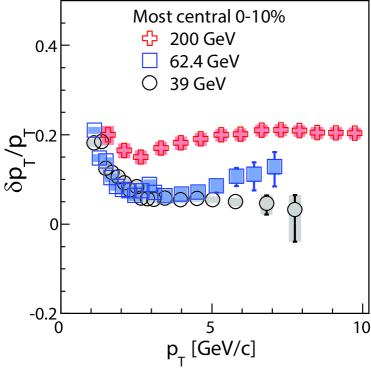
Similarly, the for the ’s in 0-10 % Au+Au
collisions at =39, 62 and 200 GeV from the RHIC Year-7 and Year-10
runs shown in Fig. 3(a) are replotted in the form of as shown in Fig. 3(b).
Figure 3: (a, left) of ’s for 39, 62 in 0-10 % Au+Au collisions obtained from RHIC Year-10 run and in 0-10 % 200 GeV Au+Au collisions from RHIC Year-10 run. (b, right) for the same dataset.
The ’s look similar even the cms energies are changed by a factor
of 5 as seen in Fig. 3(a). However, when we look at for the
corresponding dataset, we found that the changes by a factor of
three from 39 to 200 GeV as shown in Fig. 3(b) [5].
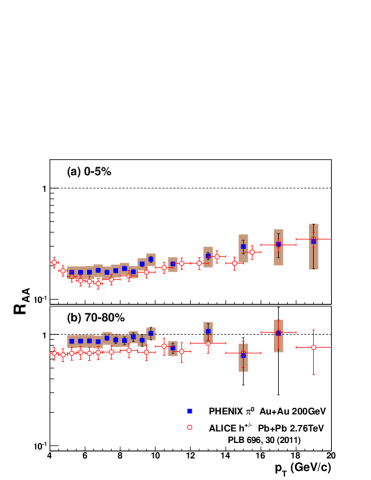
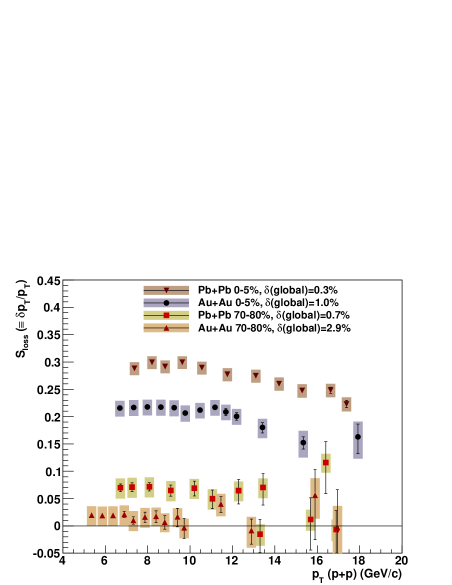
The ’s also look similar between RHIC and LHC (Fig. 4(a)).
Figure 4: (a, left) of ’s for 200 GeV Au+Au collisions obtained from RHIC Year-7 run and charged hadrons for 2.76 TeV Pb+Pb collisions obtained by the ALICE experiment at LHC [6]. (b, right) for the same dataset.
Similarly, the is found to change by a factor of from
200 to 2.76 TeV (Fig. 4(b)).
To summarize, even the ’s are similar, the ’s show a factor
of six variation from 39 GeV to 2.76 TeV. This fact has not been found
by looking at .
3 Scaling property of
In order to study the systematics of , we plot the against
several global variables such as , (number of quark
participants) and . We first plotted the against as shown in Fig. 5.
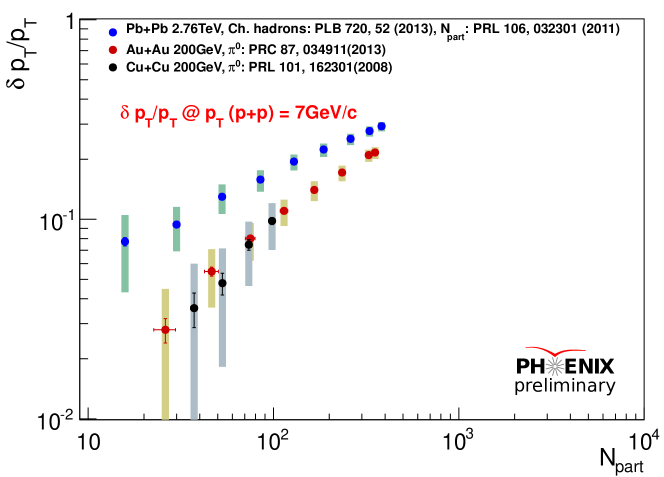
Figure 5: as a function of for ’s in 200 GeV Au+Au and Cu+Cu collisions measured by PHENIX and charged hadrons in 2.76 TeV Pb+Pb collisions measured by ALICE.
All the plots shown in this section are at GeV/c in
order to reach the hard scattering regime. In the scaling
we see that the Cu+Cu and Au+Au are nicely lined up, implying that within
the same cms energy, the scales with . This is consistent
with the fact that is similar at same between Cu+Cu and
Au+Au collisions [7]. The Pb+Pb points are consistently
off the trend of 200 GeV points, but the slopes of both systems look
similar. Fig. 6 shows against .
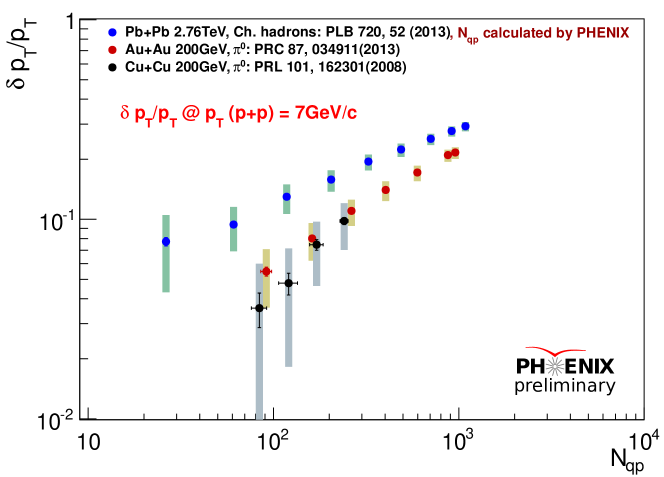
Figure 6: as a function of for ’s in 200 GeV Au+Au and Cu+Cu collisions measured by PHENIX and charged hadrons in 2.76 TeV Pb+Pb collisions measured by ALICE.
The detail description of how the number of quark participants
are obtained can be found in the literature [8].
We employed a Monte-Carlo-Glauber (MC-Glauber) model to calculate
the numbers. We first determine the quark-quark inelastic cross section
() for each collision energy such that the
inelastic nucleon-nucleon cross section ()
is reproduced. Then the model is modified to handle the quark-quark
rather than nucleon-nucleon collisions.
The nuclei are placed according to a Woods-Saxon distribution and
then three quarks are distributed around the center of each nucleon
following the distribution of:
where fm-1 and fm
is the rms charge radius of the proton.
A pair of quarks, one from each nucleus, interact with each other
if their distance in the plane transverse to the beam axis
satisfies the condition of .
The number of quark participants as a function of the number of
nucleon participants is nonlinear, especially for low values of .
In Fig. 6, the similar feature as the previous plot is
seen. Since the is a factor of 2-3 higher than , all
the points are systematically moved to the right.
Finally, we plotted the against the charged multiplicity,
, as shown in Fig. 7.
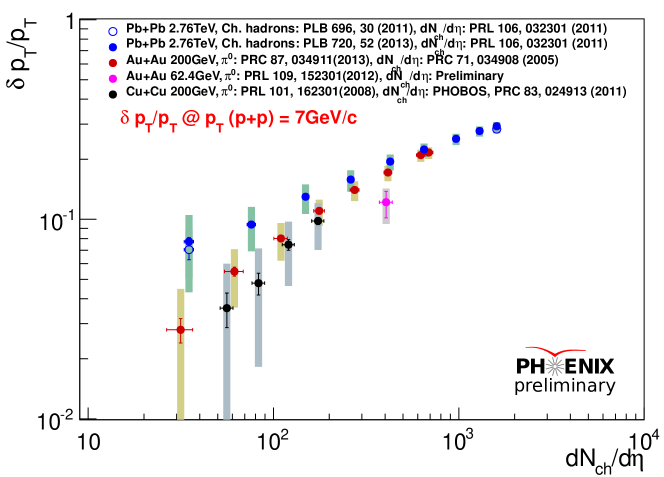
Figure 7: as a function of for ’s in Au+Au collisions at 200 GeV and 62.4 GeV, and in Cu+Cu collisions at 200 GeV measured by PHENIX and charged hadrons in 2.76 TeV Pb+Pb collisions measured by ALICE.
In this plot, we added one 62 GeV Au+Au point which is 0-10 % centrality.
We expect that well represents the energy density of the system.
It is interesting to note that the most central Au+Au 200 GeV points tend
to merge into the most central points of Pb+Pb collisions, while they
deviate each other as going to lower . This systematic trend has
not been found by looking at ’s which look similar across the systems.
In order to cross-check this new result, we have performed a power-law
fit to vs points from 200 GeV Au+Au collisions, and
compared the power with the result obtained from a different
method [9]. We fitted the points of this work with
assuming
()1.19 [10], and obtained
as 0.640.07.
Assuming the spectra shape follows a power-law with the power , one can
write the relation between and as:
Following this relation, we obtained the power as 0.570.13 from
the fit to the integrated as a function of in the
literature [9]. We therefore confirmed that the powers
obtained by the two methods are consistent.
4 Summary
We presented PHENIX measurement of the fractional momentum loss ()
of high identified hadrons. By looking at
the instead of , we found many interesting features.
The of high which are computed from 39 GeV Au+Au
over to 2.76 TeV Pb+Pb are found to vary by a factor of six.
We plotted the against several global variables, , and
. It was found that 200 GeV Au+Au points are merging into the
central 2.76 TeV Pb+Pb points when plotting against .
We performed a power-law fit to the vs , and
obtained a power that is consistent with the one obtained from the fit to
the integrated .
We are going to add points from other systems to systematically
investigate the .
References
References
[1]
X. -N. Wang,
Phys. Rev. C 58, 2321 (1998).
[2]
S. S. Adler et al. [PHENIX Collaboration],
Phys. Rev. Lett. 91, 072301 (2003).
[3]
K. Adcox et al. [PHENIX Collaboration],
Nucl. Instrum. Meth. A 499, 469 (2003).
[4]
A. Adare et al. [PHENIX Collaboration],
Phys. Rev. C 87, 034911 (2013).
[5]
A. Adare et al. [PHENIX Collaboration],
Phys. Rev. Lett. 109, 152301 (2012).
[6]
K. Aamodt et al. [ALICE Collaboration],
Phys. Lett. B 696, 30 (2011).
[7]
A. Adare et al. [PHENIX Collaboration],
Phys. Rev. Lett. 101, 162301 (2008)
[arXiv:0801.4555 [nucl-ex]].
[8]
S. S. Adler et al. [PHENIX Collaboration],
Phys. Rev. C 89, no. 4, 044905 (2014).
[9]
A. Adare et al. [PHENIX Collaboration],
Phys. Rev. Lett. 101, 232301 (2008).
[10]
S. S. Adler et al. [PHENIX Collaboration],
Phys. Rev. C 71, 034908 (2005)
[Erratum-ibid. C 71, 049901 (2005)].