Spread of Infectious Diseases with a Latent Period
Abstract
Infectious diseases spread through human networks. Susceptible-Infected-Removed (SIR) model is one of the epidemic models to describe infection dynamics on a complex network connecting individuals. In the metapopulation SIR model, each node represents a population (group) which has many individuals. In this paper, we propose a modified metapopulation SIR model in which a latent period is taken into account. We call it SIIR model. We divide the infection period into two stages: an infected stage, which is the same as the previous model, and a seriously ill stage, in which individuals are infected and cannot move to the other populations. The two infectious stages in our modified metapopulation SIR model produce a discontinuous final size distribution. Individuals in the infected stage spread the disease like individuals in the seriously ill stage and never recover directly, which makes an effective recovery rate smaller than the given recovery rate.
1 Introduction
Infectious diseases spread through human networks. Susceptible-Infected-Removed (SIR) model is one of the epidemic models to describe infection dynamics on a complex network connecting individuals. The ratio of the transmission rate to the recovery rate is called the basic reproduction number . It is the expected number of infections caused by a typical infectious individual in a completely susceptible population Anderson91 ; Ma . In the standard SIR model, the outbreak occurs when . The likely magnitude of the outbreak, which is called the expected final size of the epidemic, depends only on Ma ; Anderson80 .
The spread of infectious diseases also depends on human mobility. In metapopulation SIR models, movements between different populations (groups) are taken into account Keeling ; Cross ; Colizza . Each node of the metapopulation network represents a group of individuals. Individuals can move between two nodes connected by a link. Although the epidemic threshold is in each group, the global invasion threshold in the metapopulation system depends on the mobility rate as well as its network structure Cross ; Colizza .
In this paper, we propose a modified metapopulation SIR model in which a latent period is taken into account. Infected individuals behave like susceptible ones when they do not feel sick. They move between linked populations and spread diseases across different populations. We consider that such infected individuals are in a latent period. We assume that infected individuals become too sick to move after the latent period. Such ill individuals infect only the susceptible ones in the same population. This model is different from the SEIR model Schwartz , which is a common epidemic model in which a latent period is incorporated as an “Exposed” state. However, it belongs to a family of generalized SIR models that include multiple infectious stages Ma . The two infectious stages in our modified metapopulation SIR model produce a discontinuous final size distribution with a jump at .
The rest of the paper is organized as follows. The metapopulation SIR model and the modified SIR model are introduced in Sec. 2. We demonstrate the discontinuous final size distribution of the modified model in Sec. 3. The effective recovery rate, which is different from the given recovery rate, is estimated, and it is the key to find what causes the discontinuity. Discussions and conclusions are given in Sec. 4.
2 Model
First we introduce a metapopulation SIR model, which is an SIR model that is extended to metapopulation networks. In the metapopulation SIR model, each node represents a population (group) which has many individuals, and each individual is in one of three states: (susceptible), (infected) or (recovered). Individuals of state are infected by those of state in the same population. The infection rate is given by , where with , , and being the number of susceptible, infected, and recovered individuals of population , respectively. In other words, the rate that becomes depends on the transmission rate and the proportion of in the same population. The constant rate that becomes , i.e., recovery rate, is defined as . We here assume that all individuals move between the populations connected with links in the network at a constant rate . The travel rate is the same for all the individuals. The time evolution of the numbers of , and in each population is described by
| (1a) | |||||
| (1b) | |||||
| (1c) | |||||
where the summations are taken over all the populations connected with population .
Next, we divide the infection period into two stages: an infected stage, which is the same as the previous model, and a seriously ill stage, in which individuals are infected and cannot move to the other populations. We call this model SIIR model. In this model, each individual is in one state of (susceptible), (infected), (seriously ill), and (recovered). Individuals of in population are infected and become at rate , where . Individuals of become at a constant rate . Individuals of recover and become at a rate . In the SIIR model, individuals of move between the populations connected with links at a rate , however, individuals of do not. The time evolution of the numbers of , , and in each population is described by
| (2a) | |||||
| (2b) | |||||
| (2c) | |||||
| (2d) | |||||
where the summations are taken over all the populations connected with population .
3 Final Size Distribution
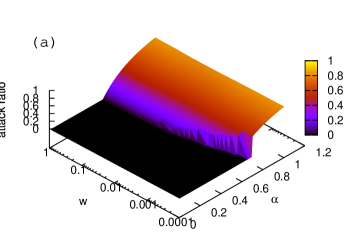
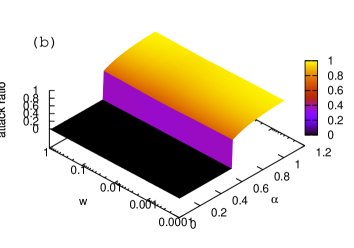
The spread of a disease is expressed by attack ratio, which is the final proportion of when disappears in the entire metapopulation. The attack ratio plotted as the function of the basic reproduction number is called a final size distribution. The final size distributions of the SIR model and SIIR models are shown in Fig. 1. In this simulation, the number of individuals in each state is taken as a real number and the time step is discrete. We use a scale-free network with 900 nodes, whose degree distribution is with . The essential results do not depend on . In the initial state, 100 susceptible individuals belong to each node except for one randomly selected node in which one infected individual is included. The global invasion does not occur when in the SIIR model as well as the SIR model. The change in attack ratio is continuous at in the high- region in the SIR model, however, it is discontinuous in all region in the SIIR model. The shift of threshold in the low- regions of the SIR model is often observed in metapopulation networks Cross ; Colizza .
In this paper, we focus on the discontinuous final size distribution of the SIIR model. The jump in the attack ratio arises from the difference between the given recovery rate and an effective recovery rate. In the SIIR model, individuals spread the disease like individuals and never become directly. Therefore, the effective recovery rate is expected to be smaller than the given recovery rate .
We show how to evaluate below. Disregarding traveling between populations, the SIIR model (2) is rewritten as
| (3a) | |||||
| (3b) | |||||
| (3c) | |||||
| (3d) | |||||
where , , and . Combining Eqs. (3b) and (3c), we have
We here take , which leads to . Then, the effective recovery rate is calculated as
| (4) |
t]
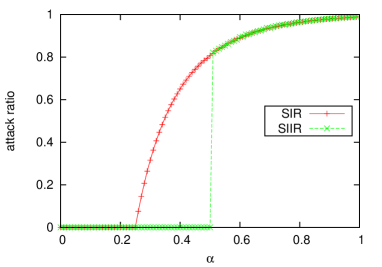
Figure 2 illustrates that the evaluation of the effective recovery rate is appropriate. The simulation is performed in the same network with the same initial condition as Fig. 1. The travel rate is , which is in the high- region. The attack ratio for the SIIR model is calculated for and . In this case, the effective recovery rate is . The final size distribution for the SIR model with the given recovery rate agrees with that for the SIIR model in the region where . This result implies the following. The effective recovery rate in the SIIR model is given by , however, global invasion cannot occur when . The difference between and causes the discontinuous final size distribution of the SIIR model.
Since we disregarded traveling between populations when we evaluate the effective recovery rate, the assumption that is immobile should be irrelevant to the discontinuity in the final size distribution of the SIIR model. We now modify the SIIR model (2), replacing Eq. (2c) by
| (5) |
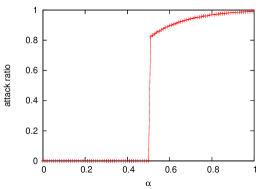
Figure 3 shows the final size distribution of the modified SIIR model. The simulation is performed in the same conditions as Fig. 2. The profile of the SIIR curve in Fig. 2 looks the same as the curve in Fig. 3. Therefore, the cause of the discontinuous final size distribution is the division of the infection period into two stages, and the mobility of has no effect on the discontinuity.
t]
4 Discussions and Conclusions
The effective recovery rate , which is given by Eq. (4), can be evaluated by another way. The basic reproduction number for the generalized SIR model that includes infectious stages is given by
| (6) |
where is the transmission rate of the th infectious stage, and is the mean duration of the stage Ma ; Hyman . In our SIIR model, , and , and thus, . Therefore,
| (7) |
which is the same as Eq. (4).
In conclusion, the discontinuous final size distribution in the SIIR model is caused by the division of the infection period into two stages and the fact that the global invasion cannot occur when . The final size distribution depends on the effective recovery rate , and its shape coincides with that of the SIR model with a recovery rate in the region where .
Acknowledgements.
We would like to thank H. Takayasu and H. Nishiura for valuable suggestions and comments.References
- (1) R.M. Anderson, R.M. May, Infectious Diseases of Humans: Dynamics and Control (Oxford University Press, Oxford, 1991).
- (2) J. Ma, D.J.D. Earn, Bull. Math. Biol. 68, 679 (2006).
- (3) D. Anderson, R. Watson, Biometrika 67, 191 (1980).
- (4) M.J. Keeling, P. Rohani, Ecol. Lett. 5, 20 (2002).
- (5) P.C. Cross, J.O. Lloyd-Smith, P.L.F. Johnson, W.M. Getz, Ecol. Lett. 8, 587 (2005).
- (6) V. Colizza, A. Vespignani, Phys. Rev. Lett. 99, 148701 (2007).
- (7) I. Schwartz, H. Smith, J. Math. Biol. 18, 233 (1983).
- (8) J.M. Hyman, J. Li, E.A. Stanley, Math. Biosci., 155, 77 (1999).