On predictability of rare events leveraging social media:
a machine learning perspective
Abstract
Information extracted from social media streams has been leveraged to forecast the outcome of a large number of real-world events, from political elections to stock market fluctuations. An increasing amount of studies demonstrates how the analysis of social media conversations provides cheap access to the wisdom of the crowd. However, extents and contexts in which such forecasting power can be effectively leveraged are still unverified at least in a systematic way. It is also unclear how social-media-based predictions compare to those based on alternative information sources. To address these issues, here we develop a machine learning framework that leverages social media streams to automatically identify and predict the outcomes of soccer matches. We focus in particular on matches in which at least one of the possible outcomes is deemed as highly unlikely by professional bookmakers. We argue that sport events offer a systematic approach for testing the predictive power of social media conversations, and allow to compare such power against the rigorous baselines set by external sources. Despite such strict baselines, our framework yields above 8% marginal profit when used to inform simple betting strategies. The system is based on real-time sentiment analysis and exploits data collected immediately before the game start, allowing for bets informed by its predictions. We first discuss the rationale behind our approach, then describe the learning framework, its prediction performance and the return it provides as compared to a set of betting strategies. To test our framework we use both historical Twitter data from the 2014 FIFA World Cup games (10% sample), and real-time Twitter data (full stream) collected by monitoring the conversations about all soccer matches of the four major European tournaments (FA Premier League, Serie A, La Liga, and Bundesliga), and the 2014 UEFA Champions League, during the period between October, 25th 2014 and November, 26th 2014.
1 Introduction
A large number of case studies have proved that social media like Twitter can be effective sources of information to understand real-world phenomena and to anticipate the outcomes of events that are yet to happen, like political elections [9, 25] and talent shows [6], movies box-office performance [1, 19], and stock-market fluctuations [32, 4]. Even discounting the fact that successful case studies don’t tell much about failures, the effectiveness of social media as information source to predict real events may not be surprising: they offer a window on the collective wisdom of a potentially very large crowd of users that can be harvested at the expense of a relatively small technological investment. On the other hand, a number of potential issues may affect such effectiveness: beyond all sorts of biases in the population of users whose tweets are collected, in virtually all cases the opinion of users can not be directly polled to answer the questions at hand. In some cases, there is arguably a strong correlation between the signal collected and the event to be predicted. The Twitter traffic volume about a movie and the revenue it later generates in the opening week, or the valence of political discussions and the outcome of an election are example of such cases. In others, such correlation is, at least in principle, more tenuous (e.g., the overall mood of Twitter conversations and fluctuations in the stock market). In general, the potential of leveraging information from social media to predict the outcome of real-world events is unclear and certainly has not been systematically studied.
Here we propose that an ideal test bed for addressing this issue is to consider team sport events. They offer several advantages: the number of possible outcomes of sport matches is usually limited, they occur continuously, and there is a lot of potentially useful signal to collect: social media are used by millions of sport fans everyday to discuss about their favorite sports, the teams they cheer for and their performance, and the expectations for future games. Another non trivial advantage is that prediction based on social media wisdom can be systematically compared with that implicitly reflected in the odds fixed by bookmakers. Betting odds in fact represent the opinion of experienced professionals. Presumably they also take into account the wisdom of the betting crowd, as quotes are continuously re-adjusted to reflect the influx of incoming bets, which in turn can be regarded as proxies of the bettors opinion.
In this paper we discuss the design, implementation, and validation of a machine learning framework to predict the occurrence of very unlikely (in terms of their betting odds) outcomes in soccer games by leveraging the mood of Twitter conversations relative to such games. The choice of soccer was made because it offers a larger Twitter traffic with respect to other sports. Soccer is the most popular sport in the world111http://mostpopularsports.net/in-the-world/ with more than 3 billions fans worldwide accourding to recent estimates222http://www.topendsports.com/world/lists/popular-sport/fans.htm. The official blog of Twitter for example reports that there were 672 million tweets posted related to the 2014 FIFA World Cup tournament, making this the most spoken event online in the history of the platform333https://blog.twitter.com/2014/seven-worldcup-data-takeaways-so-far.
As mentioned above, here we focus on games that have the potential for an outcome deemed very unlikely by bookmakers. There are at least two reasons for this choice. On the one hand, these games are those potentially more profitable to bet upon, as one of their results has very high odds. More importantly, they are arguably those for which to “correctly” estimate the odds is problematic both for bookmakers and bettors, and therefore they offer a potential for successfully leveraging exogenous signals as that extracted from social media.
We consider games from six different competitions, including the 2014 FIFA World Cup tournament, and the relative Twitter conversations [14]. We extract separately the average mood in the conversations generated by supporters of both teams for a period of six hours before the beginning of the games, and use its discrete representation to train a machine learning classifier called to discriminate between games whose outcome is the expected result (low-odds), or the unlikely one (high-odds). Our results translate in a simple betting strategy that offers above 8% margin of profit. We interpret this finding as a consequence of both the presence of “wisdom of the crowd” signal in social media conversations, and the difficulty to properly estimate the odds of unlikely events.
Next we present the methodology employed in this study, the procedure used to select the specific games to which our machine learning framework is applied, we introduce the adopted features and then define our classification task. We also offer some intuition on how the selected features, based on the mood of Twitter conversations from the two teams fans, may provide useful information for prediction purpose. In Section 4 we describe in detail the implementation of our machine learning approach and its validation according to standard measures of performance. In Section 5 we assess the economic profit yielded by using our framework introducing a simple betting strategy based of the results of our predictions. We finally discuss further details on data collection and related work in sections 6 and 7 respectively. We conclude with a summary of our results and a discussion of their relevance.
2 Methodology
We considered games from six different tournaments: (i) the 2014 FIFA World Cup tournament, (ii) the major four European national tournaments during 2014 (FA Premier League, Serie A, La Liga, and Bundesliga), and (iii) the 2014 UEFA Champions League. While for the FIFA World Cup we collect historical data from our Twitter gardenhose repository at Indiana University (containing about 10% of the entire datastream), the conversation about the other events is collected using a real-time monitoring algorithm processing the full Twitter stream. In the following, we will consider two datasets: the FIFA, consisting of the games in the the 2014 FIFA World Cup tournament, and one with the games from all other tournaments. We will refer to this second dataset as “Live-monitoring”.
We are specifically interested in games that before their starting had a potential outcome deemed as very unlikely. For a generic game we considered the average odds (the latest available before the start of the match) assigned to that match by multiple bookmakers444The odds can be found at http://odds.sports.sina.com.cn/liveodds/ They are the average of decimal odds rather than Asian Handicap odds from all accessible betting companies. All odds are the last updated ones before the game.. We leverage four betting agencies: William Hill, Ladbrokes, Bet 365, and Bwin; these four bookmakers together cover most of the betting market. We define and as the maximum and minimum odds assigned to one of the possible outcomes of the game . We also define as the the odds of the outcome that finally materializes. Of course can coincide with one of and . To each game we assigned a potential upset score that measures the relative likelihood of the most likely outcome to the least one
| (1) |
Note that, in betting, larger odds identify less likely outcomes: from Eq. 1 it follows that the higher the upset score for a game, the more unlikely that outcome was according to the bookmakers. Eq. 1 has lower bound at 1 and no theoretical upper bound: the practical upper bound is determined by how disproportionate the game odds are; in our experience the upset score max out around 100. Correctly betting on games turning into unexpected outcomes could generate the largest marginal profits if correctly bet upon.
The subset of games relevant to our prediction task are those whose score exceeds a given arbitrary large threshold . We considered various values of threshold, and in this study we report the results for ; consistent findings hold for other values in the range . We finally define the upset score of a game as the relative likelihood of the outcome that finally materializes to the most likely
| (2) |
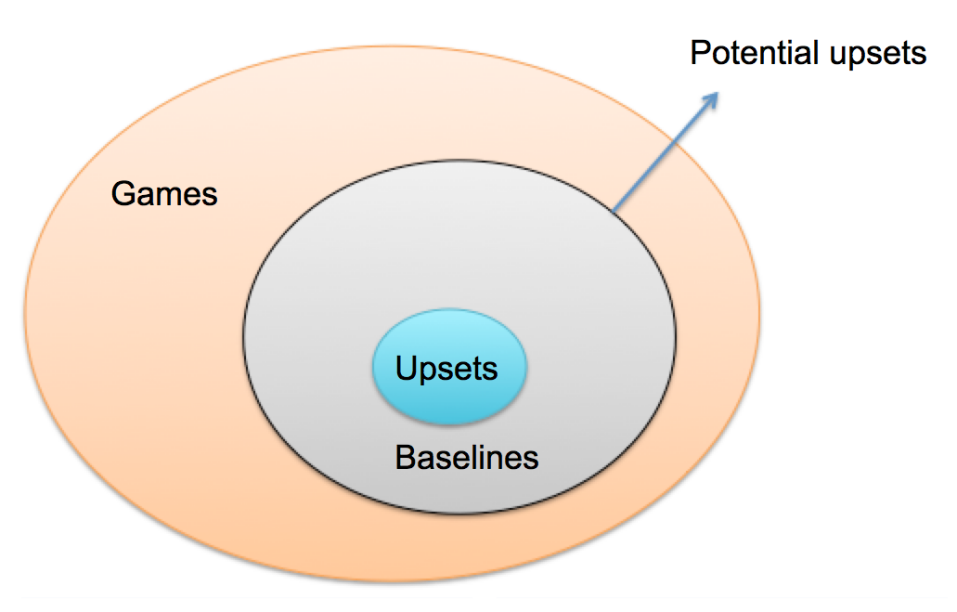
U(g) can be as small as 1 when the most likely result (minimum odds) materializes and as big as if the least likely result occurs. For illustrative purposes, in Table 1 we show the list of all FIFA World Cup games with an outcome different from the most likely (). This happened for 31 games out of 64 played during the 2014 tournament. In the following, we will refer to games with as potential upsets and to games with as upsets. Given the definition above, the latter constitute a subset of the former, as depicted in Fig. 1. We will refer to games that are potential upsets but not upsets as baseline games.
From Table 1, the reader knowledgeable of soccer will immediately see that some games with very unlikely scores (for example Brazil 1:7 Germany) are attached with low upset scores: this because our framework ignores goal differences and considers only for the overall outcome of a match. On the other hand, largely unexpected defeats like Uruguay 1:3 Costa Rica and Italy 0:1 Costa Rica, or ties like Germany 2:2 Ghana or Brazil 0:0 Mexico, yield large upset scores.
Note that a potential upset game can be an upset without necessarily resulting in . Consider the following example game between team and whose odds are (2,7,11) on the victory of team A, a draw, and the victory of team B, respectively. The game is a potential upset according to our threshold , because . Suppose that the final outcome is a draw. The game is an upset because , but . Interestingly, although this is a possibility, we never observed any such case in our datasets (see Tables 4 and 5).
Our classification tasks will consist in discriminating games that turn out to be upsets among all potential upsets using features extracted from Twitter conversations relative to such games. We discuss the details about the data collection Section 6. Before turning to a detailed description of our framework and of the features it employs, in the next section we provide some support to the idea that Twitter conversations may reflect important information about a game, which in turn can be leveraged to predict its outcome.
| Game | U(g) |
|---|---|
| Uruguay 1:3 Costa Rica | 18.04 |
| Germany 2:1(a.e.t.) Algeria | 15.03 |
| Germany 2:2 Ghana | 14.06 |
| Brazil 0:0 Mexico | 12.87 |
| Italy 0:1 Costa Rica | 9.69 |
| Spain 0:2 Chile | 7.96 |
| Brazil 3:2(a.e.t.) Chile | 6.46 |
| Netherlands 4:3(a.e.t.) Costa Rica | 6.22 |
| Argentina 1:0(a.e.t.) Switzerland | 5.72 |
| Ecuador 0:0 France | 5.09 |
| Spain 1:5 Netherlands | 4.86 |
| USA 2:2 Portugal | 4.08 |
| Costa Rica 0:0 England | 3.79 |
| Nigeria 1:0 Bosnia Herzegovina | 3.79 |
| Russia 1:1 Korea Republic | 3.17 |
| Greece 2:1 Côte d’Ivoire | 3.04 |
| Iran 0:0 Nigeria | 2.93 |
| Uruguay 2:1 England | 2.86 |
| Algeria 1:1 Russia | 2.61 |
| Belgium 2:1(a.e.t) USA | 2.39 |
| Brazil 0:3 Netherlands | 1.75 |
| Japan 0:0 Greece | 1.71 |
| Germany 1:0(a.e.t.) Argentina | 1.70 |
| Netherlands 2:4(a.e.t.) Argentina | 1.46 |
| England 1:2 Italy | 1.46 |
| Ghana 1:2 USA | 1.40 |
| Korea Republic 2:4 Algeria | 1.31 |
| Costa Rica 5:3(a.e.t.) Greece | 1.26 |
| Italy 0:1 Uruguay | 1.15 |
| Brazil 1:7 Germany | 1.14 |
| Netherlands 2:0 Chile | 1.01 |
3 Interpreting the game signals
Excluding extra time and penalties, a soccer game usually lasts less than 120 minutes with two 45-minute halves, a 15-minute halftime break, and several minutes of injury time. In this section, we seek to understand how well Twitter reflects the events occurring during a soccer game. For this in-depth analysis, we focus on the 2014 FIFA World Cup matches, and for simplicity we analyze the Twitter conversation occurring during the 120 minutes representing the effective duration of each game, at the minutes resolution.
3.1 Events and Response
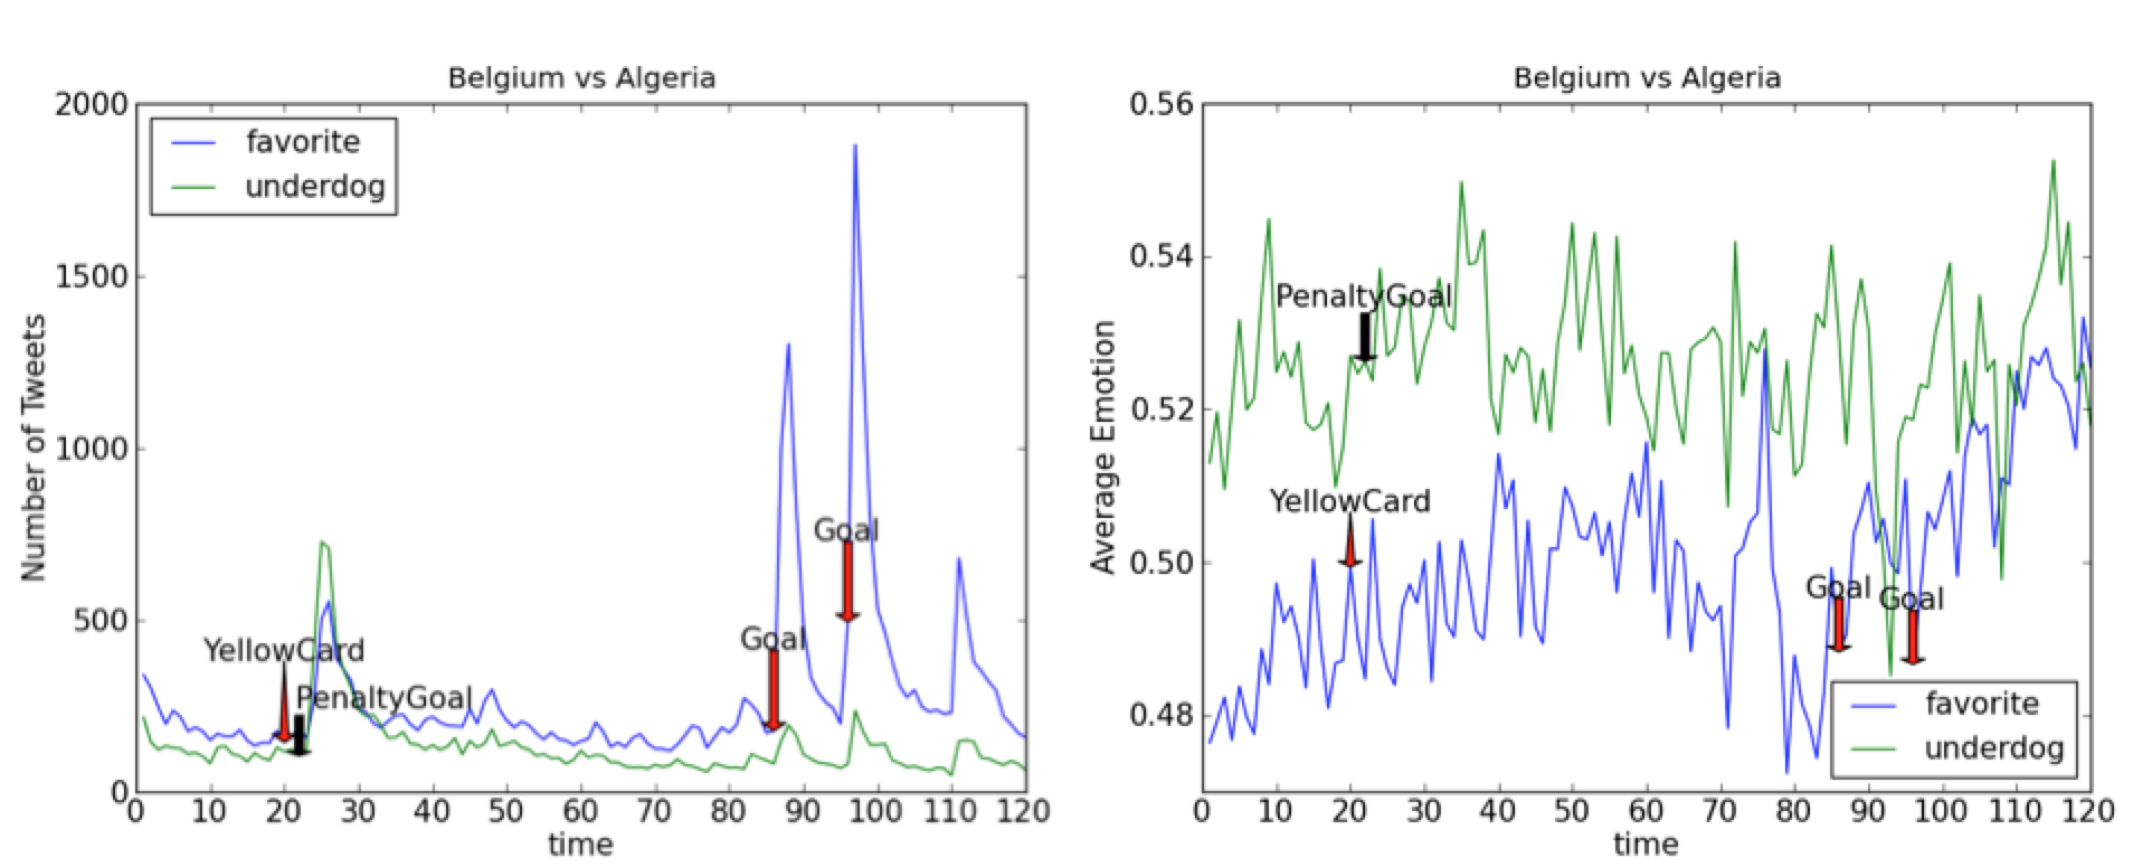
We start trying understanding how users respond to important events during a soccer game. We only considered the events defined in the official match report provided by FIFA: “Goal scored,” “Penalty scored,” “Yellow Card,” and “Red Card”. By manually analyzing five upsets and five baseline games, we noticed that in both cases, the number of tweets spikes for a few minutes after these events occur. “Penalty scored” is somehow an exception because the number of tweets spikes before this type of events happens, as expected since “Penalty scored” occurs shortly after another unrecorded event, namely “Penalty decision”. Fig. 2 shows one example of such collective reactions, for the game “Belgium vs Algeria”. Clear spikes of traffic are annotated with in-game events, which also trigger big fluctuations in the collective sentiment scores (the technical details about sentiment analysis are in Section 6.3): the underdog fans’ average sentiment is consistently much lower than the favorites’ one, and drops drastically twice as an immediate consequence of the favorite team scoring. This type of analysis shows how well the Twitter conversation captures in real time the collective mood of the supporters, in support of our high-level idea that social media signals can be used to sense live events, and possibly even predict rare ones.
3.2 Interaction of Groups
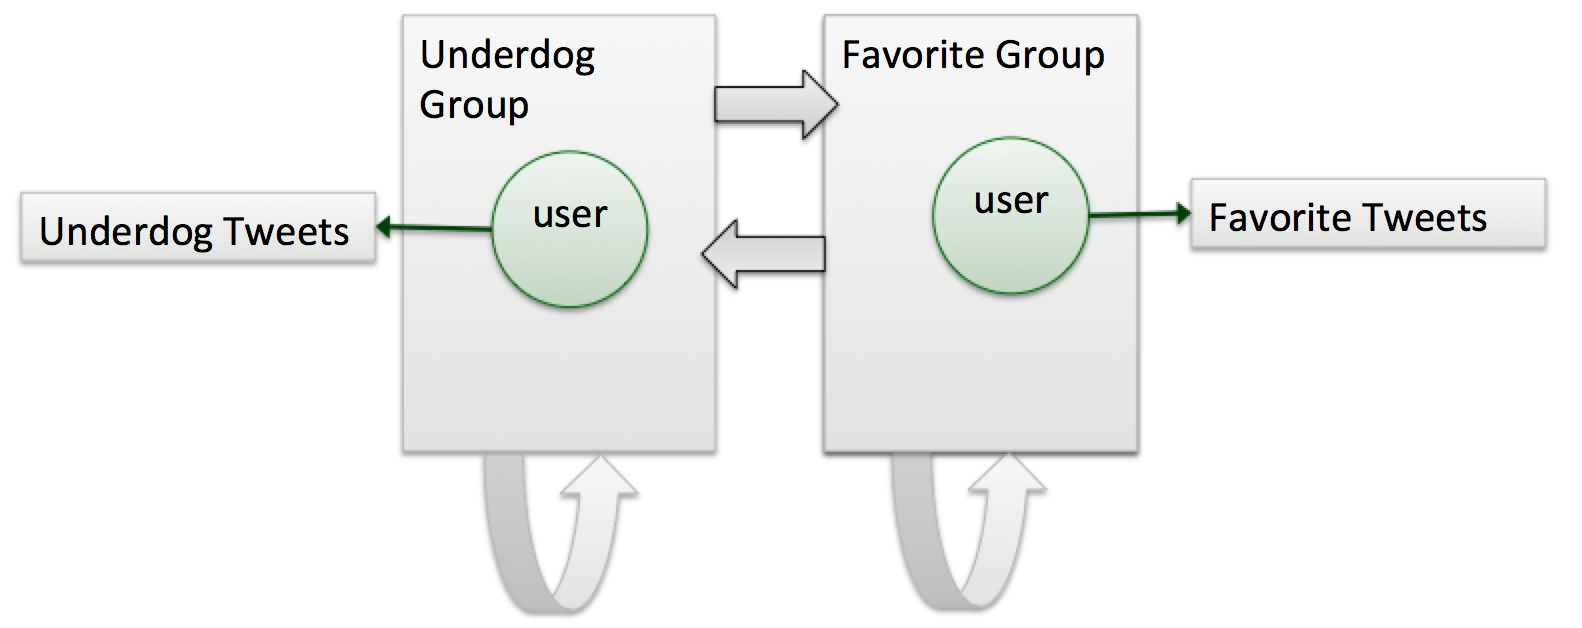
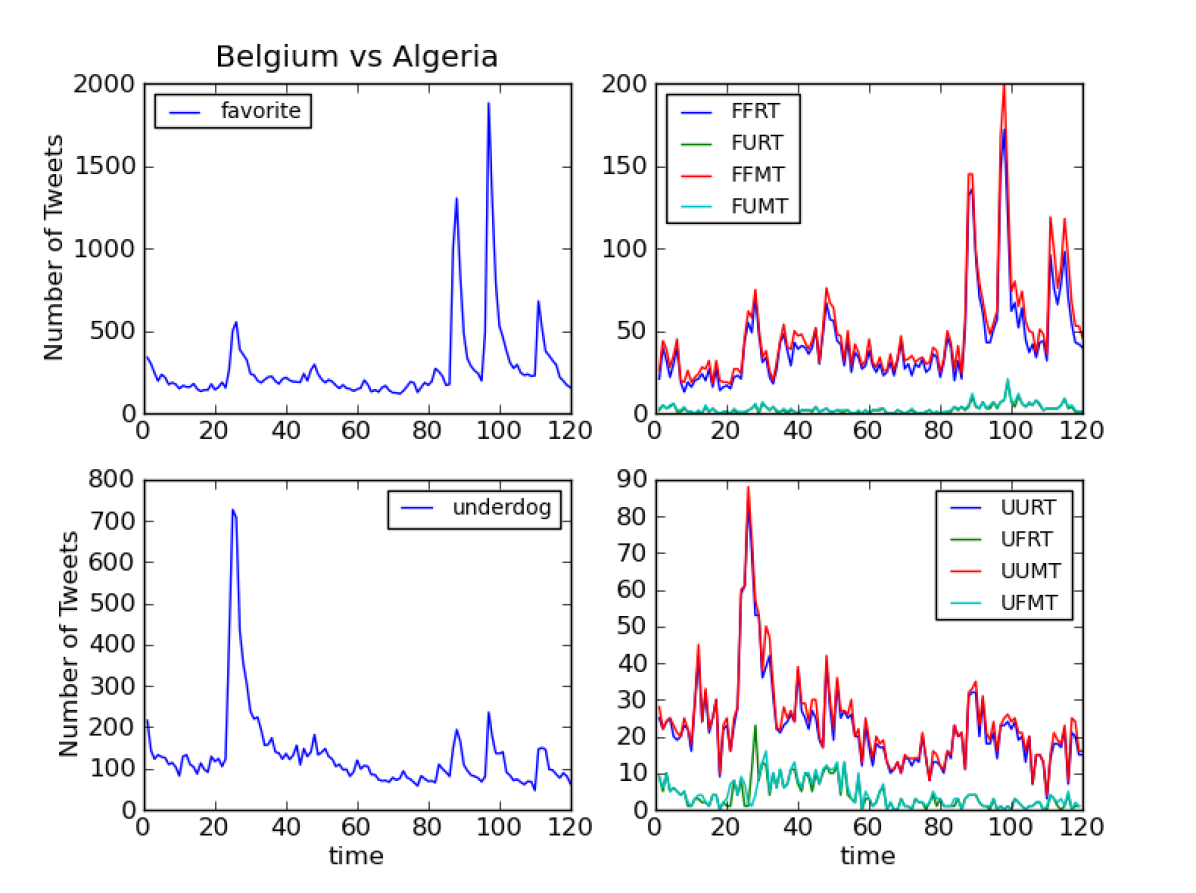
We divided the users tweeting during a game into two groups. One group contains the fans of the favorite team (users who only tweet using the name/abbreviation of the favorites) while the other contains only supporters of the underdog team (see Section 6 for the details about the data collection). We assume that these two groups represent the two factions of supporters. We want to study the interaction dynamics within and between these two groups. The interaction can be in the form of retweets or mentions to users within the same group or from the other group. Fig. 3 schematizes this dynamics. Our analysis shows that the volume of interactions within groups greatly outnumbers that between groups: Fig. 4 illustrates this for the example game “Belgium vs Algeria”.
4 The prediction framework
Our framework relies on the intuition that fans’ discussion preceding a soccer game might convey useful information to predict the outcome of the game. Here in particular we seek to exploit the temporal evolution of the sentiment extracted from the Twitter conversations of the opposite set of fans to predict the outcome of potential upset games. We argue that sentiment analysis may help uncovering the hopes and therefore the collective opinion about the outcome of the game. The basic assumption is supported by recent social and behavioral psychology studies on social attention [16, 26, 27]: in a situation of perceived advantage, the fans of the favorite team will collectively express more positive emotions and feelings than the fans of the opposing team. Our working assumption is, therefore, that games where such gap in positive emotions is not observed before the game starts will consistently turn into upsets. In the following we describe our effort to test such assumption.
4.1 Testing the significance of sentiment gap
We computed the sentiment score for each tweet produced either by the favorite or the underdog supporter in a 6 hours time period preceding the beginning of the game: tweets sentiment scores range in the interval (see Section 6 for details). For each game, we retrieved the Twitter conversation occurred during the 6 hours before the start, and we broke this period into 12 windows (each representing 30 minutes) and computed the distribution of sentiment score in each window for tweets from the favorite and the underdog supporters, separately.555We explored alternatives, including sliding windows with partial overlap and different window lengths. The configuration reported here yields the best performance. We also exclude match-related tweets (those mentioning both teams) to avoid deciding how to attribute that sentiment the teams.
We finally represented each game with a single vector , where each component is the p-value of the Mann-Whitney U-test between the distribution of sentiment expressed toward the favorite and the underdog team during the time window.
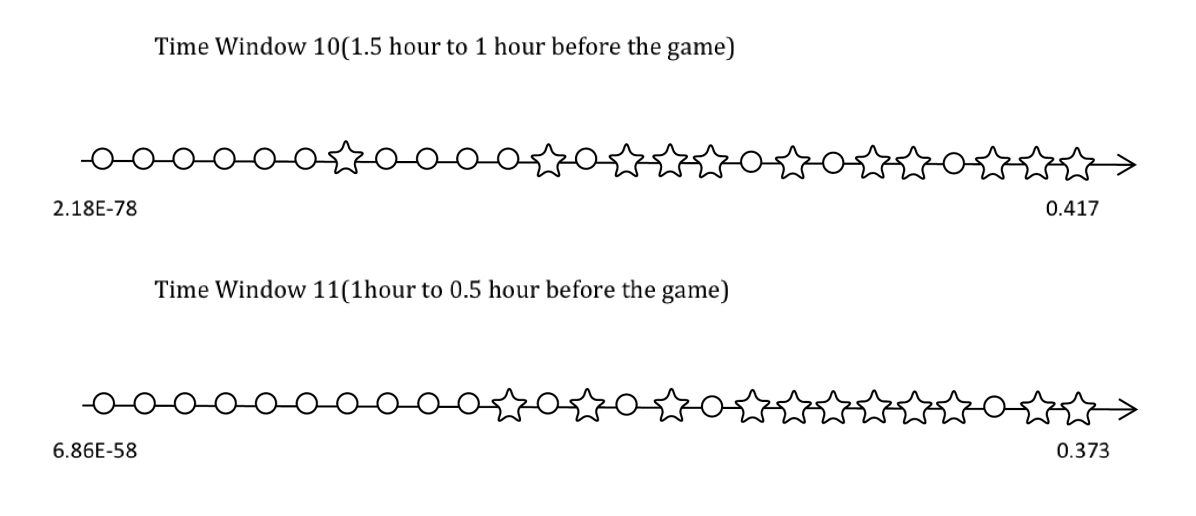
Tables 2 and 3 show the results under the significance level of p<0.0001 for the two datasets (FIFA and Live-monitoring respectively). When one considers early time windows our hypothesis fails, as most of the games don’t pass the U-tests, regardless of their final result. However, when one considers later time windows (e.g., time windows 10 and 11, which is 90 minutes to 30 minutes before the games start), the majority of baseline games pass the U-test, while only a small fraction of upsets do (see Fig. 5). This suggests that a significant difference in sentiment distribution between the two factions of fans is discriminative in identifying games that turn into upsets.
Most of the usable sentiment signal is conveyed between 90 minutes and 30 minutes before the games start. For readers knowledgeable of soccer, such information won’t be surprising: line-ups are usually announced about 90 minutes before the games. Releasing news on line-ups and other factors of the game, such as last-minute injuries, the weather, etc., may influence the opinions of the fans about the outcome of the game.
| Window | Upset (pass/total) | Baseline (pass/total) |
|---|---|---|
| 1 | 3/10 | 5/15 |
| 2 | 3/10 | 3/15 |
| 3 | 2/10 | 2/15 |
| 4 | 3/10 | 3/15 |
| 5 | 3/10 | 3/15 |
| 6 | 2/10 | 4/15 |
| 7 | 3/10 | 3/15 |
| 8 | 2/10 | 3/15 |
| 9 | 3/10 | 3/15 |
| 10 | 3/10 | 10/15 |
| 11 | 3/10 | 11/15 |
| 12 | 7/10 | 8/15 |
| Window | Upset (pass/total) | Baseline (pass/total) |
|---|---|---|
| 1 | 1/9 | 0/22 |
| 2 | 5/9 | 3/22 |
| 3 | 0/9 | 2/22 |
| 4 | 2/9 | 7/22 |
| 5 | 0/9 | 0/22 |
| 6 | 3/9 | 11/22 |
| 7 | 0/9 | 2/22 |
| 8 | 4/9 | 10/22 |
| 9 | 1/9 | 2/22 |
| 10 | 2/9 | 14/22 |
| 11 | 2/9 | 11/22 |
| 12 | 3/9 | 12/22 |
| Game | U(g) | PUS(g) | Class |
|---|---|---|---|
| Uruguay 1:3 Costa Rica | 18.05 | 18.05 | upset |
| Germany 2:1(a.e.t) Algeria | 15.03 | 30.2 | upset |
| Germany 2:2 Ghana | 14.06 | 24.47 | upset |
| Brazil 0:0 Mexico | 12.88 | 12.88 | upset |
| Italy 0:1 Costa Rica | 9.69 | 9.69 | upset |
| Spain 0:2 Chile | 7.96 | 7.96 | upset |
| Brazil 3:2(a.e.t) Chile | 6.46 | 9.98 | upset |
| Netherlands 4:3(a.e.t) Costa Rica | 6.22 | 12.04 | upset |
| Argentina 1:0(a.e.t) Switzerland | 5.72 | 9.98 | upset |
| Ecuador 0:0 France | 5.1 | 7.25 | upset |
| Cameroon 1:4 Brazil | 1.0 | 166.25 | baseline |
| Argentina 1:0 Iran | 1.0 | 145.69 | baseline |
| Australia 2:3 Netherlands | 1.0 | 53.59 | baseline |
| France 3:0 Honduras | 1.0 | 41.81 | baseline |
| Brazil 3:1 Croatia | 1.0 | 35.5 | baseline |
| Argentina 2:1 Bosnia H. | 1.0 | 29.43 | baseline |
| Belgium 2:1 Algeria | 1.0 | 25.97 | baseline |
| Nigeria 2:3 Argentina | 1.0 | 19.43 | baseline |
| Chile 2:1 Australia | 1.0 | 18.41 | baseline |
| France 2:0 Nigeria | 1.0 | 17.71 | baseline |
| Australia 0:3 Spain | 1.0 | 17.39 | baseline |
| Honduras 0:3 Switzerland | 1.0 | 12.7 | baseline |
| USA 0:1 Germany | 1.0 | 10.52 | baseline |
| Honduras 1:2 Ecuador | 1.0 | 7.85 | baseline |
| Cameroon 0:4 Croatia | 1.0 | 6.89 | baseline |
| Game | U(g) | PUS | Class |
|---|---|---|---|
| Dortmund 0:1 Hannover 96 | 91.66 | 91.66 | upset |
| Liverpool 0:0 Hull City | 14.44 | 24.07 | upset |
| West Ham 2:1 Manchester City | 14.85 | 14.85 | upset |
| Tottenham 1:2 Newcastle Utd | 9.65 | 9.65 | upset |
| Milan 0:2 Parlemo | 15.27 | 15.27 | upset |
| Arsenal 3:3 Anderlecht | 20.47 | 39.05 | upset |
| Manchester City 1:2 CSKA | 44.73 | 44.73 | upset |
| QP Rangers 2:2 Manchester City | 9.44 | 14.44 | upset |
| Real Sociedad 2:1 Atletico Madrid | 6.63 | 6.63 | upset |
| Southampton 1:0 Stoke City | 1.0 | 12.68 | baseline |
| Sunderland 0:2 Arsenal | 1.0 | 6.60 | baseline |
| Cesena 0:1 Inter | 1.0 | 11.70 | baseline |
| Juventus 2:0 Palermo | 1.0 | 100.00 | baseline |
| Napoli 6:2 H. Verona | 1.0 | 25.18 | baseline |
| Arsenal 3:0 Burnley | 1.0 | 78.57 | baseline |
| Bayern Munich 2:1 Dortmund | 1.0 | 10.97 | baseline |
| Empoli 0:2 Juventus | 1.0 | 27.85 | baseline |
| Granada 0:4 Real Madrid | 1.0 | 84.61 | baseline |
| Dortmund 4:1 Galatasaray | 1.0 | 65.00 | baseline |
| Juventus 3:2 Olympiacos | 1.0 | 42.85 | baseline |
| Malmo 0:2 Atletico Madrid | 1.0 | 35.87 | baseline |
| Real Madrid 1:0 Liverpool | 1.0 | 66.07 | baseline |
| Ajax 0:2 Barcelona | 1.0 | 26.80 | baseline |
| Bayern Munich 2:0 Roma | 1.0 | 67.85 | baseline |
| PSG 1:0 Apoel | 1.0 | 75.00 | baseline |
| Manchester Utd 1:0 Crystal Palace | 1.0 | 42.50 | baseline |
| Roma 3:0 Torino | 1.0 | 18.82 | baseline |
| Dortmund 1:0 Borussia M. | 1.0 | 7.55 | baseline |
| Wolfsburg 2:0 Hamburg | 1.0 | 9.33 | baseline |
| Juventus 7:0 Parma | 1.0 | 92.30 | baseline |
| PSG 2:0 Olympique Marseille | 1.0 | 8.87 | baseline |
4.2 Prediction
As anticipated above, the primary goal of this paper is to describe a machine learning framework that, among all potential upset games, discriminate those that actually turn into an upset. In the datasets considered here, based on the odds we collected, any result other than the victory of the favorite team will make the game an upset; therefore, our classification task can be rephrased as discriminating between the victory of the favorite and either a draw or the victory of the underdog.
We considered different classification approaches, all based on the feature vector defined above.
We explored the performance of most classifiers available in the Python library scikit-learn [21]: the best performance is provided by Gaussian Naive Bayes. Note that our goal here was not that of finding the best classifier or the best parameter tuning, but to illustrate the feasibility of our method: more advanced machine learning techniques, such as deep learning, might yield even better performance. We use the two datasets (FIFA and Live-monitoring) to train our classifier and then perform a stratified three-fold cross validation to evaluate its performance, which are shown in Tables 6 and 7. Data about the World Cup were collected from the Twitter gardenhose (10% sample), while those in the “Live-monitoring” set from the Twitter Streaming API (full stream). We decided to keep these two sets separate as they exhibit sensibly different volumes of tweets, due to the magnitude of the events and the sampling rate of the Twitter streams.
Let us discuss these two cases separately. Table 6 illustrates the prediction performance with the 25 potential upsets that constitute our FIFA World dataset. Our classifier in this scenario achieves an accuracy near to 79% and a score in terms of AUROC near to 73%. The results based on the Twitter gardenhose are promising, but we expect to be able to do even better with live-monitoring the games using the full Twitter stream. Table 7 shows the performance for the 31 potential upsets identified during the period between October, 25th 2014 and November, 26th 2014 in the four major European national tournaments plus the UEFA Champions League.
In the case of live-monitoring games, we can improve our prediction performance scoring an accuracy of 83.63% and an AUROC of 78.87%. These results clearly suggest that our framework can be potentially used for early prediction of the games. As a proof of consistency, given the relatively small set of potential upset games, we constructed two randomized versions of the datasets in which we randomly reshuffle the class labels of each game (upset or baseline game) across all games. This process yields a yardstick in which sentiment is disentangled from the actual game results. As Table 8 shows, both Accuracy and AUROC in such random model classification exhibit scores near 50%, confirming the presence of predictive signal in our game representation.
Based on all results and observations above, we concluded we can make highly profitable predictions on potential upset games based solely upon the difference of sentiment expressed by the fans of the two teams prior to the match. Specifically, in the range between 90 to 30 minutes before the games start, the difference of sentiment scores between favorites and underdogs is usually significant for baseline games and not significant for upsets. We leverage this prediction framework next, to determine what margin of profit we can achieve betting on potential upsets, as compared to other betting strategies not informed by social media data.
| Accuracy | Precision | Recall | F1-Score | AUROC |
|---|---|---|---|---|
| 0.7898 | 0.8512 | 0.5431 | 0.6631 | 0.7286 |
| Accuracy | Precision | Recall | F1-Score | AUROC |
|---|---|---|---|---|
| 0.8363 | 0.5833 | 0.6667 | 0.6190 | 0.7887 |
| Accuracy | Precision | Recall | F1-Score | AUROC |
|---|---|---|---|---|
| 0.5576 | 0.45 | 0.3 | 0.3428 | 0.5116 |
5 Economic Profit on Predictions
The ultimate test of the effectiveness of the predictive power of our approach consists in determining whether it can return a profit if used systematically against the odds offered by the bookmakers. Such odds are notoriously hard to beat because: (i) they are initially set by professional soccer experts, (ii) they are continuously adjusted to take into account the incoming flow of bets (and therefore they take indirectly into account the wisdom of the bettor crowd), and (iii) they incorporate a systematic profit margin for the bookmakers. In other words, given the underlying probability of an event to occur, the profit for a successful bettor is less than that would be entitled to in a fair bet.
Here, we first estimate the average return of a betting strategy based on our predictions, and then compare it with that achievable with different baseline betting strategies.
Our two datasets combined contain a total of games (25 potential upsets from the 2014 FIFA World Cup and 31 potential upsets from the live-monitoring European tournaments). We perform 100 rounds of betting. For each round we perform a stratified three-fold cross validation and bet 1 dollar in each of the games in the test set according to the following simple strategy: if our system predicts that the game will not turn into an upset, we bet the dollar on the favorite team; otherwise, we bet half dollar on the victory of the underdog, and half dollar on the draw. In our datasets, both the latter two results —if realized— make the corresponding game an upset and therefore offer a return at least times larger than the victory of the favorite. We then compute the marginal profit for the given betting round as
| (3) |
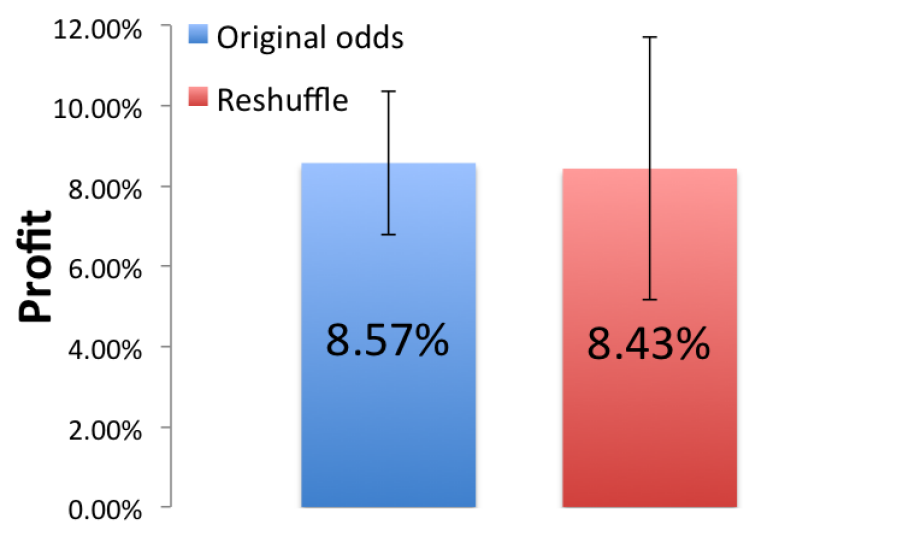
where and are the total payoff and money bet, respectively. Clearly, if , Eq. 3 is negative, which means to incur in a loss rather than a profit (). Finally, we compute the average and standard deviation of the marginal profit across all the betting round. The result is represented in the blue bar in Fig. 6. The average marginal profit of is surprisingly high. One possible explanation we wish to exclude is that we consistently classify correctly a single (or few games) with very high return, which would possibly offset and hide a large number of less profitable mis-classifications. We therefore performed an experiment analogous to the one described above, but where the three odds relative to game are randomly reshuffled across the games. The average marginal profit is and, again, surprisingly high (see red bars in Fig. 6). This demonstrates that our results are not an artifact of a possibly peculiar odds distribution.
We adopted a stratified three-fold cross validation procedure on the 56 potential upset games and evaluated the results of our predictor on the testing set every time. This simple strategy that bets equally on all games, regardless on their potential upset score, provides a systematic advantage and marginal profit. We tested more advanced strategies (for example betting different amounts based proportional to the odds) finding consistent results although increasing the risks and therefore the fluctuations in marginal profit.
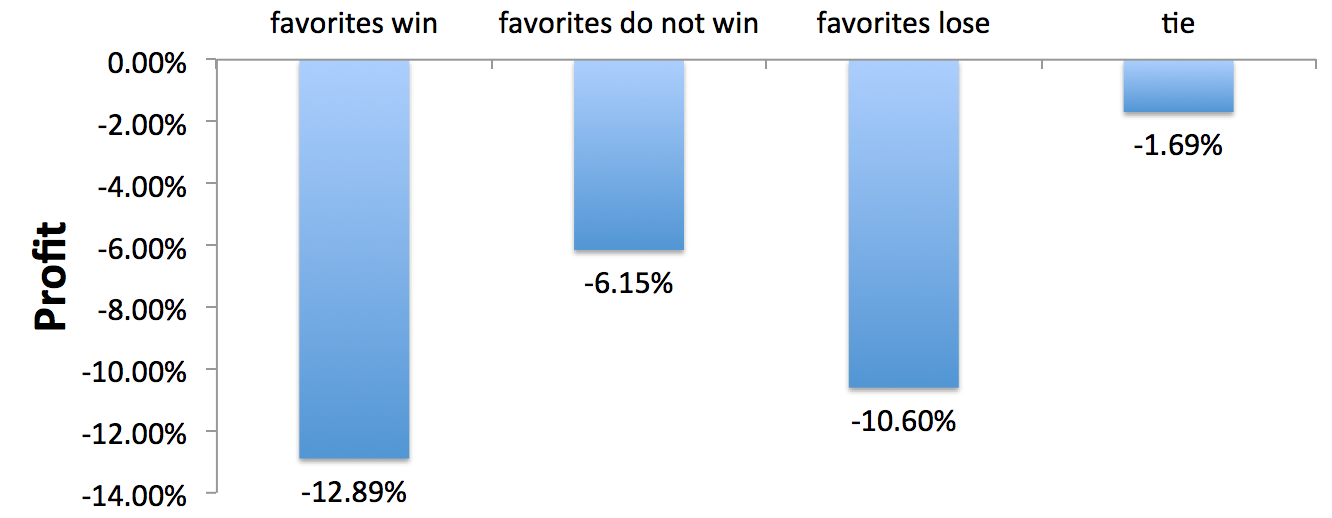
The final comparison is against systematic betting on the following results, independently from the game: (i) the favorite team always wins, (ii) the favorite team does not win (half dollar bet on a tie, half dollar bet on the underdog winning), (iii) the favorite team loses (one dollar on the underdog winning), and (iv) the match is a tie. For each strategy we first compute the marginal profit on each game and then compute the average marginal profit (and the relative standard deviation) across all games. The results are shown in Fig. 7: these strategies, once again all yield possibly large losses. Interestingly enough, the safest fixed strategy (that still imposes a loss) is to bet on ties.
All benchmarks demonstrate that betting according to the predictions produced by our machine learning framework yields a consistent, positive and potentially large marginal profit, unparalleled by other systematic betting strategies, even informed by the odds.
6 Data Collection
We employed two different strategies for the collection of Twitter data relative to the 2014 FIFA World Cup and the other tournaments.
6.1 Twitter data for the 2014 FIFA World Cup
World Cup games attracted much more global attention than any other soccer games before and after (indeed, of any other event ever, as previously noted) providing a very large data base. We systematically collect and store all data from the Twitter gardenhose, a 10% sample of the entire Twitter stream. Focusing our search on the period during which the World Cup occurred (June, 12th 2014 though July, 13th 2014), we isolated all tweets containing any of these keywords: (i) the official abbreviation of the game, as recommended by FIFA666http://www.fifa.com/worldcup/teams/index.html; (ii) one or both of the team names; (iii) one or both the official team abbreviations; or, (iv) the hashtag combining the team names or abbreviation with “vs” (e.g., “BRAvsGER” to identify the game between Brazil and Germany). This procedure yielded a corpus of tweets for each of the 64 games occurred during the competition.
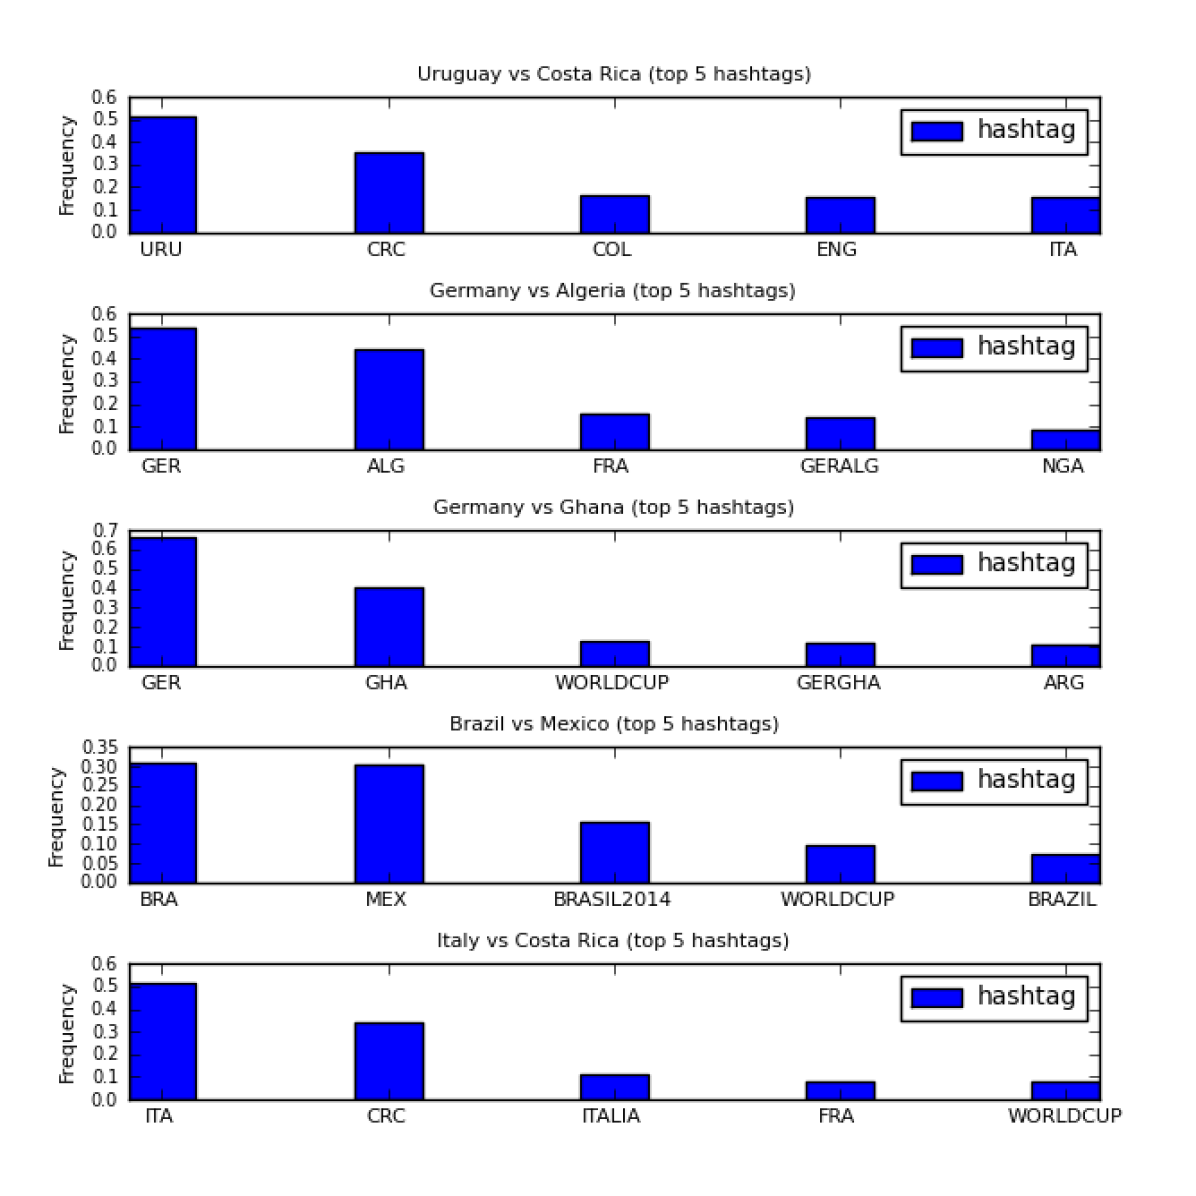
We isolated the tweets produced during the 6 hours before the beginning of each game and analyzed the frequency of adoption of the related keywords. The results for five representative matches are shown in Fig. 8. We noted that the abbreviations dominated the frequency of keywords adoption in all games. With a maximum limit of 140 characters per tweets, abbreviations are commonly used to save both space and typing time. Besides the team abbreviations, most of the other somehow frequent hashtags are either irrelevant (e.g., #eng in the game of Uruguay vs. Costa Rica) or too general or broad (e.g., #worldcup) to apply to the specific game itself. Therefore, we decided to use only hashtags of team abbreviations. Each game is therefore characterized by three subcategories of tweets: those related to each of the two teams involved in the match, and those related to the match itself (namely, those in which both team names appear). We finally performed a manual validation of the dataset: for all games, we randomly sampled 50 tweets in each of the three subsets and manually verified whether the tweets were correctly identified. In Table 9 we show the results of the validation procedure for five upset games. Essentially all tweets collected with our procedure are closely related to the games. The precision is consistently above 90% for every game in all the three subcategories. The final dataset of games for the 2014 FIFA World Cup contains 658,468 tweets, of which 319,312 are retweets and 28,707 are replies produced by 478,529 unique users.
| Game | Favorite | Underdog | Match |
|---|---|---|---|
| Uruguay vs Costa Rica | 94% (Y) | 92% (Y) | 100% (Y) |
| 6% (?) | 8% (?) | 0% (?) | |
| 0% (N) | 0% (N) | 0% (N) | |
| Germany vs Algeria | 94% (Y) | 96% (Y) | 100% (Y) |
| 6% (?) | 4% (?) | 0% (?) | |
| 0% (N) | 0% (N) | 0% (N) | |
| Germany vs Ghana | 96% (Y) | 96% (Y) | 100% (Y) |
| 4% (?) | 4% (?) | 0% (?) | |
| 0% (N) | 0% (N) | 0% (N) | |
| Brazil vs Mexico | 92% (Y) | 94% (Y) | 100% (Y) |
| 8% (?) | 6% (?) | 0% (?) | |
| 0% (N) | 0% (N) | 0% (N) | |
| Italy vs Costa Rica | 92% (Y) | 92% (Y) | 100% (Y) |
| 8% (?) | 8% (?) | 0% (?) | |
| 0% (N) | 0% (N) | 0% (N) |
6.2 Live-monitoring soccer games data
During the period between October, 25th 2014 and November, 26th 2014 we monitored the odds of all games for four European national tournaments (the English FA Premier League, the Italian Serie A, the Spanish La Liga, and the German Bundesliga), and the UEFA Champions League. Our system selected 55 potential upsets with a profitability of at least 5:1 () and we collected in real time tweets about these games using the Twitter Streaming API. As for the 2014 FIFA World Cup games, we selected tweets based on hashtags containing teams’ abbreviations. The adoption of the Streaming API ensured that we collected the entirety of relevant tweets, rather than a sample. Some games, however, do not have enough tweets to guarantee a meaningful analysis (for example because the involved teams are not very popular). We therefore filtered out those games that did not collect at least 40 tweets per team per hour. This post-processing yielded a dataset 31 games, of which 9 turned into upsets and 22 into baselines. The final dataset of league matches contains 1,278,485 tweets, including 521,776 retweets and 31,281 replies, produced by 1,009,034 unique users.
6.3 Sentiment Analysis
The ability to capture and computationally represent supporters emotions and feelings, and how these evolve over time, is a crucial component of our system. In particular, the framework is designed to capture favorability from content using sentiment analysis algorithms based on natural language processing [18] and opinion mining [20]. Previous studies have shown that sentiment analysis is able to capture the overall mood of a population and inform predictions about elections and financial markets movements [3, 29, 4].
After benchmarking the performance of the majority of sentiment analysis libraries available, we determined that the most suitable for our system is the Indico deep learning sentiment analysis framework, and we adopted the relative Python API777https://pypi.python.org/pypi/IndicoIo/0.4.7. The algorithm returns a sentiment score between 0 and 1 for each tweet. We evaluated its performance using the Stanford Twitter sentiment corpus (STS-test)888http://help.sentiment140.com/for-students, a manually annotated dataset containing 177 negative, 182 positive and 139 neutral tweets [22]. The STS-test is relatively small but it has been widely used to benchmark several sentiment analysis algorithms [22, 23, 24, 13, 28, 2]. As a comparison example we report the performance of Text-Processing999http://text-processing.com/docs/sentiment.html, a sentiment tool trained on both Twitter data and movie reviews101010http://www.cs.cornell.edu/people/pabo/movie-review-data/ adopting a Naive Bayes classifier. The results of the benchmarks are shown in Table 10. Indico outperforms Text-Processing (and all other algorithms we tested) achieving above 80.5% accuracy, the highest ever reported on the STS-test [22], when we label as neutral all tweets with sentiment score comprised between 0.3 and 0.7. Hereafter, we use this configuration.
| Algorithm | Accuracy | Configuration |
|---|---|---|
| Text-Processing | 0.6045 | no neutral tweets |
| Indico | 0.7465 | no neutral tweets |
| Indico | 0.7088 | neutral: between 0.4 and 0.6 |
| Indico | 0.8052 | neutral: between 0.3 and 0.7 |
7 Related Work
This work, to the best of our knowledge, is the first to exploit social media streams to predict soccer matches. However, various recent studies have approached related problems [30], such as predicting the outcome of political elections [9, 25], talent shows [6], movies success [1, 19], stock-market fluctuations [32, 4], political protests [5, 7, 8, 31], and diffusion of information [17, 10].
To prove the idea that social media data convey predictive power, Asur and Huberman [1] designed a system that uses Twitter to forecast the box-office revenues of upcoming movies: simple signals such as the buzz around a given movie seem indicative of its future popularity. DiGrazia et al. [9] used a similar framework to show that there exists a statistically significant association between tweets that mention a political candidate for the U.S. House of Representatives and his or her subsequent electoral performance. Bermingham and Smeaton [3] illustrated a similar case study for the recent Irish General Election, modeling political sentiment by mining social media conversations. They combined sentiment analysis using supervised learning and volume-based measures and found that this signals are highly predictive of election results. Bollen et al. [4] analyzed the textual content of the daily Twitter stream to show that Twitter mood is predictive of the daily fluctuations in the closing values of the Dow Jones Industrial Average (DJIA). Xue Zhang et al. [32] collected Twitter data for six months and found that the percentage of emotional tweets significantly negatively correlates with Dow Jones, NASDAQ and S&P 500 fluctuations, but displays a significant positive correlation to VIX.
Various works called for caution when using social media to predict exogenous events [11, 12]: in such cases, it is important to keep in mind that the usage of machine learning algorithms or statistical models that function as black boxes can yield to results which are not interpretable and misleading [15]. For these reasons, when we designed our machine learning framework we based it on simple assumptions: the prediction dynamics are entirely explainable and observable in real time. In fact, our model relies only on one single feature (the average conversation sentiment measured over time) and it allows to interpret the predictions in a concise and clear way. Our hypotheses are also rooted on recent advances in social psychology that support the idea that collective attention enhances group emotions [16, 26, 27].
8 Conclusions
In this paper we presented a machine learning framework that leverages social media signal to effectively predict the outcome of very unbalanced games.
We analyzed Twitter conversations relative to potential upset games to provide evidence that signal extracted from the conversation reflects the sentiment of the large crowd of fan following the game. We showed that our systems achieves a very promising prediction performance, with accuracy and AUROC around 80%. We also demonstrated that the predictions yielded by our system can be effectively used to inform betting strategies achieving a positive and not negligible profit above 8%, and compared it with a number of baseline strategies that invariably leads to losses. We deem this as a strict and rigorous test of the effectiveness of our method.
Beating the odds offered by bookmakers is notoriously difficult, and is certainly not by chance that the betting industry is large and very profitable. Professional bookmakers matured great expertise in setting the initial odds, can readjust quotes continuously according to the incoming bets, and grant themselves a generous profit margin. We believe that the reason for our success relies, in part, in focusing on very unbalanced games, where at least one of the potential results is deemed as highly unlikely. The high unlikelihood of one the result may lead to an increased difficulty in correctly estimating the relative odd. Also the exploitability of very unbalanced games could be the consequence of a general aversion in the betting crowd towards betting on unlikely results: this would lead to enhanced odds for the unlikely result to attract bets that can offset the losses incurred by the bookmaker if the most likely (and most bet upon) result materializes. We may imagine that profit margin would decrease if we apply our method to a set of more balanced games, and plan to test our hypothesis extensively in future work.
Acknowledgments
AF acknowledges support by NSF Award No. IIS-0811994.
References
- [1] S. Asur and B. A. Huberman. Predicting the future with social media. In Web Intelligence and Intelligent Agent Technology (WI-IAT), 2010 IEEE/WIC/ACM International Conference on, volume 1, pages 492–499. IEEE, 2010.
- [2] A. Bakliwal, P. Arora, S. Madhappan, N. Kapre, M. Singh, and V. Varma. Mining sentiments from tweets. Proceedings of the WASSA, 12, 2012.
- [3] A. Bermingham and A. F. Smeaton. On using Twitter to monitor political sentiment and predict election results. 2011.
- [4] J. Bollen, H. Mao, and X. Zeng. Twitter mood predicts the stock market. Journal of Computational Science, 2(1):1–8, 2011.
- [5] A. Choudhary, W. Hendrix, K. Lee, D. Palsetia, and W.-K. Liao. Social media evolution of the egyptian revolution. Communications of the ACM, 55(5):74–80, 2012.
- [6] F. Ciulla, D. Mocanu, A. Baronchelli, B. Gonçalves, N. Perra, and A. Vespignani. Beating the news using social media: the case study of american idol. EPJ Data Science, 1(1):1–11, 2012.
- [7] M. D. Conover, C. Davis, E. Ferrara, K. McKelvey, F. Menczer, and A. Flammini. The geospatial characteristics of a social movement communication network. PloS one, 8(3):e55957, 2013.
- [8] M. D. Conover, E. Ferrara, F. Menczer, and A. Flammini. The digital evolution of occupy wall street. PloS one, 8(5):e64679, 2013.
- [9] J. DiGrazia, K. McKelvey, J. Bollen, and F. Rojas. More tweets, more votes: Social media as a quantitative indicator of political behavior. PloS one, 8(11):e79449, 2013.
- [10] E. Ferrara, O. Varol, F. Menczer, and A. Flammini. Traveling trends: social butterflies or frequent fliers? In Proceedings of the first ACM conference on Online social networks, pages 213–222. ACM, 2013.
- [11] D. Gayo-Avello. No, you cannot predict elections with Twitter. Internet Computing, IEEE, 16(6):91–94, 2012.
- [12] D. Gayo-Avello, P. T. Metaxas, and E. Mustafaraj. Limits of electoral predictions using Twitter. In ICWSM, 2011.
- [13] A. Go, R. Bhayani, and L. Huang. Twitter sentiment classification using distant supervision. CS224N Project Report, Stanford, pages 1–12, 2009.
- [14] J. W. Kim, D. Kim, B. Keegan, J. H. Kim, S. Kim, and A. Oh. Social media dynamics of global co-presence during the 2014 FIFA World Cup. In Proceedings of the ACM SIGCHI Conference on Human Factors in Computing Systems. ACM, 2015.
- [15] D. Lazer, R. Kennedy, G. King, and A. Vespignani. The parable of google flu: Traps in big data analysis. Science, 343(6176):1203–1205, 2014.
- [16] W. A. Mason, F. R. Conrey, and E. R. Smith. Situating social influence processes: Dynamic, multidirectional flows of influence within social networks. Personality and social psychology review, 11(3):279–300, 2007.
- [17] M. Mathioudakis and N. Koudas. Twittermonitor: trend detection over the Twitter stream. In Proceedings of the 2010 ACM SIGMOD International Conference on Management of data, pages 1155–1158. ACM, 2010.
- [18] T. Nasukawa and J. Yi. Sentiment analysis: Capturing favorability using natural language processing. In Proceedings of the 2nd international conference on Knowledge capture, pages 70–77. ACM, 2003.
- [19] A. Oghina, M. Breuss, M. Tsagkias, and M. de Rijke. Predicting imdb movie ratings using social media. In Advances in information retrieval, pages 503–507. Springer, 2012.
- [20] B. Pang and L. Lee. Opinion mining and sentiment analysis. Foundations and trends in information retrieval, 2(1-2):1–135, 2008.
- [21] F. Pedregosa, G. Varoquaux, A. Gramfort, V. Michel, B. Thirion, O. Grisel, M. Blondel, P. Prettenhofer, R. Weiss, V. Dubourg, J. Vanderplas, A. Passos, D. Cournapeau, M. Brucher, M. Perrot, and E. Duchesnay. Scikit-learn: Machine learning in Python. Journal of Machine Learning Research, 12:2825–2830, 2011.
- [22] H. Saif, M. Fernandez, Y. He, and H. Alani. Evaluation datasets for Twitter sentiment analysis. In Proceedings, 1st Workshop on Emotion and Sentiment in Social and Expressive Media (ESSEM) in Conjunction with AI* IA Conference, Turin, Italy, 2013.
- [23] H. Saif, Y. He, and H. Alani. Semantic smoothing for Twitter sentiment analysis. 2011.
- [24] H. Saif, Y. He, and H. Alani. Alleviating data sparsity for Twitter sentiment analysis. CEUR Workshop Proceedings (CEUR-WS. org), 2012.
- [25] H. Schoen, D. Gayo-Avello, P. T. Metaxas, E. Mustafaraj, M. Strohmaier, and P. Gloor. The power of prediction with social media. Internet Research, 23(5):528–543, 2013.
- [26] G. Shteynberg and E. P. Apfelbaum. The power of shared experience: Simultaneous observation with similar others facilitates social learning. Social Psychological and Personality Science, 4(6):738–744, 2013.
- [27] G. Shteynberg, J. B. Hirsh, E. P. Apfelbaum, J. T. Larsen, A. D. Galinsky, and N. J. Roese. Feeling more together: Group attention intensifies emotion. Emotion, 14(6):1102, 2014.
- [28] M. Speriosu, N. Sudan, S. Upadhyay, and J. Baldridge. Twitter polarity classification with label propagation over lexical links and the follower graph. In Proceedings of the First workshop on Unsupervised Learning in NLP, pages 53–63. Association for Computational Linguistics, 2011.
- [29] M. Thelwall, K. Buckley, and G. Paltoglou. Sentiment in Twitter events. Journal of the American Society for Information Science and Technology, 62(2):406–418, 2011.
- [30] A. Tumasjan, T. O. Sprenger, P. G. Sandner, and I. M. Welpe. Predicting elections with Twitter: What 140 characters reveal about political sentiment. ICWSM, 10:178–185, 2010.
- [31] O. Varol, E. Ferrara, C. L. Ogan, F. Menczer, and A. Flammini. Evolution of online user behavior during a social upheaval. In Proceedings of the 2014 ACM conference on Web science, pages 81–90. ACM, 2014.
- [32] X. Zhang, H. Fuehres, and P. A. Gloor. Predicting stock market indicators through Twitter “i hope it is not as bad as i fear”. Procedia-Social and Behavioral Sciences, 26:55–62, 2011.