The Swift UVOT grism calibration and example spectra
Abstract:
The calibration of the two UVOT grisms which provide slitless spectroscopy in the 170-500 nm (UV grism) and 295-660 nm (visible grism) ranges has been completed. The UV grism has a spectral resolution () of 75 at 2600 Å for source magnitudes of u=10-16 mag, while the visible grism has a spectral resolution of 100 at 4000 Å for source magnitudes of b=12-17 mag. For brighter spectra, coincidence loss (pile-up) occurs in the photon-counting detector. A correction for the coincidence loss in grism spectra has been developed, and limits have been established above which that correction fails. After discussing the UVOT grisms and their calibration, an illustration is given of the breadth of the UVOT grism spectroscopy.
1 Introduction
The Swift Ultraviolet and Optical Telescope (UVOT) includes two grisms in its filter wheel. One was optimised for the UV, one for the optical, though the optical grism extends further into the UV than is accessible from the ground. Since the Swift launch in December 2005, grism observations of many targets have been made. The easy scheduling of Swift has made UV spectroscopy of many novae and supernovae possible, often within a day of their discovery. Spectroscopy of other variables such as Be-WD binary systems has also been carried out but is more challenging as these are generally fainter [1]. Spectroscopy of comets has also been successful in identifying the production rates of various molecules and dust from the spectra of their coma [2].
2 The UVOT grisms and their calibration
In Table 1 the relevant parameters of the UVOT grisms have been summarized. Both grisms are sensitive below the typical atmospheric cutoff at around 3200Å. Although there are only two grisms present in the UVOT filterwheel, each grism has two default observing modes, called ’nominal’ and ’clocked’. In the clocked mode part of the aperture is blocked so that for part of the image the first orders are free from zeroth order contamination due to field stars. The photon-counting detectors provide stable, accurate measurements of the count rate over a range of about 5 magnitudes.
| visible grism | UV grism | |
|---|---|---|
| first order wavelength range | 2850-6600 Å | 1700-5000 Å |
| first order wavelength accuracy (1) | 22 Å | 9 (18a) Å |
| spectral resolution | 100 at 4000 Å | 75 at 2600 Å |
| no order overlap (first order) | 2850-5200 Å | 1700-2740 Å |
| effective magnitude range | 12-17 mag | 10-16 mag |
| dispersion (first order) | 5.9 Å/pixel at 4200Å | 3.1 Å/pixel at 2600Å |
| zeroth order -magnitude zeropoint | 17.7 mag | 19.0 mag |
| effective area error nominal mode | 11 % | 15 % |
| effective area error clocked mode | 15 % | 9 % |
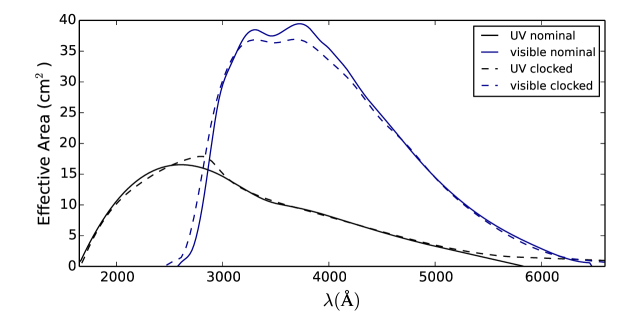
| UV nominal grism. |
The grism provides slitless spectroscopy and the spectrum position on the image is referenced by using an anchor point. The position of the anchor on the image is derived from the sky position of the source and the pointing knowledge. One can use either the zeroth orders in the grism image, or an image in a lenticular filter taken along with the grism exposure to determine the pointing and the anchor position. The lenticular filter method being preferred, as without it the wavelength errors are currently about twice as large. The wavelength accuracy given in Table 1 is based on using the lenticular filter. The anchor position accuracy is the main source for the wavelength error, with possibly a small additional error at the end of the wavelength range as a result of the non-linear dispersion sensitivity to the anchor.
The UVOT microchannel plate intensified photon counting detector system is read out every 11 ms and thus the image is being built up. If in one such 11ms time frame there are multiple photons incident at the same detector location, only one is registered. Therefore there are lost counts, and this is known as coincidence loss. The process is governed by Poisson statistics, and a correction can be made. We have calibrated this correction which affects the brightest sources and/or features in the grism spectra. The correction is made by multiplying the observed count rate with a factor which is accurate to within 20%.
The grism throughput varies with the wavelength of the photons. This sensitivity variation is determined in terms of the grism effective area. The effective area was determined for each grism mode after correcting for coincidence loss. The nominal grism modes show a nearly constant effective area over the whole detector. In the clocked grism modes, due to the clocking covering part of the aperture, the effective area varies by position of the spectrum on the detector. Fig. 1 shows the resulting effective areas for spectra at the centre of the detector.
The calibration of the grisms is described in detail in [3]. In the next section a sample of the spectra can be found. It should be mentioned that an easy to use spectral extraction is now possible by using the UVOTPY software [4] which was written in the freely available Python language. Documentation for the grism111http://www.mssl.ucl.ac.uk/www_astro/uvot and the UVOTPY software222http://github.com/PaulKuin/uvotpy are available on-line.
3 A display of grism spectra
3.1 SN2009ip
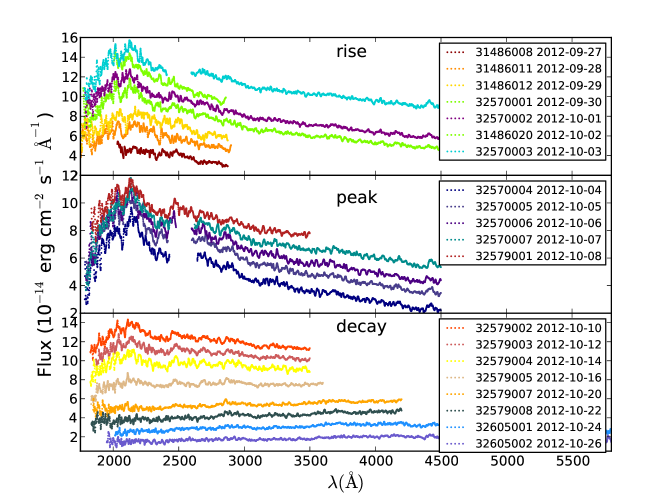
The Type IIP supernovae have substantial UV emission which evolves over time when the ejecta cools. A good example is SN2009ip, see Fig. 2, [6] which had a failed eruption in 2009 and was then suspected as being a SN imposter, but eventually became a well-observed full-blown supernova in 2012. The required exposure times became longer when the SN became fainter. The last spectra were obtained by summing multiple exposures. Early exposures had the spectrum positioned at the centre of the detector. By using an offset position, later spectra avoided second order contamination up to much longer wavelengths, which can clearly be seen in the spectra. Some gaps were created where zeroth orders of field stars contaminated the spectra.
Many supernova spectra have been observed with the UV grism. Their spectra are being carefully processed and will be made available through the SOUSA archive [5].
3.2 Nova RS Oph 2006
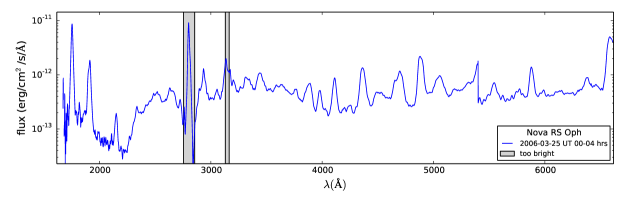
Nova RS Oph was observed with both grisms during the 2006 outburst. Combining the data from both grisms, a spectrum from 1750 to 6600Å has been obtained as shown in Fig. 3. Note that the Mg II 2800, and (marginally) the 3135Å lines were too bright; the count rate there is too large for a coincidence loss correction in both grisms. Such a bright feature can also be seen to affect the nearby continuum by depleting the observed count rate there. This is related to the spatial extent of the coincidence loss.
3.3 AGN
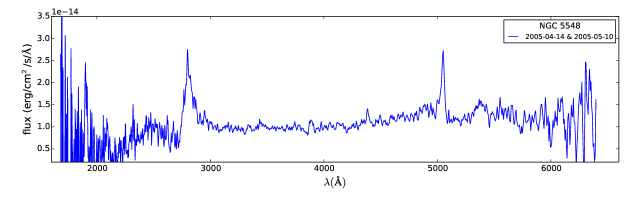
The spectrum of NGC 5548 (April 2005) of an active galactic nucleus, is shown in Fig. 4. The spectrum shown is the sum of a UV and visible grism spectrum. Notable are the emission lines of CIII], Mg II, and [OIII]. Detailed modeling of the NGC 5548 spectrum, in combination with other multi-spectral data, can be found in [7].
3.4 Wolf-Rayet Stars
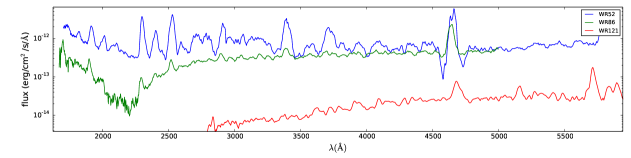
Spectra of a number of galactic WR stars have been obtained in a fill-in program. The brighter WR 52 and WR 86 were observed earlier by IUE, but we have obtained a new spectrum of the weaker WR 121, see Fig. 5. These spectra span approximately the brightness range accessible with the UVOT grisms.
3.5 Comparison to HST spectral standards
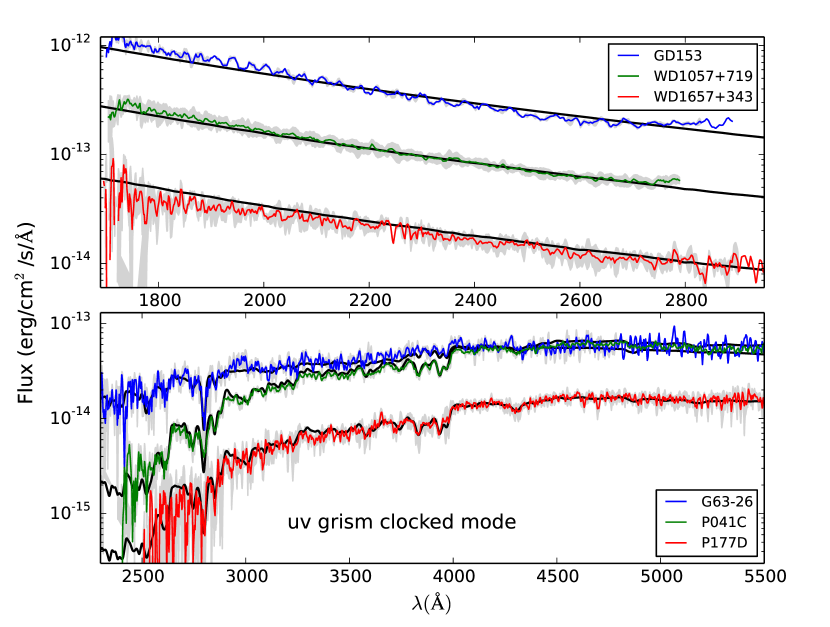
For the calibration of the coincidence loss and the effective area, grism spectra have been compared to HST standards. In Fig. 6 the HST and Swift UVOT spectra are plotted together for White Dwarfs and Solar type stars. The Solar type stars do not have much UV flux, while the UV dominates in the White Dwarf spectra. This means that for the Solar type stars the second order contamination can be neglected for wavelengths below 4500Å, while in the White Dwarfs the second order can affect the spectrum from 2750Å and above.
References
- [1] M. Morii et al., Extraordinary luminous soft X-ray transient MAXI J0158-744 as an ignition of a nova on a very massive O-Ne white dwarf, Ap. J. 779 (2013) 118.
- [2] D. Bodewits et al., Swift-UVOT grism spectroscopy of comets: a first application to C/2007 N3 (Lulin), Ap. J. 141 (2011) 12.
- [3] N.P.M. Kuin et al., The Swift-UVOT ultraviolet and visible grism calibration, MNRAS 449(3) (2015) 2514; Astro-ph/1501.02433.
- [4] N.P.M. Kuin, UVOTPY: Swift UVOT grism data reduction, Astrophysics Source Code Library (2014) record ascl:1410.004.
- [5] P.J. Brown et al., SOUSA: the Swift Optical/Ultraviolet Supernova Archive, Astrophysics & Space Science 354 (2014) 89.
- [6] R. Margutti et al., A Panchromatic View of the Restless SN 2009ip Reveals the Explosive Ejection of a Massive Star Envelope, Ap. J. 780 (2014) 21.
- [7] M. Mehdipour et al., Anatomy of the AGN in NGC 5548 I. A global model for the broadband spectral energy distribution, A & A 585A (2015) 22; Astro-ph/1501.01188.