Origin of anomalous breakdown of Bloch’s rule in the Mott-Hubbard insulator MnTe2
Abstract
We reinvestigate the pressure dependence of the crystal structure and antiferromagnetic phase transition in MnTe2 by the rigorous and reliable tool of high pressure neutron powder diffraction. First-principles density functional theory calculations are carried out in order to gain microscopic insight. The measured Néel temperature of MnTe2 is found to show unusually large pressure dependence of K GPa-1. This gives rise to large violation of Bloch’s rule given by , to a value of -6.0 0.1 for MnTe2. The ab-initio calculation of the electronic structure and the magnetic exchange interactions in MnTe2, for the measured crystal structures at different pressures, gives the pressure dependence of the Neél temperature, to be -5.61, in close agreement with experimental finding. The microscopic origin of this behavior turns to be dictated by the distance dependence of the cation-anion hopping interaction strength.
pacs:
75.30.Vn, 75.25.+z, 75.40.CxI Introduction
Long time ago in 1966, Bloch bloch66 studied the pressure variation of the Néel temperature, and that of volume () of several transition-metal (TM) based antiferromagnetic insulators (AFI) and came up with the general relationship
| (1) |
In the localized-electron limit where perturbative superexchange theory is applicable, the Néel temperature can be related to the effective TM-TM hopping interaction (), charge transfer energy () and Coulomb interaction (), as
| (2) |
The first term in the above equation is the Anderson superexchange term and the second term involves the two electron transfer from the anion. A theoretical rationalization of the Bloch’s rule comes from the calculations of the variation of the cation-anion transfer integral with the cation-anion bond length , which varies as . The calculated valuessmith69 ; shrivastava76 of using molecular orbital theory or configuration interaction method on transition-metal oxides and flourides, turn out to be in the range 2.5-3. This leads to , assuming . Experimentally Bloch’s rule is obeyed by a variety of Mott insulators. However, there are exceptions too. For example, while Bloch rule is found to be obeyed in YCrO3 and CaMnO3, it was found to fail in LaMnO3.goodenough The failure has been explained in terms of breakdown of localized approach used in Bloch’s formulation. We note that the cases discussed so far on the pressure dependence of TN, all involve oxygen or flourine, i.e. anions with 2 electrons. As is well known, the nature of anionic wavefunction changes as one moves down the column of the periodic table, from 2 to 3 series and even more to 4 and 5 series, effecting the TM-anion bonding. It would therefore be of interest to consider the validity of Bloch’s criterion in case of TM compounds containing anions like Te.
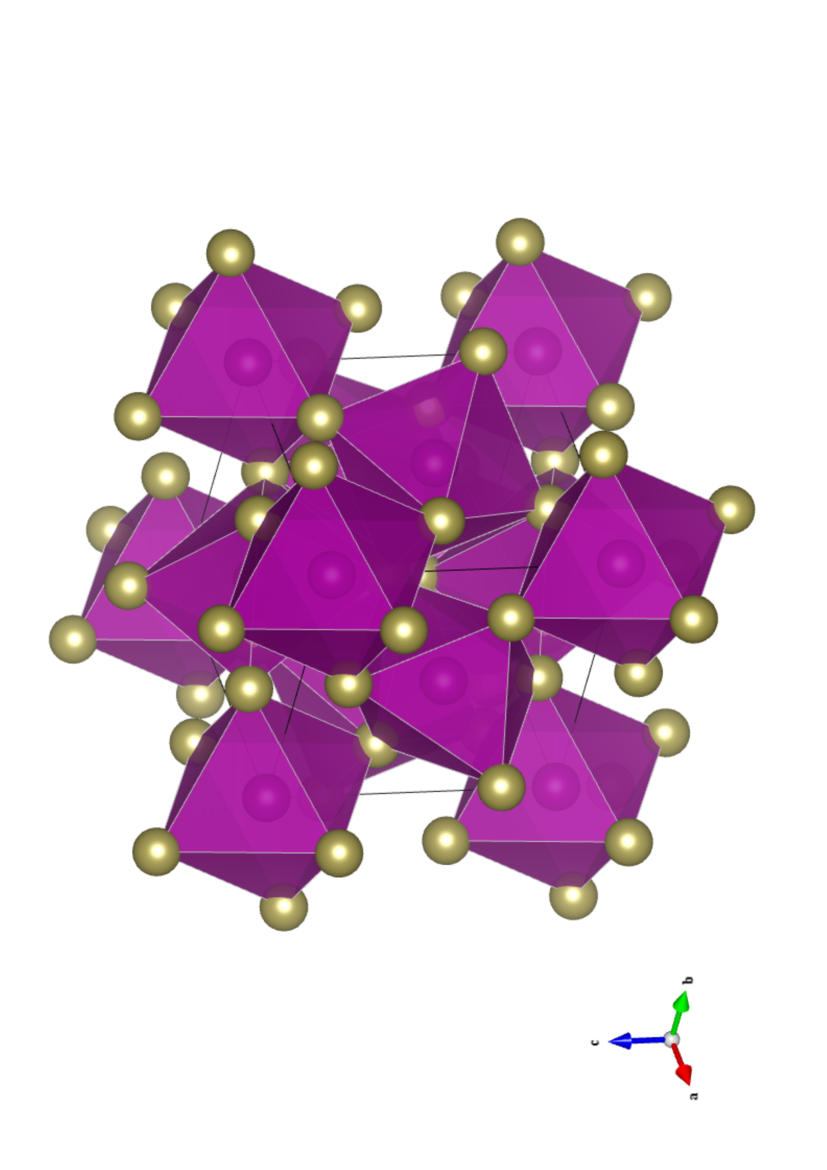
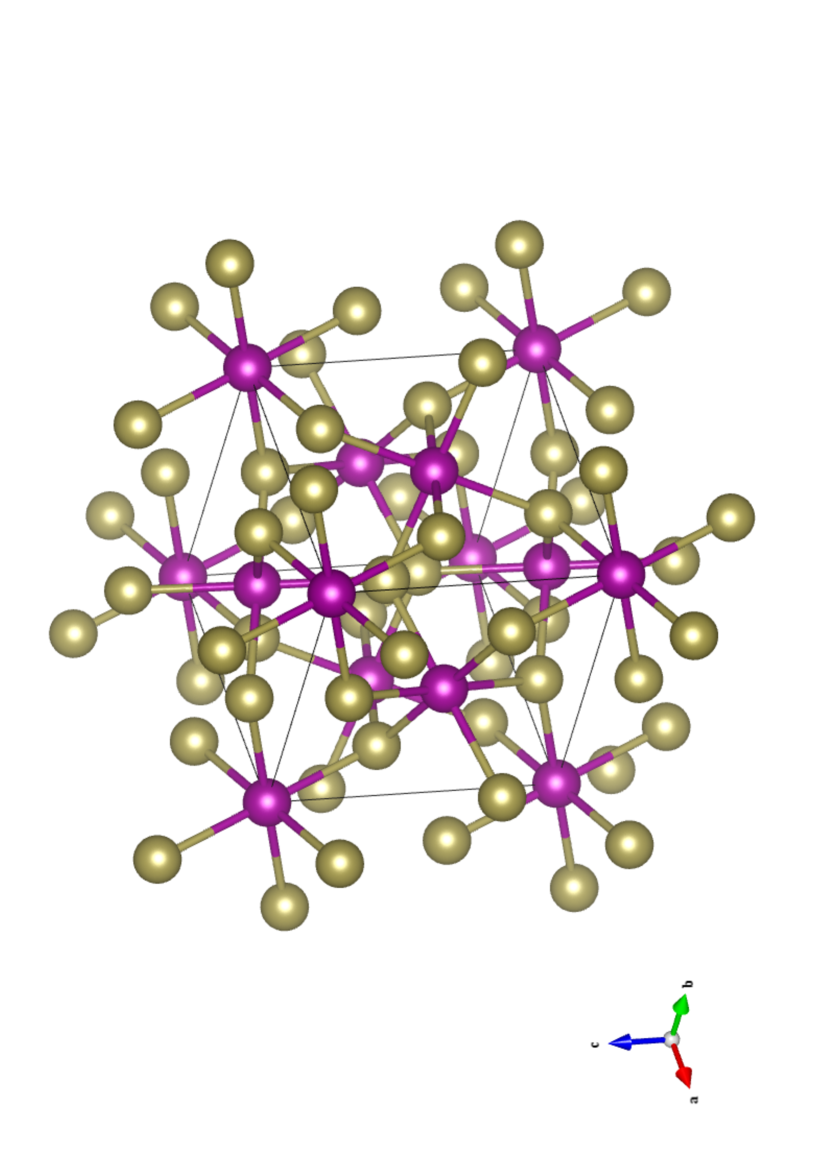
A compound of interest in this context is MnTe2. MnTe2 belongs to a large class of pyrite type and related marcasite and arsenopyrite type compounds MX2 (M = transition element, X = Chalcogen or pnictogen element) with diverse magnetic and electrical properties. They range from insulator to metal or even superconductor. They can be diamagnetic, weakly paramagnetic, ferromagnetic or antiferromagnetic etc. The magnetic semiconductor MnTe2 having a pyrite type crystal structure, as shown in Fig. 1, orders below K in type-I antiferromagnetic structurehastings59 ; chattopadhyay87a ; burlet97 with the propagation vector . The magnetic phase transition at was found to be of second order within experimental resolution chattopadhyay87a ; burlet97 although the related other manganese dichalcogenides MnS2 and MnSe2 undergo first-order phase transitionshastings76 ; chattopadhyay84 ; chattopadhyay91 ; chattopadhyay87b at . The magnetic structure of MnTe2 had been subject to controversy,hastings59 ; pasternak69 ; hastings70 regarding whether the magnetic structure of MnTe2 is of collinear single-k or non-collinear triple-k type, or whether there is any spin reorientation transition. Burlet et al.burlet97 resolved this controversy and determined the magnetic structure to be of non-collinear triple-k type. The structure was found to be stable below down to 4.2 K, the lowest temperature at which the magnetic structure was investigated.
The high pressure X-ray diffraction was carried out previously,fjellvag85 ; fjellvag95 to study the pressure induced volume changes in MnTe2, though no detailed structural analysis was carried out in terms of determination of atomic positions. Also, in a separate study the pressure dependence of Neél temperature was obtained from resistivity and Mössbauer measurements.vulliet01 The results of these two studies put together show a large violation of Bloch’s rule, which however has not been stressed before. More importantly, a microscopic understanding of this phenomena was lacking.
In the present study, we take up this issue by experimentally revisiting the pressure dependence of the structure and magnetic ordering temperature of MnTe2 in terms of high-pressure powder neutron diffraction measurment, together with first-principles density functional theory (DFT) calculation to provide the microscopic understanding. The neutron diffraction study carried out in the present work, is undoubtedly a more reliable tool to measure the magnetic transition temperatures, compared to resistivity or Mössbauer. In addition, the present neutron diffraction study provide the detailed structural information, which was not available before, based on which our first-principles calculations have been carried out. Our rigorous study confirms and rationalizes the breakdown of Bloch’s rule in MnTe2.
II Methodology
High pressure neutron diffraction investigations were done on three neutron powder diffractometers, viz. PEARL at the ISIS Facility in UK, D20 of Institute Laue-Langevin, Grenoble and also SNAP at SNS, Oak Ridge. Pressure was generated by Paris-Edinburgh pressure cells besson92 ; klotz05 and a mixture of 4:1 deuterated methanol:ethanol was used as pressure transmitting medium. The PEARL measurements used anvils made of tungsten carbide and a scattering geometry which restricted the available d-spacing range to below 4.2 , i.e. the magnetic (100) reflection was not recorded. Rietveld refinements of the patterns to the crystal structure were carried out by the GSAS program vondreele86 . The experiments on D20 and SNAP used anvils made of cubic boron nitride klotz05 and a scattering geometry which gives access to reflections with larger d-spacings. The sample temperature was controlled using closed-cycle cryostats; fast cooling to 77 K was achieved by flooding the cell assembly with liquid N2. The pressure was determined from the known pressure variation fjellvag85 ; fjellvag95 of the lattice parameter of MnTe2.
DFT calculations on the experimentally measured structures were carried out in the plane-wave basis, within the generalized gradient approximation (GGA) for the exchange-correlation functional, as implemented in the Vienna Ab-initio Simulation Package.vasp We used Perdew-Burke-Ernzerhof implementation of GGA.pbe The projector augmented wave potential was used. For the total energy calculation of different spin configurations, we considered a 2 2 1 super-cell containing a total of 48 atoms in the cell. For the self-consistent field calculation, an energy cut-off of 600 eV and 4 4 8 Monkhorst-pack K-point mesh were found to provide good convergence of the total energy. The missing correlation at the Mn sites beyond GGA, was taken into account through supplemented Hubbard (GGA+) calculationgga+u following the Dudarev implementation, with choice of = 5.0 eV and Hund’s coupling, JH of 0.8 eV. Variation in value has been studied and found to have no significant effect on the trend.
III Evolution of the Structural parameters under Pressure
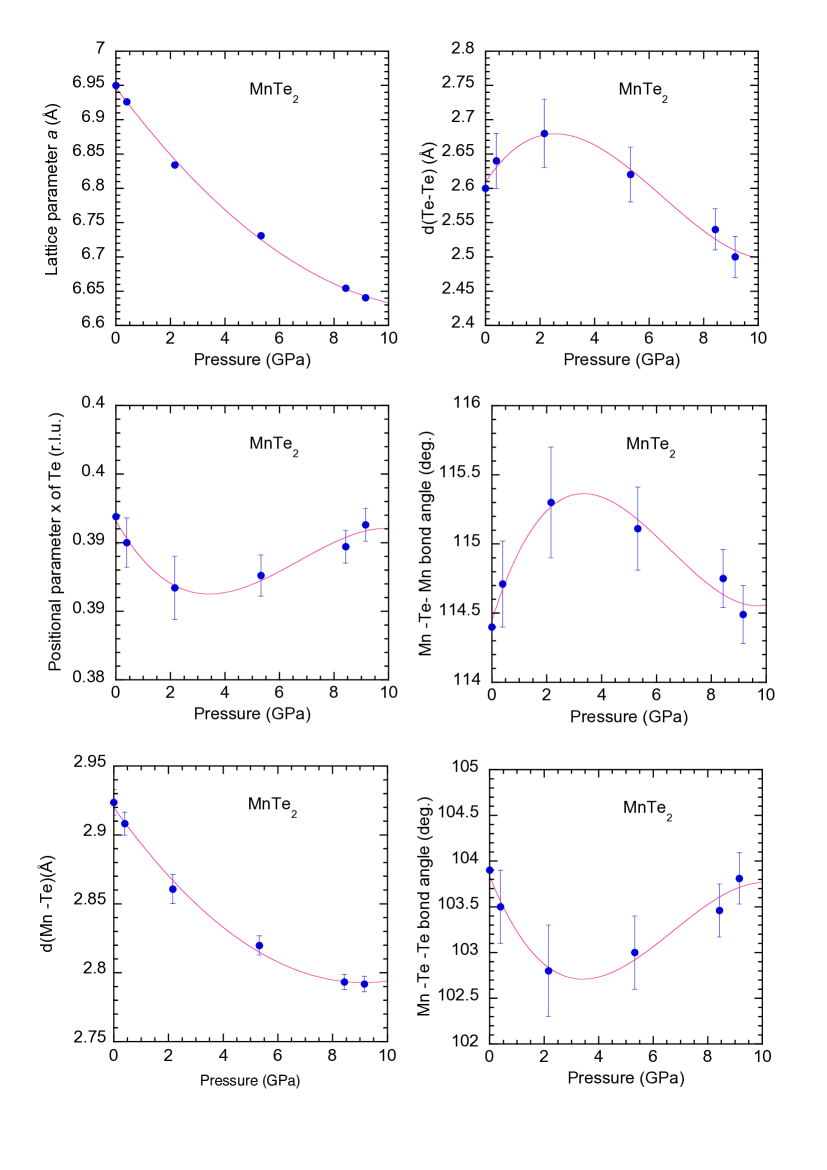
The pyrite type crystal structure of MnTe2 in the space group has Mn atom at and Te atom at position. The cubic lattice parameter and the Te positional parameter were refined along with the isotropic atomic displacement parameters of Mn and Te atoms. Figure 2 shows the pressure dependence of the structural parameters of MnTe2, viz. lattice parameter, positional parameter of Te atom, Mn-Te and Te-Te bond lengths and the Mn-Te-Mn and Mn-Te-Te bond angles. The results are very remarkable and contrary to our naive expectation that the Te-Te bond distance would continuously decrease with pressure. Instead the bond distance seems to increase slightly at lower pressure but after reaching a maximum at P = 2 GPa it decreases and becomes somewhat flat at about P = 10 GPa. The two bond angles also show anomalous pressure dependence. This is expected since all the relevant bond distances and angles are derived from the single Te positional parameter and the cubic lattice parameter that decreases with pressure in the usual way. In contrast, the Mn-Te bond length is highly pressure sensitive and almost entirely responsible for the pressure-induced volume reduction, suggesting relatively weak Mn -Te bonds which are susceptible to changes upon application of pressure. The remarkable pressure response of the Te-Te bond distance and Mn-Te-Mn and Mn-Te-Te angles should be reflected in the pressure dependence of the superexchange interaction that decides the pressure variation of the Néel temperature, as obtained in our first-principles calculations. Fig. 3 shows the pressure variation of the unit cell volume of MnTe2 and its fit with Murnaghan equation of state. The fit gave GPa and where is the bulk modulus and is its pressure derivative. The values agree well with the values determined previously from high pressure X-ray diffraction fjellvag85 ; fjellvag95 .
IV Measured Pressure Variation of TN
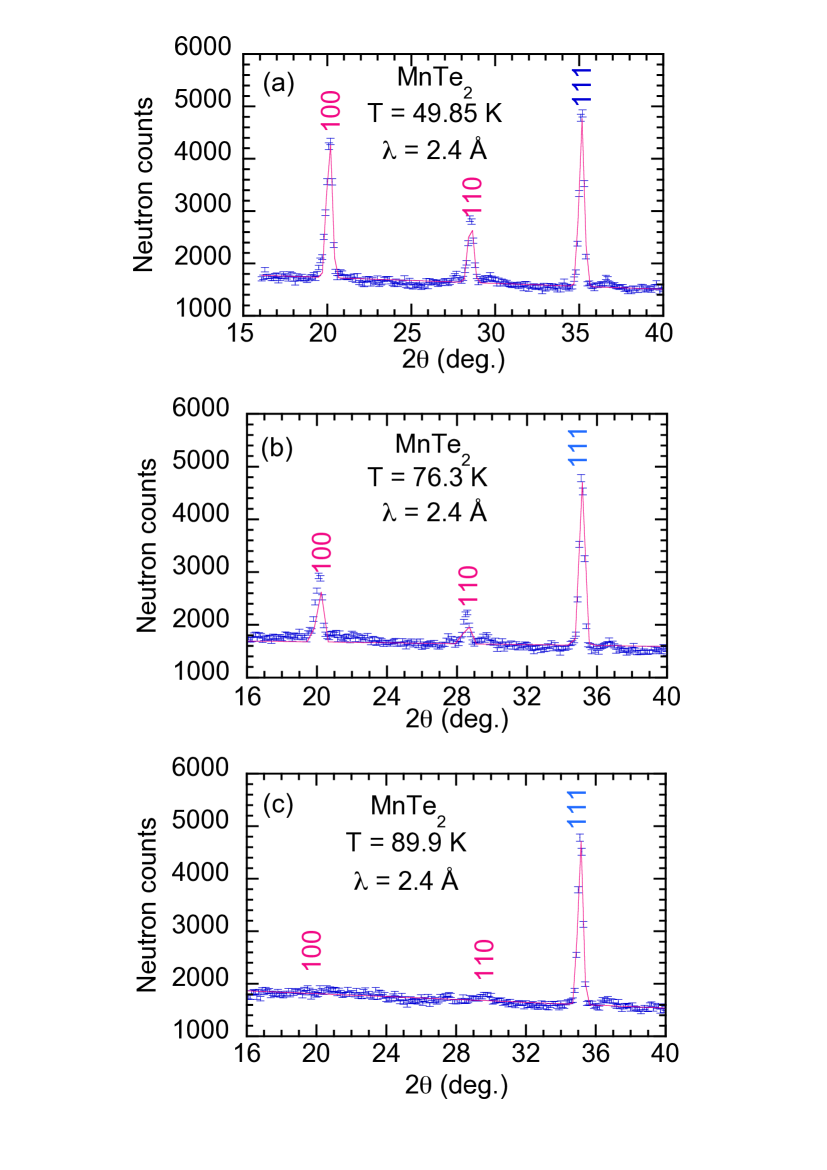
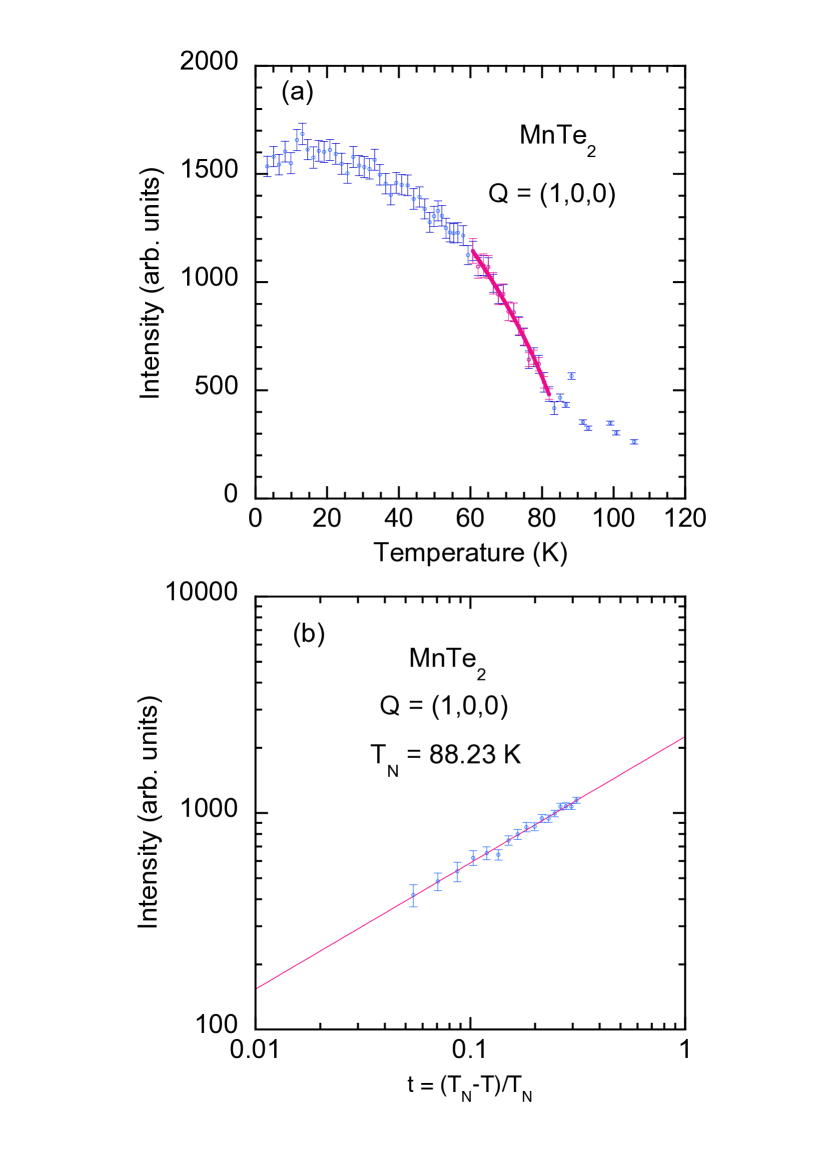
The antiferromagnetic phase transition of MnTe2 was first investigated at ambient pressure with the sample (outside the pressure cell) fixed to the cold tip of the standard orange cryostat. Fig. 4 shows neutron powder diffraction intensities of the and magnetic peaks along with the nuclear peak at several temperatures below and close to the antiferromagnetic Néel temperature K. Fig. 5(a) shows the temperature variation of the integrated intensity of the magnetic Bragg peak. The intensity of this reflection decreases continuously with increasing temperature and becomes zero at about K. The data just below could be fitted by a power-law exponent
| (3) |
where is the integrated intensity, is the saturation value of the intensity at , is the critical temperature and is the power-law exponent. Least-squares fit of the data in the temperature range from to K gave and a Néel temperature K. The fitted value of the Néel temperature was used to determine the reduced temperature . We then produced a standard log-log plot shown in Fig. 5 (b) to extract the critical exponent from the slope that agreed well with that determined by the least-squares fit.
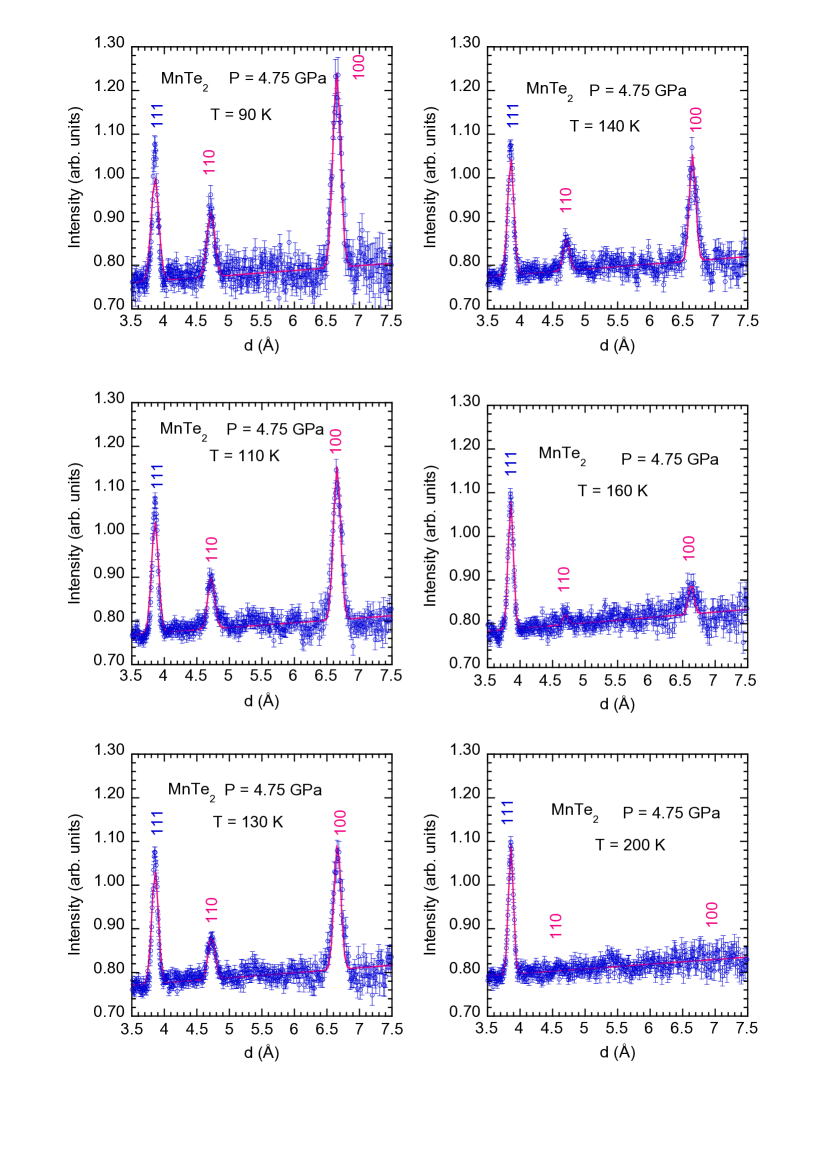
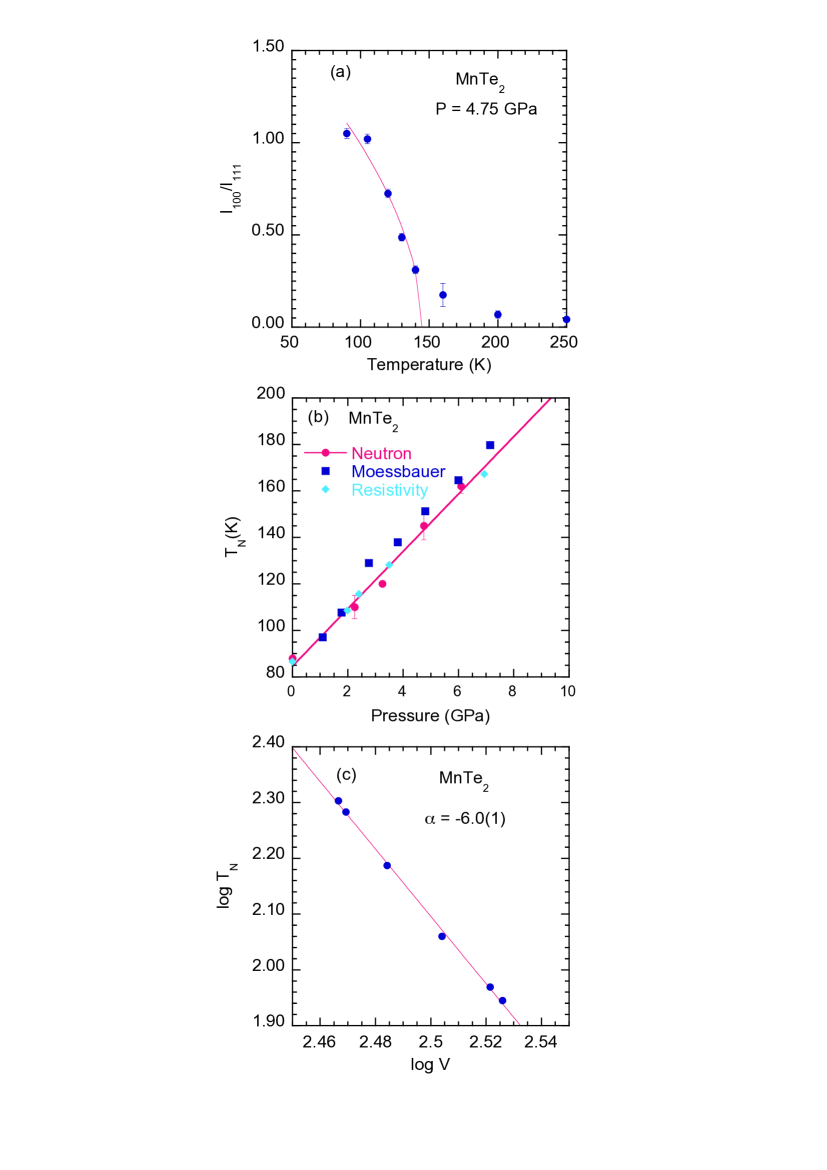
Fig. 6 shows neutron powder diffraction intensities of the and magnetic peaks along with the nuclear peak of MnTe2 under GPa at several temperatures below and above the antiferromagnetic Néel temperature. It is immediately noticed that the application of hydrostatic pressure P = 4.75 GPa increases the Néel temperature K of MnTe2 substantially. By fitting the temperature dependence of the intensity of the magnetic peak and fitting the data by a power law we determine K. Fig. 7(a) shows this fit. Similarly we determined the Néel temperatures of MnTe2 at several pressures. The result is shown in Fig. 7(b). The obtained trend agrees well with that obtained from resistivity and Mössbauer spectroscopyvulliet01 , as also shown in Fig. 7(b). The neutron diffraction results show that of MnTe2 increases linearly in the pressure range GPa at a rate of about K GPa-1, determined from the slope of the linear plot. From this linear relationship we calculated the TN values for the pressures at which we determined the lattice and positional parameters of MnTe2 from the high pressure neutron diffraction experiment on the PEARL diffractometer. Fig. 7(c) shows the log-log plot of Néel temperature TN vs. unit cell volume of MnTe2. The slope of this plot gives which is much larger than the Bloch rule value of . Our result therefore point towards a spectacular breakdown of Bloch’s rule in MnTe2. We note that transition to a non-magnetic state of the Mn2+ ions in MnTe2 was reportedvulliet01 from the resistivity and Mössbauer study, and also evidenced by the pressure variation of infrared reflectivity investigated by Mita et al. mita08 . Our experiments however did not show the volume collapse observed in high pressure X-ray diffraction experiments fjellvag85 ; fjellvag95 . It is therefore plausible that we did not reach the transition pressure during the present high pressure neutron diffraction experiments. The exact pressure at which the transition to a non-magnetic state is expected to happen depends sensitively on the experimental conditions.
The present neutron diffraction data contain in principle the magnetic moment information because neutron diffraction probes both crystal and the magnetic structures and the intensities of the magnetic reflections when put to the absolute scale by using the intensities of the nuclear reflections can give the ordered moment values. However this is not an easy task especially in a high pressure experiment using a large Paris-Edinburg pressure cell. The high absorption of the pressure cell and also a very high background hinders accurate determination of the nuclear and magnetic intensities. In the present case despite our efforts the determination of the pressure dependence of ordered moment from the neutron diffraction data was not successful. We know however from our calculations (using pressure dependence of the structural parameters) that the ordered moment of Mn ions does not change at all (or very little) in the range 0 - 9 GPa investigated. The present high pressure neutron diffraction data seem to support this result. The intensity ratio of the magnetic and nuclear Bragg peaks do not change very much and is within the accuracy in the pressure range investigated.
V First-Principles Study
V.1 Calculated Pressure Variation of Neél Temperature
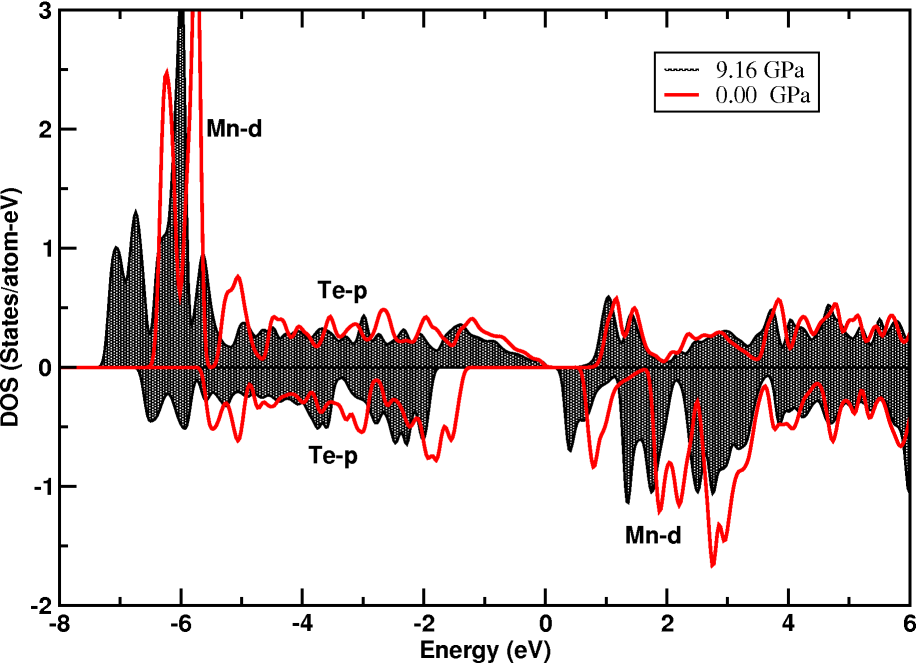
To gain understanding on the significantly large pressure dependence of the Neél temperature in MnTe2 we carried out theoretical investigation in terms of first-principles DFT calculations. Fig. 8 shows the comparison of the spin-polarized density of states of MnTe2 at ambient pressure and at a pressure of 9.16 GPa, the highest pressure studied in the present calculations. The spin-polarized calculations within GGA+ gave rise to a magnetic moment of 4.6 (4.5 ) at Mn site together with a moment of 0.03 (0.05 ) at Te site for the ambient (P = 9.16 GPa) pressure condition, suggesting the high-spin state of Mn at both ambient and high pressure conditions, in agreement with experimental findings. Both ambient pressure and high pressure phases were found to be insulating, with a gap at Fermi energy, marked as zero in the figure. The Mn- states are fully occupied in the majority spin channel and completely empty in minority spin channel, in correspondence with high spin state of Mn in its nominal 2+ valence state. The comparison of the density of states between ambient pressure and at high pressure though, shows enhancement of the Mn- band width by 1 eV, indicating the hopping interaction between Mn- and Te to increase substantially in moving from ambient to high pressure phase.
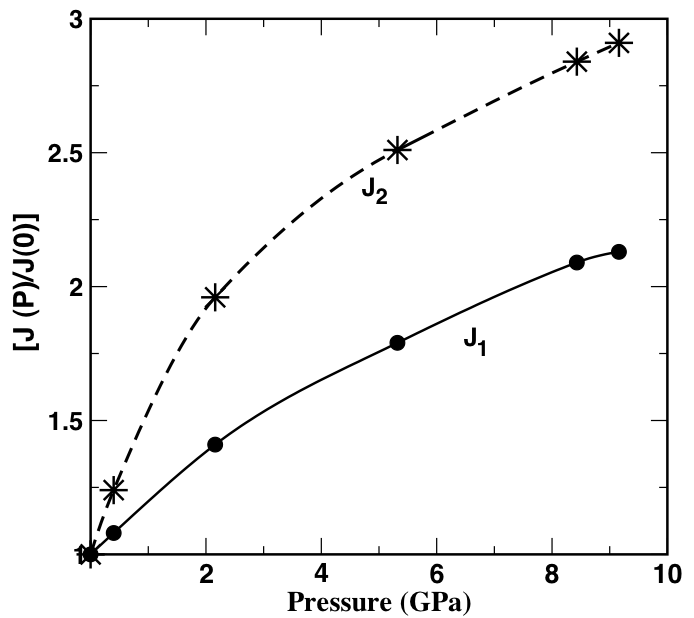
To extract the various magnetic interactions (’s) between the Mn spins, we calculated the GGA+ total energies for various configurations of Mn spins and mapped the total energy onto an underlying S = 5/2 Heisenberg model. Calculations were carried out for six different pressures, 0.0 GPa, 0.4 GPa, 2.16 GPa, 5.32 GPa, 8.43 GPa and 9.16 GPa. The dominant magnetic interactions considered in our calculation of ’s, were , between the first nearest neighbor (1NN) Mn atoms, connected to each other by the corner-shared Te atoms, and , between the second nearest neighbor (2NN) Mn atoms, connected to each other through Te-Mn-Te bridges.
Apart from the ferromagnetic (FM) configuration, with all Mn spins in the supercell pointing in the same direction, two different antiferromagnetic (AFM) configurations, AFM1 and AMF2 were considered, with antiferromagnetic arrangement of 1NN Mn and 2NN Mn spins. The GGA+ total energies corresponding to AFM configurations, measured with respect to the energy of FM configuration, turned out to be negative, for all the studied pressures, in accordance with dominance of anti-ferromagnetic interactions. Extracting J1 and J2 by mapping the total energy onto the spin Hamiltonian, given by , gave a small fraction of , with / = 0.09 at ambient pressure and 0.12 at 9.16 GPa, suggesting the magnetism being primarily governed by . The pressure dependence of exchange interactions is shown in Figure 9.
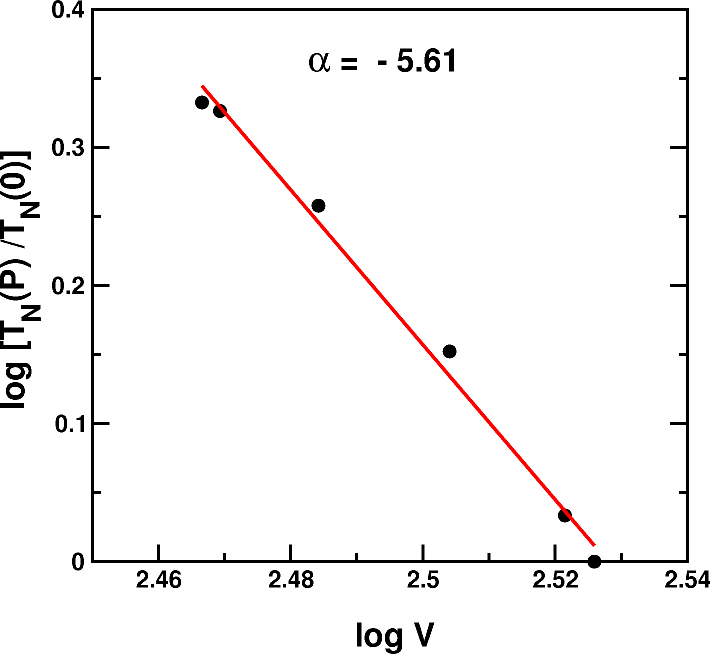
With the knowledge of J’s, we calculated the Neél temperature TN using Mean-field theory, given by , where is the net effective interaction 12 + 4, S = 5/2, and is the Boltzmann constant. Mean field is expected to overestimate the transition temperature, though the trend is expected to captured well, which is governed by ’s. The computed log[(P)/(0)] plotted as a function of log() is shown in Fig. 10. The straight line fit to the calculated data points gives rise to a slope of -5.61, close to the experimental estimate of -6.0 0.1. Both our experimental results and ab-initio calculations, thus establish that Bloch’s rule is largely violated in MnTe2. In the following we theoretically investigate the microscopic origin of this behavior.
V.2 Microscopic Origin of breakdown of Bloch rule
Bloch’s rule has been found to be very successful with many magnetic insulators, especially the transition metal oxides and fluorides. The question then arises: what makes the Bloch’s rule fail for MnTe2? In order to explore this, we extracted the hopping interactions , where and signifies Mn and Te, respectively, by carrying out N-th order muffin-tin orbital (NMTO) based NMTO-downfolding calculations.nmto This involved construction of real-space representation of the Mn - O Hamiltonian in Wannier function basis out of the full DFT calculations, by integrating out all the degrees of freedom other than Mn and Te . Our NMTO-downfolding calculations to extract the dependence of on cation-anion distance gave, , instead of assumed for derivation of the Bloch’s rule. This gives , very close to the estimate obtained from total energy calculations, as well as from the experiment. This points to the fact that violation of Bloch’s rule in case of MnTe2 is caused due to the deviation in the distance dependence of , from the behavior rather than that by or . We find that the distance dependence of found for MnTe2, is more like the canonical behaviour,oka in which the interatomic matrix elements are supposed to scale with distance as where and are the angular momenta of the orbitals involved. In case of several TM oxides, on the other hand, anaylysis of DFT band structure,dd gave rise to a behavior, similar to that obtained from molecular orbital theory or configuration interaction method on KNiF4 or MnO or MnF2smith69 ; shrivastava76 . This presumably originates from differential nature of Te 4 wavefunctions compared with that of 2 or 3, which together with non monotonic pressure dependence of position parameter, x, influences the super-exchange interaction in a differential manner.
VI Summary
In conclusion, the Néel temperature of MnTe2 was found to show unusually large pressure dependence of about K GPa-1, which has been confirmed in the present study through more rigorous and reliable high pressure neutron diffraction experiments compared to that in literature, as well as through first-principles density functional theory calculations. Our measured pressure dependence of the Néel temperature and unit cell volume gave which is much larger than that expected from the Bloch’s rule . The calculated pressure dependence of Néel temperature gave rise to in good agreement with the experimental estimate. We provided a microscopic understanding of this behavior in terms of the distance dependence of Mn-Te hopping interaction upon application of pressure, which showed significant deviation from that for NiF4 or MnO or MnF2smith69 ; shrivastava76 .
Finally, the large pressure dependence of magnetic interactions and magnetic ordering temperature provide us with a handle to tune the properties of magnetic materials, which can lead to important technological applications. The present study, should have important bearing on this topic.
References
- (1) D. Bloch, J. Phys. Chem. Solids 27, 881 (1966).
- (2) D.W. Smith, J. Chem. Phys., 50, 2784 (1969).
- (3) K.N. Shrivastava and V. Jaccarino, Phys. Rev. B 13, 299 (1976).
- (4) J.-S. Zhou and J.B. Goodenough, Phys. Rev. Lett. 89, 087201-1 (2002).
- (5) J.M. Hastings, N. Elliott, and L.M. Corliss, Phys. Rev. 115, 13 (1959).
- (6) T. Chattopadhyay, and H. Fjellvag, Phys. Lett. A 120, 44 (1987).
- (7) P. Burlet, E. Ressouche, B. Malaman, R. Welter, J.P. Sanchez, and P. Vulliet, Phys. Rev. B 56, 14013 (1997).
- (8) J.M. Hastings, and L.-M. Corliss, Phys. Rev. B 14, 1995 (1976).
- (9) T. Chattopadhyay, H.G. von Schnering, and H.A. Graf, Solid State Comm. 50, 865 (1984).
- (10) T. Chattopadhyay, T. Brückel and P. Burlet, Phys. Rev. B 44, 7394 (1991).
- (11) T. Chattopadhyay, J. Rossat-Mignod and H. Fjellvåg, Solid State Comm., 63, 65 (1987).
- (12) M. Pasternak and A.M. Spijkervet, Phys. Rev. B 181, 574 (1969).
- (13) J.M. Hastings, L.M. Corliss, M. Blume, and M. Pasternak, Phys. Rev. B 1, 3209 (1970).
- (14) H. Fjellvåg, A. Kjekshus, T. Chattopadhyay, H.D. Hochheimer, W. Hönle and H.G. von Schnering, Phys. Lett. 112A, 411 (1985).
- (15) H. Fjellvåg, W.A. Grosshans, W. Hönle and A. Kjekshus, J. Magn. Magn. Mat. 145, 118 (1995).
- (16) T. Chattopadhyay and H.G. von Schnering, J. Phys. Chem. Solids 46, 113 (1985).
- (17) T. Chattopadhyay, H.G. von Schnering and W.A. Grosshans, Physica B 139&140,305 (1986).
- (18) S.A.J. Kimber, A. Salamat, S.R. Evans, H.O. Jeschke, K. Muthukumar, M. Tomić, F. Salvat-Pujol, R. Valenti, M.V. Kaisheva, I. Zizak and T. Chatterji, Proc. Nat. Acad. Sci. 111, 5106 (2014).
- (19) J. M. Besson, R. J. Nelmes, G. Hamel, J. S. Loveday, G. Weill, and S. Hull, Physica B 180&181, 907 (1992).
- (20) S. Klotz, Th. Strässle, G. Rousse, G. Hamel and V. Pomjakushin, Appl. Phys. Lett. 86, 031917 (2005).
- (21) R. B. von Dreele and A. C. Larson, Los Alamos National Laboratory Report No. LAUR 86-746, 1986
- (22) G. Kresse and J. Hafner, Phys. Rev. B 47, R558 (1993); G. Kresse and J. Furthmüller, Phys. Rev. B 54, 11169 (1996).
- (23) J. P. Perdew, K. Burke, and M. Ernzerhof, Phys. Rev. Lett. 77, 3865 (1996).
- (24) S. L. Dudarev, G. A. Botton, S. Y. Savrasov, C. J. Humphreys, and A. P. Sutton, Phys. Rev. B 57, 1505 (1998).
- (25) P. Vulliet, J.P. Sanchez, D. Braithwaite, M. Amanowicz and B. Malaman, Phys. Rev. B 63, 184403-1 (2001).
- (26) Y. Mita, Y. Ishida, M. Kobayashi and S. Endo, Acta Physica Polonica A 113, 617 (2008).
- (27) O. K. Andersen, and T. Saha-Dasgupta, Phys. Rev. B 62, R16219 (2000).
- (28) O. K. Andersen, W. Klose, and H. Nohl, Phys. Rev. B 17, 1209 (1978).
- (29) P. Mahadevan, N. Shanthi, and D. D. Sarma, Phys. Rev. B 54, 11199 (1996).