Unveiling of Bragg glass to vortex glass transition by an ac driving force in a single crystal of Yb3Rh4Sn13
Abstract
We present here some striking discrepancies in the results of ac and dc magnetization measurements performed in a single crystal of low superconductor, Yb3Rh4Sn13. Fingerprint of a transition from an ordered vortex lattice a la Bragg glass (BG) phase to a partially-disordered vortex glass (VG) like phase gets unearthed under the influence of an ac driving force present inevitably in the isothermal ac susceptibility () measurements. In contrast to its well - known effect of improving the state of spatial order in the vortex matter, the ac drive is surprisingly found to promote disorder by assisting the BG to VG transition to occur at a lower field value in this compound. On the other hand, the isothermal dc magnetization (–) scans, devoid of such a driving force, do not reveal this transition; they instead yield signature of another order-disorder transition at elevated fields, viz., peak effect (PE), located substantially above the BG to VG transition observed in runs. Further, the evolution of PE feature with increasing field as observed in isofield ac susceptibility () plots indicates emergence of an ordered vortex configuration (BG) from a disordered phase above a certain field, ( kOe). Below , the vortex matter created via field - cooling (FC) is found to be better spatially ordered than that prepared in zero field - cooled (ZFC) mode. This is contrary to the usual behavior anticipated near the high-field order-disorder transition (PE) wherein a FC state is supposed to be a supercooled disordered phase and the ZFC state is comparatively better ordered.
pacs:
74.25.Op, 74.25.Ha, 74.25.DwI Introduction
In the context of the mixed state of a type - II superconductor, the seminal discovery key-1 ; key-2 of a well-ordered thermodynamic phase, viz., Bragg glass (BG) exhibiting Bragg’s reflections, and its possible transition(s) key-3 to a disordered phase devoid of Bragg’s reflections had lead to a generic vortex phase diagram key-4 applicable to almost all pinned superconductors. Owing to the possibility of a sudden proliferation of dislocations on progressively increasing the magnetic field at a constant temperature, the quasi - long range ordered BG phase is anticipated key-1 ; key-2 to transform first into a multi - domain (partially disordered) vortex glass (VG) phase. Such a transition usually reflects as a second peak in (isothermal) magnetization (–) loops, termed as the second magnetization peak (SMP) anomaly key-5 ; key-6 ; key-7 ; key-8 ; key-9 ; key-10 ; key-11 . Thereafter, at elevated fields closer to the upper critical field (), there occurs another anomaly, known as the quintessential peak effect (PE) phenomenon key-3 ; key-9 ; key-10 ; key-12 ; key-13 ; key-14 ; key-15 ; key-16 ; key-17 ; key-18 in field/temperature variation in critical current density, . The PE is argued key-12 to signal the collapse of the elasticity of an ordered vortex lattice at a rate faster than the pinning force density near .
Although theoretical treatment related to the BG to VG transition exists in the literature (for example, as in Ref. key-2 ), however, the experimental tools, particularly those employed to explore the bulk pinning properties, such as, the dc magnetization (–) measurements do not always capture this transition. Therefore, in the context of vortex phase diagram studies, it is tempting to ask a question- Is the BG to VG phase transition generic? If it is so, then this anomaly must get exposed in the – space of all pinned superconductors, possessing a certain amount of quenched disorder. To address this issue, we have investigated via detailed magnetization measurements, a low superconductor Yb3Rh4Sn13, which has so far been reported key-14 ; key-15 ; key-16 to display only the PE phenomenon. A claim of the presence of SMP anomaly (or its counterpart) in this compound has so far not been made by anyone. We have now found that the BG to VG (akin to SMP anomaly) transition in this compound gets exposed prior to the onset of PE under the influence of an ac driving force present in the (isothermal) ac susceptibility scans (). Counter-intuitively, shaking of the vortex array by an ac drive in the present study has been seen to promote the spatial disordering in the vortex matter by assisting the BG to VG transition process. This observation is in complete contrast to the usual role of an ac driving force, which is to improve the state of spatial order in multi - domain vortex matter as reflected key-17 by the enhanced brightness of the Bragg spots in the field-temperature phase space prior to crossover to the PE region in the vortex phase diagram. Another interesting aspect of the present study is a revelation of the inequality at lower fields (below a characteristic field, kOe) . This amounts to stating that the vortex matter created in the field - cooled mode (FC) below exhibits better spatial ordering than that obtained in the zero field - cooled manner. This feature also is in sharp contrast to the behavior key-19 ; key-20 ; key-21 ; key-22 seen at the higher fields, where one encounters order - disorder transition (a la PE phenomenon). The vortex matter created via field - cooling is expected to be spatially more disordered (than the ZFC state) due to supercooling of an amorphous vortex matter below the PE region. We present evidences that signifies a crossover regime from an ordered BG phase into a disordered amorphous phase while reducing the field.
II Experimental details
Single crystals of Yb3Rh4Sn13 have been grown by tin flux method key-23 (23). The specimen chosen for the present study is platelet shaped, with a planar area of mm2 and thickness of mm. The superconducting transition temperature () of this crystal is found to be nearly K. Magnetization data, both ac as well as dc, were recorded using the same instrument, viz., Superconducting Quantum Interference Device - Vibrating Sample Magnetometer (SQUID - VSM, Quantum Design Inc., USA). The magnetic field was directed along the crystalline [110] axis, with a possible error in the alignment to be within . The demagnetization factor in this orientation is expected to be small as the field is applied in the plane of the thin platelet, i.e., normal to the smallest dimension (thickness) of the sample. In the dc measurements, we kept the amplitude of vibration of the sample to be small ( mm) so as to minimize the field-inhomogeneity along the scan length. During the ac susceptibility measurements (), an ac field of amplitude Oe and frequency Hz was superimposed on the applied dc field.
III Results
III.1 Isothermal dc – loops: Manifestation of the peak effect phenomenon
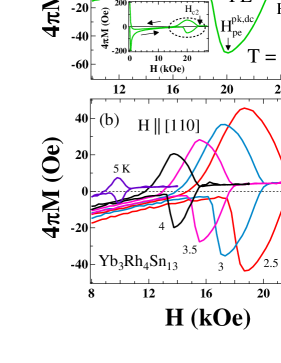
The inset panel of Fig. 1(a) displays the first two quadrants of an isothermal dc magnetization hysteresis loop (–) obtained at K for field applied parallel to the [110] plane of Yb3Rh4Sn13 crystal. The curve can be seen to be hysteretic between the forward () and the reverse () sweeps of the magnetic field, as expected for a pinned type - II superconductor. However, there exists an unusual enhancement in the hysteresis width () prior to , as apparent from the encircled portion of the curve. A magnified view of this portion is displayed on an expanded scale in the main panel of Fig. 1(a). Using a prescription of the Bean’s Critical State Model key-24 (24), Fietz and Webb have shown key-25 (25) that the hysteresis width () can be taken as a measure of the critical current density, . Therefore, the enhancement in reflects an unusual increase in a little below , which can be identified as the PE phenomenon. The onset field () and the peak field () of the PE stand located in the main panel of Fig. 1(a). The merger of and beyond the bubble feature identifies the irreversibility field ().
We show in Fig. 1(b), the fingerprint of PE feature at different temperatures, as indicated. On increasing the temperature, a systematic decrease in the onset and the peak field values of the PE is well apparent. The decrease in and with , nearly following the variation of with , is a characteristic feature of the PE phenomenon. The order - disorder transition pertaining to PE has been argued to have first - order character, as was well evident in the results of small angle neutron scattering study in a low superconductor Nb key-17 and those of scanning Hall probe microscopy in 2H-NbSe2 key-26 (26).
III.2 Isothermal ac susceptibility responses: Identification of an additional anomaly in conjunction with the PE phenomenon
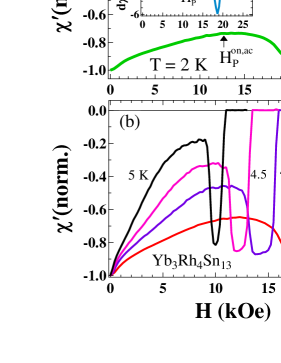
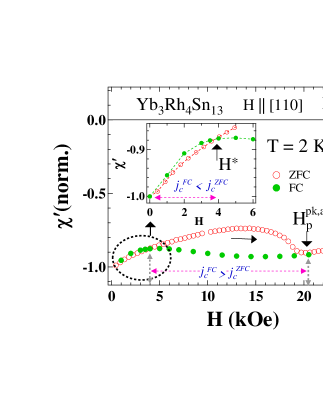
To investigate further the order - disorder transition(s) in the vortex matter, we recorded the isothermal ac susceptibility () responses as shown in Fig. 2. The sample was initially cooled - down to a chosen temperature in (near) zero field and thereafter the data were recorded while ramping the field to higher values. The || values at K can be seen to fall monotonically with increasing field until about a certain field, marked as ( kOe, cf. main panel of Fig. 2(a)). Above , a broad (anomalous) dip - like feature encompassing a large field interval (i.e., ) can be noticed. Note that the identification of onset field () of this dip feature was made possible by locating the first zero - crossing in the derivative plot of as displayed in an inset panel of Fig. 2(a). The second zero - crossing in identifies the peak position (marked as ) of the anomalous variation in across the dip region. We recall here that the value reflects through the two relations key-27 (27), (i) for and (ii) if , where and are size and geometry dependent factor, is the amplitude of the ac field and is the ac field for full penetration. Following equation (i), the anomalous variation in above in Fig. 2(a) amounts to an unusual increase in otherwise monotonically decreasing . Similar anomalous behaviour in can also be observed at different temperatures as illustrated in Fig. 2(b). While the dip feature remains quite broad at lower temperatures, one can note that the width of this anomalous region gets substantially reduced on higher temperature side. For example, the dip in at K is observed to be much sharper with a narrow transition width (of nearly kOe) prior to approaching which, following equation (ii), amounts to a rapid increase in echoing the characteristics of the quintessential PE phenomenon.
A comparison of data presented in Fig. 2(a) with that of the – loop shown in Fig. 1(a), tells us that the peak field value ( kOe) of the anomaly observed in the former is nearly the same as the corresponding peak field value () of the PE observed at the same temperature in the latter. However, if we seek the analog of onset field of the anomaly seen in ac , viz., ( kOe, Fig. 2(a)), we find that no anomalous feature stands depicted at this field value in the dc – loop (cf. Fig. 1(a)). This implies an additional anomaly has got unearthed (at ) in the scans in the specimen of Yb3Rh4Sn13 which is not observed in its – runs. To seek the rationalization of this discrepancy in the ac and dc magnetization data, one can consider the presence of an ac driving force inevitably superimposed on the dc field during the runs as an important difference between the two sets of measurements. Two important factors in conjunction, viz., (i) the shaking effect of an ac driving force on the vortex matter and, (ii) driving effect due to a continuous ramping of the dc magnetic field, may be acting as a combined driving force leading to the triggering of additional anomaly in runs. To shed some more light onto this assertion, it became tempting to explore the isofield ac susceptibility responses, where an effect due to the ramping of magnetic field would not be present. These are described ahead.
III.3 Isofield ac susceptibility responses: identification of the PE phenomenon
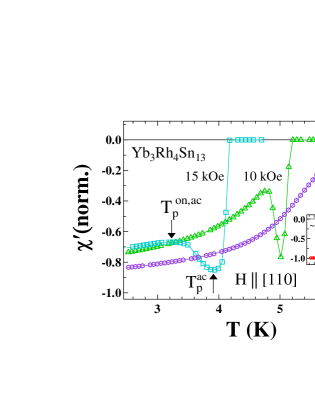
Figure 3 displays the temperature dependences of the in - phase ac susceptibility () obtained at various fixed dc fields. The sample was initially cooled down to K in (nominal) zero field, a desired field was then applied and the data were recorded while warming up to higher temperatures (). The zero - field superconducting transition temperature, identified via the onset of diamagnetic response is found to be about K (cf. inset panel of Fig. 3). Fingerprint of the PE feature identified by a dip - like characteristic can be observed in all the curves shown in the main panel of Fig. 3. At kOe, the dip in is found to be less prominent, however, it evolves into a sharp (negative) peak at higher field values (see, e.g., response in kOe). On further increasing the field to kOe, the PE region becomes broad, which is apparent from a wider gap between the onset () and the peak () temperatures of the PE marked in the main panel of Fig. 3. Such a broadening seen in the PE feature at higher fields may be ascribed to effects of an enhancement in ’effective pinning’ with field, as articulated by Giamarchi and Le Doussal key-1 ; key-2 and elucidated in a crystal of low superconductor 2H - NbSe2 by Banerjee et al., key-21 .
A lesser developed (PE) anomaly at lower field value ( kOe) suggests the possibility of a lesser ordered vortex matter emerging at that end as well. Such a trend is consistent with the notion that an ordered vortex lattice (Bragg glass) undergoes a transition into a disordered phase on lowering the field key-28 (28, 29).
Across the field interval from about kOe to kOe, the vortex matter seems to evolve into a better spatially ordered (Bragg glass) phase, as is evidenced by a sharp PE feature at kOe in Fig. 3.
III.4 – phase diagram
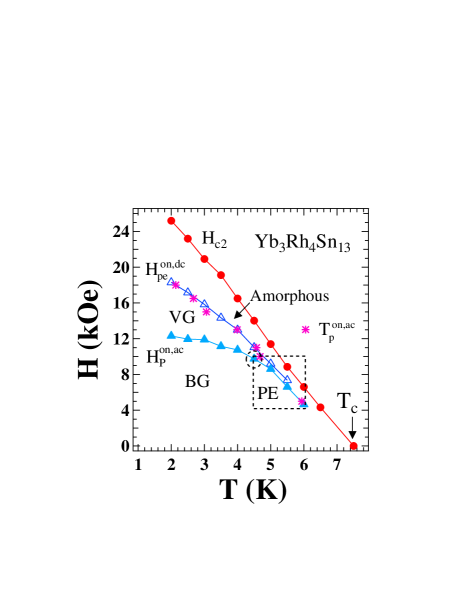
It is instructive to compare the results of ac and dc magnetization data of Figs. 1 to 3. For this purpose, we present in Fig. 4, a – phase diagram of Yb3Rh4Sn13, which comprises the field/temperature values corresponding to the onset positions of the anomalies seen in Figs. 1 to 3. The following features in this phase diagram are noteworthy:
1. The onset field values () of the PE (open triangles) acquired from the – data (Fig. 1) fall smoothly with the increase in temperature, a trend similar to the line.
2. The corresponding onset field values ( shown by closed triangles) of the anomaly observed in plots (Fig. 2), however, do not coincide with the onset position () of the PE over a significantly large portion of the – space (i.e., K). Here, the line stays substantially below the line. Moreover, values exhibit a weaker temperature dependence at temperatures below K unlike the faster temperature dependence seen in case of . The two onset field lines, and , come closer to each other only in the boxed region (i.e., at K and kOe kOe) and show identical temperature dependence.
3. The discrepancy in the phase diagram (Fig. 4) pertaining to the location of onset fields of the anomalies seen in the (isothermal) – and data prompts the need to take into consideration the results of isofield scans (Fig. 3) as well. For this purpose, we have plotted in the phase diagram the onset temperatures () of the PE (shown by stars) obtained from scans. It is curious to note that the values fall almost on the onset field () line of the PE transition. We draw an important inference here that the results of isothermal dc – loops and the isofield ac scans predict the onset of the PE anomaly at nearly the same phase boundary, i.e., (, ) line.
Clearly, there exists an additional anomaly (apart from the PE) located deeper (at ) in the mixed state of Yb3Rh4Sn13, which has got unveiled only from the outcomes of the data. The other two measurement techniques (viz., the – and scans), on the other hand, reveal the fingerprints of only one kind of anomaly, i.e., the PE. This corroborates our previous assertion that both an ac driving force as well as the dc magnetic field ramping together trigger the said additional anomaly well below the onset of PE (these two factors not being present together during the individual dc – and ac runs).
The lowest field down to which the PE could be discernible in Fig. 4 is nearly kOe. Since there is hardly any fingerprint of PE feature below this value, we could surmise that the vortex matter there may be disordered. This proposition is explored further via the thermomagnetic history - dependent magnetization measurements.
III.5 Thermomagnetic history dependence in : FC state is more ordered than the ZFC at low fields
Figure 5 displays the shielding responses () obtained at K for the system prepared in two different histories, viz., zero field - cooled (ZFC) and field - cooled (FC) modes. The isothermal data in the ZFC mode (open circles) are the same as that presented in Fig. 2(a). In the FC case, the sample was first cooled from normal state (), in the presence of a certain applied field () down to K and a given value was recorded. Thereafter, the sample was warmed up again to a higher () and the same procedure was followed for recording another value in a different cooling field. A collation of such data at K is illustrated (closed circles) in Fig. 5. Three different field intervals can be identified; (I) Across the range, kOe , the ZFC and FC curves can be seen to be well separated with the latter possessing more diamagnetic values than the former. Following equations (Ref. key-27 (27)) (i) and (ii) , a more negative implies larger . Therefore, in the field interval kOe , the FC state exhibits a higher than that in the ZFC state (i.e., ). As per a description of Larkin - Ovchinnikov collective pinning theory key-30 (30, 31) for weakly-pinned superconductors, relates inversely to the volume () of a domain within which the vortices are collectively pinned and remain well correlated. Therefore, a higher amounts to a smaller , and hence signifies a more (strongly - pinned) disordered vortex matter. (II) The history - dependence in tends to cease above as we observe the two curves to overlap there. This is in line with the understanding that the vortex matter above the peak field of the PE is generally believed to be ’disordered in equilibrium’ key-17 . (III) The ZFC and FC curves appear to overlap at low fields ( kOe) as well, as apparent from the two sets of data points in the encircled portion of (cf. main panel of Fig. 5). However, a closer examination of the two curves in this region on an expanded scale (see inset panel of Fig. 5) reveals slightly less diamagnetic values (at a given ) for the FC state than that for the ZFC mode, which implies the reversal of the above inequality; i.e., for kOe. We have marked this crossover field value ( kOe) as in the inset panel of Fig. 5. Such an inequality () below is found to be very robust as it can be observed at other temperatures as well (all data not shown here but the values at different temperatures have been displayed in the – phase diagram as shown ahead in Fig. 8).
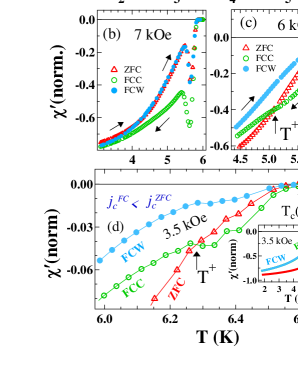
The – phase space region below was further explored via isofield scans recorded in different modes, viz., zero field - cooled (ZFC), field - cooled cool - down (FCC) and field - cooled warm - up (FCW) runs as depicted in Fig. 6. The sample was cooled in (near) zero field from the normal state down to K, and then a desired magnetic field was applied. Thereafter, the data were obtained (marked as ZFC in Fig. 6), while warming the sample to higher . Following this, data were again recorded while cooling the sample down to K (marked as FCC) in the presence of the same applied field, and thereafter while warming it towards the normal state (marked as FCW). At kOe (Fig. 6(a)), the shielding response is found to be less diamagnetic for the ZFC case than that observed for the FCC and FCW modes (i.e., at all temperatures). This implies that the vortex matter created in the ZFC mode is better spatially ordered among the three modes which is consistent with the observations made at this field value in Fig. 5. At a lower field ( kOe), the ZFC curve nearly overlaps with the FCW; these two curves stay less diamagnetic than the FCC for K (cf. Fig. 6(b)). On reducing the field further to kOe (Fig. 6(c)), the FCW curve can now be seen to be the least diamagnetic amongst the three curves at all temperatures. Further, there is an unusual intersection of ZFC and FCC curves at a certain temperature marked as , below which the ZFC is now more diamagnetic than the FCC and FCW curves. The ZFC curve at a lower field of kOe (see inset panel of Fig. 6(d)) can be seen to be more diamagnetic and well separated from the other two (FCC and FCW) curves. This would imply the inequality , which, in turn, suggests that the vortex matter created in the ZFC mode is more disordered than that created in the FC mode. This situation is the reversal of that depicted in Fig. 6(a) and is in agreement with the conclusion drawn from the history - dependent responses below kOe (cf. Fig. 5). An expanded portion of plots at kOe in the main panel of Fig. 6(d) shows that the fingerprint of PE ceases to exists in the ZFC mode, whereas a tiny modulation can still be noticed across in the case of FCC and FCW runs. This suggests that the vortex state created in ZFC manner at kOe is disordered to such an extent that any order - disorder vortex phase transition may not be identifiable in the temperature-dependent warm-up measurements. On the other hand, at the same field value ( kOe), a nascent signature a la PE observed in FCC and FCW modes suggests that vortex matter is comparatively better ordered when created in the FC mode at kOe.
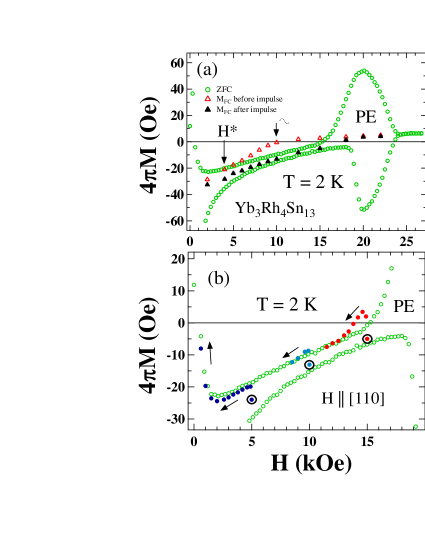
Another demonstration of a more ordered FC state (than the ZFC state) at lower field values is apparent from the results of thermomagnetic history - dependent dc – measurements, as illustrated in Fig. 7. The – curve shown by open circles pertains to the usual hysteresis loop obtained in the ZFC mode at K. Magnetization data recorded in the FC mode (), i.e., after cooling the sample from a higher () down to K in the presence of different chosen field values have also been displayed by open triangle data points in Fig. 7(a). If we associate the values to the equilibrium (reversible) magnetization () and ignore the contribution due to bulk currents that can get set up due to a gradient in macroscopic field () (as in the case of ZFC), then, as per equation key-25 (25), the data are supposed to fall in the middle of the ZFC envelope loop (as, for example, evident in Ref. key-10 ). Figure 7(a) depicts an unexpected scenario, wherein the data points stay outside the envelope hysteresis loop for field () values in the interval, kOe kOe. We can try to rationalize this using a model due to Clem and Hao key-32 (32) which accounts for the FC magnetization of a type - II superconductor when a gradient in macroscopic field gets established as a consequence of flux expulsion during the FC mode. In such a situation, the values deviate from (ideal case of no flux - pinning). This deviation of FC magnetization from values is indeed anticipated to be governed by the strength of bulk pinning at a given field; the extent of deviation is more (less) for stronger (weaker) pinning strength () (see Fig. 5 in Ref. key-32 (32)). The values (see open triangles, Fig. 7(a)) falling outside the envelope loop in the present case, for kOe are due to a larger value associated with the vortex matter created in the FC mode and the flux density gradient key-32 (32) that gets set-up while field - cooling. Note that below kOe (close to kOe), the FC state seems to have a lower value (better ordered) as the value here remains well within the envelope (i.e., nearer to ).
As a further experimentation, on each occasion, after a FC state was created at a chosen field value, we momentarily perturbed it with an ac field impulse of amplitude Oe at a frequency of Hz (applied for about seconds). It is curious to note that the magnetization recorded after the impulse treatment (closed triangles data points in Fig. 7(a)) fall well within the envelope loop. It appears as if the magnetization response of a FC state after perturbation by an impulse conforms to the anticipated respective equilibrium value () (closed triangles data points) located in the middle of the ZFC envelope loop. The imposition of an ac field impulse results in the reconfiguration of an unperturbed FC state into state, comparison of whose value with that of the corresponding ZFC state can be very instructive. We thus recorded the ’FC minor hysteresis loops’. Figure 7(b) shows the magnetization curve obtained while reducing the dc field to zero after the (perturbed) FC states were created (encircled) at kOe, kOe and kOe. The initial magnetization value recorded while decreasing the field from kOe undershoots the ZFC envelope, and the magnetization curve thereafter traverses a path that remains within the envelope loop as the field is ramped down to the zero value. Taking cue from the linear relation between hysteresis width and key-25 (25), the (perturbed) FC state is reckoned to have a lower value than that in the ZFC for fields below . This observation fortifies the inferences drawn from data in Figs. 5 and 6. At kOe, the magnetization data, while reducing the field, first overshoots the ZFC envelope though marginally, and thereafter it retraces the reverse leg () of the ZFC magnetization curve. It can be argued that the FC state here exhibits value slightly higher than that in the corresponding ZFC states. A significant overshooting of the ZFC envelope loop is witnessed at a higher field of kOe, which indicates a larger value for the FC state than that created in the ZFC mode. Note that the field value of kOe lies in the anomalous region, of the – space at K (Fig. 4) which, as discussed in section - IV ahead, is ’partially disordered in equilibrium’ as the multi-domain VG state.
IV Discussion
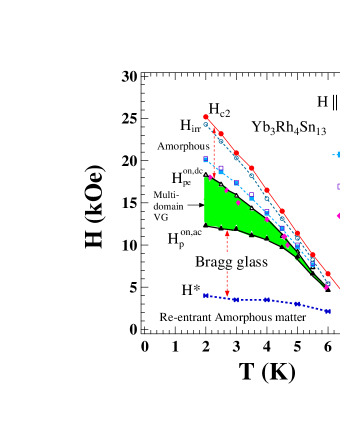
The magnetization measurement techniques (both ac and dc) employed in the present work have lead to new revelations in Yb3Rh4Sn13 which have been summarized in the form of a modified – phase diagram in Fig. 8. These include, (i) the occurrence of a broad anomaly located deeper in the mixed state triggering at line as seen in the curves (Fig. 2), (ii) identification of onset position of the PE at line as obtained from both the dc – (Fig. 1) and the ac (Fig. 3) plots, and (iii) a characteristic line extracted from Fig. 5, below which a vortex matter created in the FC mode is somewhat more ordered than that obtained in the ZFC manner. Following a description of L - O theory key-30 (30, 31), we argue that the anomaly in (Fig. 2) reflects a shrinkage in as and hence, can be termed as an order - disorder transition in the vortex matter. Note that the L - O theory is well applicable for weakly - pinned superconductors as in the present case of Yb3Rh4Sn13 (ratio of depinning and depairing current densities is of the order of ). The location of line deeper in the mixed state and its weak temperature - dependence outside the boxed region in Fig. 4 can be argued to relate to the disorder - induced transition key-1 ; key-2 ; key-6 ; key-7 of a quasi-ordered (elastic) vortex lattice a la BG phase to the dislocation-mediated (multi - domain) VG phase. Note that the peak field of the anomalous variation in as reflected in dc – and ac plots, viz., (closed squares) and (open squares), is consistent, as the two sets of data points extracted from two different measurements can be seen to be overlapping in Fig. 8. This would imply that the complete amorphization of the vortex matter (which is generally believed to occur at peak field of the PE key-21 ) occurs at the same field/temperature value while performing measurements via ac and dc magnetization techniques.
It has been shown earlier that the annealing effects on the vortex matter, produced either by an ac driving force key-17 ; key-33 (33) or by repeated cycling of the dc magnetic field key-34 (34, 35), eliminate either partly or completely a (metastable) disordered vortex phase yielding an ordered vortex configuration. Also, the residual presence of a disordered (metastable) vortex phase usually governs the onset position of the order-disorder (PE) transition(s) key-21 ; key-29 (29, 36). As a usual behavior, the onset position of the PE shifts to higher field values after the annealing of (disordered) vortex phase, whereas the same moves to lower fields when the amount of quenched disorder is larger key-21 ; key-29 (29). Surprisingly, the shaking effect of an ac driving force appears to be counterintuitive in the present study, as it promotes the spatial disordering of the vortex matter rather than its usual role of improving the state of spatial order. This is well apparent by the (early) occurrence of an order - disorder transition at line (cf. Fig. 8) in the runs which involve the ac drive. In the absence of an ac driving force as in dc – scans, the onset of order-disorder transition (PE) is seen at higher fields; values in Fig. 8 are located significantly above the BG to VG transition () line. If one assumes that the shaking effect on the vortex array by an ac drive results in the lowest equilibrium-like state of the system (as in Ref. key-17 ) under given circumstances, then the region bounded by the phase lines, and , in Fig. 8 can be accepted as “disordered in equilibrium” in the form of multi-domain vortex glass phase. The present findings echo similar assertions made recently by us key-18 in another study in a single crystal of a low superconductor, Ca3Ir4Sn13. However, in that study in Ca3Ir4Sn13, a distinct demarcation between the BG to VG transition line and the locus of the onset of the PE anomaly in its vortex phase diagram was not apparent, which has now been clearly sorted out in the phase diagram of Yb3Rh4Sn13.
The nature of BG to VG transition had been argued to be of first - order key-37 (37) in a high superconductor. To fortify this proposition, we may emphasize that the region bounded between and in Fig. 8 which is shown from the data to be disordered in equilibrium is indeed an ordered vortex phase when viewed from the outcomes of the dc – measurements. Therefore, vortex phase in this region can be treated as a superheated ordered BG phase. This attests the first - order nature of the BG to VG transition in a low superconductor.
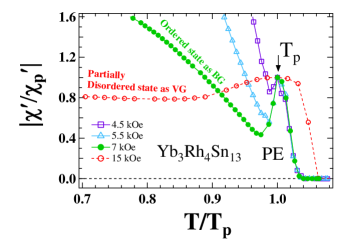
The change in magnetic field tunes the inter-vortex spacing which, in turn, can influence the balance between the strength of vortex pinning and the (elastic) interactions between the vortices. As a result, the extent of spatial ordering/disordering in the vortex matter may vary in different regions of the – phase space. Further, an enhancement in effective pinning at a given field value can give rise to a qualitative change in the evolution of the size of the Larkin domain key-30 (30, 31), as had been experimentally demonstrated key-38 (38) via the evolution of PE feature in the isofield measurements in crystal(s) of 2H-NbSe2. Motivated by this, we shall now examine how the PE feature evolves with magnetic field in the case of our crystal of Yb3Rh4Sn13. We show in Fig. 9 the normalized || plots ( corresponds to value at peak position of PE where vortex matter is most disordered for a given inter-vortex spacing and the underlying quenched random disorder) against the reduced temperature , ( is peak temperature of PE obtained in the ZFC mode for various fixed fields). The PE feature remains absent at fields below kOe (data not shown here), which may be because of a disordered vortex matter prevailing there. Note that the larger inter-vortex spacings at low flux density results in weaker interaction between the vortices to counter disordering influence of the pinning centres. The vortex configuration created at low fields ought to be highly disordered akin to the reentrant amorphous vortex matter anticipated in earlier studies key-39 (39, 40, 41, 42). With the increase in field, the interaction effects strengthen and consequently, a sparse disordered vortex configuration can progressively change into an ordered one, as has been demonstrated earlier in Refs. key-43 (43, 44). This is apparent from Fig. 9 by the appearance of a tiny PE feature firstly at kOe. A more pronounced signature of PE occurring at kOe suggests further improvement in the spatial ordering of vortex matter with the increase in field prior to the onset of PE. At a higher field of kOe, there emerges a very well developed PE feature, which is indicative of a well-ordered vortex (BG) phase prevailing prior to the onset of the PE transition at this field value. A different scenario is, however, depicted at a higher field, kOe, wherein the order-disorder transition can be seen to be much broader. We surmise that the vortex phase prior to the order-disorder transition at this field value is partially disordered (a la multi-domain VG phase) so that any order-disorder transition would reflect a lesser shrinkage in (as compared to that at lower fields) or equivalently, lesser increment in key-30 (30, 31) associated with this state. In all, the || plots of Fig. 9 have lead us to infer that a disordered vortex phase at low field end ( kOe) transforms into an ordered one (BG phase) with increase in field. A further enhancement in field may transform an ordered vortex phase (BG) into a partially disordered (VG) state prior to the onset of PE.
It is useful to recall now a recent study key-45 (45) employing the small angle neutron scattering (SANS) technique in another crystal of Yb3Rh4Sn13 (which would typically have different amount of quenched random disorder) providing evidences at microscopic level in support of our experimental results. In the SANS study, the evolution of spatial order in vortex matter with vortex lattice spacing () has been well-depicted by plots of field-dependences of the normalized correlation lengths (both longitudinal, and transversal, ) as well as their ratio () (see Fig. 3 in Ref. key-45 (45)). These lengths relate to the longitudinal and radial dimensions of the volume within which the flux lines remain correlated. The full width at half maximum of the rocking curves in longitudinal and transverse directions reflecting the apparent quality of the spatial order and that of the Bragg peaks remains nearly flat in the field interval (cf. Fig. 2 in Ref. key-45 (45)). The normalized transversal correlation length () starts decreasing more rapidly as the field reduces below kOe key-45 (45). Near kOe, where we just start to observe the PE feature in || scans in our sample, the said ratio has a value key-45 (45). This could imply that when the quality of spatial order in the vortex matter gets more compromised (i.e., ), the PE feature would not surface up. The longitudinal correlation length was seen key-45 (45) to be nearly fifty times longer than . It has been argued key-45 (45) that the ratio reveals field-induced changes in the parameter , where and are respectively, the tilt and shear modulii of hexagonal vortex lattice. This ratio in their sample remains nearly constant between kOe and kOe and starts to fall above it and the rate of decrease becomes very steep above kOe (see inset of Fig. 3(a) of Ref. key-45 (45)). Such a trend could be interpreted that the quality of spatial order undergoes a change above about kOe and the elasticity of the vortex lattice plummets above kOe. In the context of our sample, this could rationalize that BG to VG transition happens above kOe (see Fig. 8). The inset panel in Fig. 3(b) of Ref. key-45 (45) shows that the simulated (normalized) vortex-vortex interaction in their sample does not continue to monotonically rise with magnetic field as the inter-vortex spacing progressively decreases with increase in field. The vortex-vortex interaction (for the Yb3Rh4Sn13 crystal investigated in Ref. key-45 (45)) reaches a maximum value near kOe and starts to decrease above about kOe thereby implying that the onset of this decrease is a consequence of notion of enhancement in effective pinning at large field values. Near kOe, the value of the normalized vortex-vortex interaction force for this compound is same as at about kOe key-45 (45). The rapid decrease in this parameter below kOe reflects the dominance of pinning in the field domain of reentrant amorphous state (cf. Fig. 8).
In our present study, the || plots of Fig. 9 summarize the evolution in the spatial order of vortex matter with magnetic field, which ties up well with the results of SANS study key-45 (45). The extent of spatial ordering/disordering in the vortex matter at a given field can be quantified by the ratio of || value just prior to the PE and that at the peak position (see in Fig. 9) of the PE. Note that the correlation length ought to be minimum at the peak () of the PE and maximum (for a well ordered vortex lattice) just before the PE. In Fig. 9, the said ratio of || at onset and peak positions of the PE can be seen to be increasing smoothly with increasing magnetic field for , which is consistent with the variation of correlation lengths with field for kOe, as anticipated in Ref. key-45 (45). This would imply that a very well-ordered BG phase emerges nearly at kOe from a disordered state prevailing below kOe. Further, at an elevated field ( kOe), this ratio decreases substantially as if a transition from the BG phase into a VG like phase has occurred there.
In the end, we draw attention towards the thermomagnetic history effects investigated at lower fields (Figs. 5-7). It is customary to witness a more disordered FC state than the ZFC in the vicinity of the PE phenomenon key-19 ; key-20 ; key-21 ; key-22 . However, the history-dependent magnetization behavior at lower fields () studied here in Yb3Rh4Sn13 have revealed that the vortex matter in the ZFC mode is more disordered than that in the FC case. The following scenario seems plausible to explain this feature. In the ZFC mode, the injection of vortices at high velocities into a superconducting specimen is influenced by surface barriers and edge effects key-46 (46, 47) such that the vortices eventually penetrate the sample through the weakest point of the barrier. Inside the superconducting specimen, the vortices moving in bundles get randomly pinned at respective pinning sites such that the inter-vortex spacing is non-unique which leads to a non-uniform distribution of the flux-density. As mentioned earlier, the vortices are well separated at lower fields and therefore, the (elastic) interactions between them remain weak resulting in a stronger pinned (disordered) vortex configuration in the ZFC mode. Although the vortex matter created in the FC mode also remains disordered at lower fields, however, the vortices in this mode nucleate more uniformly as they remain oblivious to disordering effects of the surface barriers and the non-uniform injection through edges, etc. Therefore, at lower fields, the vortex configuration in FC mode is less disordered than in the case of ZFC. At higher fields, as the vortices get closer to each other and hence, the interaction effects become dominant yielding a better spatial ordering even during the moving state of creation of vortex matter in the ZFC mode. On the other hand, during the FC mode, the vortex matter has to cross the PE boundary in the – phase space which results in supercooling the disordered vortex matter prevailing at the peak position of the PE anomaly. Thus, at higher fields, the vortex matter created in the ZFC mode is more spatially ordered than that in the FC mode.
V Conclusion
We have investigated via magnetization measurements, a weakly - pinned single crystal of a low superconductor, Yb3Rh4Sn13. The present results have lead to the identification of BG to VG transition line and sketch of a characteristic field () line in the – phase space of this compound. Surprisingly, the SMP transition like phase boundary has been unearthed under the combined influence of an ac driving force and a continuous magnetic field sweeping involved in the (isothermal) ac susceptibility () measurements. This transition was, however, not observed in the (isothermal) dc – loops and the temperature - dependent ac susceptibility scans (). The latter two modes of measurements yield signature of only the quintessential PE anomaly signaling the collapse of elasticity of vortex solid at higher fields. An apparent demarcation between the domain of SMP like transition and the onset of PE anomaly has been made in the vortex phase diagram of Yb3Rh4Sn13. The results presented in our specimen answer in affirmative the question of generic nature of BG to VG transition in a pinned superconductor. These also find supports from another experimental study key-45 (45) at microscopic level in a sample of the same compound. In the low field region (), the vortex matter is construed to be highly disordered. Here, a vortex state created in the FC mode is found to be more ordered than that obtained in the ZFC mode.
Acknowledgements.
Santosh Kumar would like to acknowledge the Council of Scientific and Industrial Research, India for the grant of the Senior Research Fellowship. Santosh Kumar wishes to thank Ulhas Vaidya for his help and assistance in the use of SVSM system in TIFR, Mumbai in the initial phase of work.References
- (1) T. Giamarchi and P. Le. Doussal, Phys. Rev. Lett. 72, 1530 (1994).
- (2) T. Giamarchi and P. Le. Doussal, Phys. Rev. B 52, 1242 (1995).
- (3) S. S. Banerjee, A. K. Grover, M. J. Higgins, Gutam I. Menon, P. K. Mishra, D. Pal, S. Ramakrishnan, T. V. Chandrasekhar Rao, G. Ravikumar, V. C. Sahni, S. Sarkar, C. V. Tomy, Physica C 355, 39 (2001) and references therein.
- (4) T. Giamarchi and P. Le. Doussal, Phys. Rev. B 55, 6577 (1997).
- (5) M. Daeumling, J. M. Seuntjens and D. C. Larbalestier, Nature (London) 346, 332 (1990).
- (6) B. Khaykovich, E. Zeldov, D. Majer, T. W. Li, P. H. Kes and M. Konczykowski, Phys. Rev. Lett. 76, 2555 (1996).
- (7) B. Khaykovich, M. Konczykowski, E. Zeldov, R. A. Doyle, D. Majer, P. H. Kes and T. W. Li, Phys. Rev. B 56, R517 (1997).
- (8) T. Nishizaki, N. Kobayashi, Supercond. Sci. Technol. 13, 1 (2001).
- (9) D. Pal, S. Ramakrishnan, A. K. Grover, D. Dasgupta, B. K. Sarma, Phys. Rev. B 63, 132505 (2001).
- (10) S. Sarkar, D. Pal, P. L. Paulose, S. Ramakrishnan, A. K. Grover, C. V. Tomy, D. Dasgupta, Bimal, K. Sarma, G. Balakrishnan, D. McK Paul, Phys. Rev. B 64, 144510 (2001).
- (11) D. Giller, B. Kalisky, I. Shapiro, B. Ya. Shapiro, A. Shaulov, Y. Yeshurun, Physica C 388, 731 (2003).
- (12) A. B. Pippard, Philos. Mag. 19, 217 (1969).
- (13) M. J. Higgins, S. Bhattacharya, Physica C 257, 232 (1996) and references therein.
- (14) H. Sato, Y. Aoki, H. Sugawara, T. Fukuhara, J. Phys. Soc. Jpn. 64, 3175 (1995).
- (15) C. V. Tomy, G. Balakrishnan, D. McK. Paul, Physica C 280, 1 (1997).
- (16) S. Sarkar, S. Banerjee, A. K. Grover, S. Ramakrishnan, S. Bhattacharya, G. Ravikumar, P. K. Mishra, V. C. Sahni, C. V. Tomy, D. McK. Paul, G. Balakrishnan, M. J. Higgins, Physica C 341, 1055 (2000).
- (17) X. S. Ling, S. R. Park, B. A. McClain, S. M. Choi, D. C. Dender, J. W. Lynn, Phys. Rev. Lett. 86, 712 (2001).
- (18) Santosh Kumar, Ravi P. Singh, A. Thamizhavel, C. V. Tomy and A. K. Grover, Physica C 506, 69 (2014).
- (19) W. Henderson, E. Y. Andrei, M. J. Higgins and S. Bhattacharya, Phys. Rev. Lett. 77, 2077 (1996).
- (20) S. S. Banerjee, N. G. Patil, S. Ramakrishnan, A. K. Grover, S. Bhattacharya, G. Ravikumar, P. K. Mishra, T. V. Chandrasekhar Rao, V. C. Sahni and M. J. Higgins, Appl. Phys. Lett. 74, 126 (1999).
- (21) S. S. Banerjee, N. G. Patil, S. Ramakrishnan, A. K. Grover, S. Bhattacharya, P. K. Mishra, G. Ravikumar, T. V. Chandrasekhar Rao, V. C. Sahni, M. J. Higgins, C. V. Tomy, G. Balakrishnan and D. McK Paul, Phys Rev. B 59, 6043 (1999).
- (22) G. Ravikumar, V. C. Sahni, P. K. Mishra, T. V. Chandrasekhar Rao, S. S. Banerjee, A. K. Grover, S. Ramakrishnan, S. Bhattacharya, M. J. Higgins, E. Yamamoto, Y. Haga, M. Hedo and Y. Inada, Y. Onuki, Phys. Rev. B 57, R11069 (1998).
- (23) G. P. Espinosa, Mater. Res. Bull. 15, 791 (1980).
- (24) C.P. Bean, Rev. Mod. Phys. 36, 31 (1964).
- (25) W.A. Fietz and W.W. Webb, Phys. Rev. 178, 657 (1969).
- (26) M. Marchevsky, M. J. Higgins and S. Bhattacharya, Nature 409, 591 (2001).
- (27) X. S. Ling and J. Budnick in Magnetic Susceptibility of Superconductors and Other Spin Systems, edited by R. A. Hein, T. L. Francavilla, D. H. Liebenberg (Plenum Press, New York, 1991), p. 377.
- (28) Y. Paltiel, E. Zeldov, Y. Myasoedov, M. L. Rappaport, G. Jung, S. Bhattacharya, M. J. Higgins, Z. L. Xiao, E. Y. Andrei, P. L. Gammel and D. J. Bishop, Phys. Rev. Lett. 85, 3712 (2000).
- (29) G. Ravikumar, H. Kupfer, A. Will, R. Meier-Hirmer and Th. Wolf, Phys. Rev. B 65, 094507, (2002).
- (30) A.I. Larkin and Yu. N. Ovchinnikov, Sov. Phys. JETP 38, 854 (1974).
- (31) A.I. Larkin and Yu. N. Ovchinnikov, J. Low Temp. Phys. 34, 409 (1979).
- (32) John R. Clem and Zhidong Hao, Phys. Rev. B 48, 13774 (1993).
- (33) S. O. Valenzuela and V. Bekeris, Phys. Rev. Lett. 84, 4200 (2000).
- (34) G. Ravikumar, K. V. Bhagwat, V. C. Sahni, A. K. Grover, S. Ramakrishnan and S. Bhattacharya, Phys. Rev. B 61, R6479 (2000).
- (35) G. Ravikumar, V. C. Sahni, A. K. Grover, S. Ramakrishnan, P. L. Gammel, D. J. Bishop, E. Bucher, M. J. Higgins and S. Bhattacharya, Phys. Rev. B 63, 024505 (2001).
- (36) G. Ravikumar and H Kupfer, Phys. Rev. B 72, 144530 (2005).
- (37) N. Avraham, B. Khaykovich, Y. Myasoedov, M. Rappaport, H. Shtrikman, D. E. Feldman, T. Tamegai, P. H. Kes, M. Li, M. Konczykowski, K. van der Beek, E. Zeldov, Nature 411, 451 (2001).
- (38) S. S. Banerjee et al., Physica C 308, 25-32 (1998).
- (39) D. S. Fisher, M. P. A. Fisher, and D. A. Huse, Phys. Rev. B 43, 130 (1991)..
- (40) K. Ghosh, S. Ramakrishnan, A. K. Grover, Gautam I. Menon, Girish Chandra, T. V. Chandrasekhar Rao, G. Ravikumar, P. K. Mishra, V. C. Sahni, C. V. Tomy, G. Balakrishnan, D. McK Paul, S. Bhattacharya, Phys. Rev. Lett. 76, 4600 (1996).
- (41) M. J. P. Gingras and D. A. Huse, Phys. Rev. B 53, 15193 (1996).
- (42) D. Pal, D. Dasgupta, Bimal K Sarma, S. Bhattacharya, S. Ramakrishnan and A. K. Grover, Phys. Rev. B 62, 6699 (2000).
- (43) D.G. Grier, C.A. Murray, C.A. Bolle, P.L. Gammel, D.J. Bishop, D.B. Mitzi, and A. Kapitulnik, Phys. Rev. Lett. 66, 2270 (1992).
- (44) S. Horiuchi, M. Cantoni, M. Uchida, T. Tsuruta, and Y. Matsui, Appl. Phys. Lett. 73, 1293 (1998).
- (45) D. Mazzone, J. L. Gavilano, R. Sibille, M. Ramakrishnan, C. D. Dewhurst, and M. Kenzelmann, arXiv:1407.0569v2 [cond-mat.supr-con] 22 Oct 2014.
- (46) Y. Paltiel, D. T. Fuchs, E. Zeldov, Y. N. Myasoedov, and H. Shtrikman, M. L. Rappaport and E. Y. Andrei, Phys. Rev. B 58, R14763 (1998).
- (47) Y. Paltiel, E. Zeldov, Y. N. Myasoedov, H. Shtrikman, S. Bhattacharya, M. J. Higgins, Z. L. Xiao, E. Y. Andrei, P. L. Gammel and D. J. Bishop, Nature (London) 403, 398 (2000).