A multi-wavelength exploration of the [C ii]/IR ratio in H-ATLAS/GAMA galaxies out to
Abstract
We explore the behaviour of [C ii] 157.74 m forbidden fine-structure line observed in a sample of 28 galaxies selected from 50 deg2 of the H-ATLAS survey. The sample is restricted to galaxies with flux densities higher than mJy and optical spectra from the GAMA survey at . Far-IR spectra centred on this redshifted line were taken with the PACS instrument on-board the Herschel Space Observatory. The galaxies span (where ) and , covering a variety of optical galaxy morphologies. The sample exhibits the so-called [C ii] deficit at high IR luminosities, i.e. / (hereafter [C ii]/IR) decreases at high . We find significant differences between those galaxies presenting [C ii]/IR with respect to those showing lower ratios. In particular, those with high ratios tend to have: (1) L⊙; (2) cold dust temperatures, K; (3) disk-like morphologies in -band images; (4) a WISE colour ; (5) low surface brightness kpc-2, (6) and specific star-formation rates of sSFR Gyr-1. We suggest that the strength of the far-UV radiation fields () is main parameter responsible for controlling the [C ii]/IR ratio. It is possible that relatively high creates a positively charged dust grain distribution, impeding an efficient photo-electric extraction of electrons from these grains to then collisionally excite carbon atoms. Within the brighter IR population, , the low [C ii]/IR ratio is unlikely to be modified by [C ii] self absorption or controlled by the presence of a moderately luminous AGN (identified via the BPT diagram).
keywords:
Galaxies: starburst; ISM lines and bands; ISM evolution; Infrared: ISM resolved and unresolved sources as a function of wavelength;1 Introduction
Understanding the chemical and physical evolution of a galaxy is far from trivial. Newly born stars consume and process the available gas, whilst heating the interstellar medium (ISM), and supernovae enrich the environment with heavy elements, contributing to potentially complex feedback processes. A good description of ISM physics under the influence of stellar radiation fields was achieved using photo-dissociation region (PDR) modelling (e.g. Tielens & Hollenbach, 1985). These models can explain the origin of most of the dense ISM emission from star-forming galaxies, including the major cooling fine-structure lines of carbon/nitrogen/oxygen (C/N/O) and the underlying Infrared (IR) continuum emission produced by interstellar dust.
At IR wavelengths, the most prominent emission line is [C ii] 157.74 m (; K), which carries per cent of the bolometric power emitted by star-forming galaxies (Stacey et al., 1991, 2010), with a [C ii] flux typically that of CO (–0) at 115 GHz. The low ionisation potential, 11.26 eV, makes [C ii] a key participant in cooling the warm and diffuse media, converting it into cold and dense clouds that can then collapse to form stars (Dalgarno & McCray, 1972). As a fine-structure line, [C ii] is an excellent tracer of all the different stages of evolution of the ISM: it can be excited by collisions with electrons in the warm ionised medium; H i in the warm or cold diffuse media; and H2 in the warm and dense molecular gas. Its intensity is sensitive to the column density, the volume density and the kinetic temperature of the ISM (Pineda et al., 2013).
In the plane of the Milky Way, Pineda et al. (2013) show that the [C ii] line emission emerges predominantly at Galactocentric distances between 4 and 10 kpc. Considering a scale height for the Galaxy, Pineda et al. (2014) finds that the ISM components that contribute to the [C ii] luminosity of the Galaxy have roughly comparable contributions: 30 per cent comes from dense PDRs, 20 per cent from ionised gas, 25 per cent from diffuse atomic gas and 25 per cent from CO-dark H2 (at the surface of molecular clouds where carbon is not in the form of CO). In the local spiral galaxy M 33, Kramer et al. (2013) suggest that the [C ii] emission related to neutral gas corresponds to 15 % of the total within 2 kpc from the galaxy centre, while this percentage seems to increment up to 40 20 % in the outer part of the disk (between 2 and 7 kpc).
In distant galaxies, strong observational limitations impede a detailed characterisation of the different phases of the ISM. Typically detected in a single telescope beam, the ISM phases are all mixed together, hence [C ii] line detections relate to averaged quantities of an ensemble of individual PDRs, ionised regions, etc. Madden et al. (1993) suggest that 75 % of the [C ii] emission from the spiral galaxy NGC 6946 originates from cold neutral hydrogen clouds, and from the diffuse galaxy disk (Contursi et al. 2002). On the other hand, averaged ISM properties of luminous- and ultra-luminous- IR galaxies (LIRGs and ULIRGs) are found to vary considerably with respect to those observed in the Milky Way. LIRGs/ULIRGs present much higher star-formation rates and evidence much larger amounts of ionised gas – up to 50 % of the total (e.g. Malhotra et al. 2001). The rest of their [C ii] luminosity is expected to come from dense PDR-related ISM (e.g. Negishi et al. 2001). At the other extreme, Cormier et al. (2012) estimate that the low metallicity dwarf star-forming galaxy Haro 11 produces only 10 % of its [C ii] emission in PDRs, probably because radiation fields penetrate deep into the ISM components.
The examples shown above clearly evidence the intricate decomposition of the [C ii] emission into the different ISM phases. Great effort has been dedicated to find [C ii] correlations with various galaxy properties. Previous studies have shown that the integrated [C ii] line strength depends on the Polycyclic Aromatic Hydrocarbon (PAH) emission lines (e.g. Bakes & Tielens 1994), IR colour (Malhotra et al. 2001), the degree of active galactic nuclei (AGN; e.g. Stacey et al. 2010) activity, among other various correlations. Those with powerful AGN show fainter [C ii] than pure star-forming galaxies, at fixed (Negishi et al. 2001; Sargsyan et al. 2012). [C ii] has also been used for diagnostic purposes in galaxies at cosmological distances (e.g. Ivison et al., 2010; Valtchanov et al., 2011; George et al., 2013) and has sometimes betrayed a galaxy’s redshift (e.g. Swinbank et al., 2012; George et al., 2013). Indeed, [C ii] is a potentially unrivalled tracer of the total gas mass or the star-formation rate or the dynamics in the most distant galaxies (Maiolino et al., 2005; De Looze et al., 2014; De Breuck et al., 2014; Herrera-Camus et al., 2015).
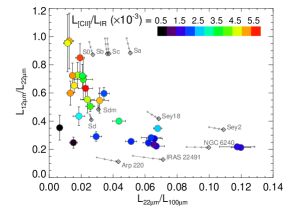
Early observations of local star-forming galaxies with the Kuiper Airborne Observatory (Stacey et al., 1991) and the Infrared Space Observatory (ISO; Malhotra et al., 1997) showed that [C ii]/IR is roughly constant at 1–3 (with a factor of three of scatter) for L⊙ galaxies (it is higher in low-metallicity environments – Madden, 2000; Rubin et al., 2009), although it drops rapidly at higher . This behaviour is usually referred to as the ‘[C ii] deficit’. [C ii]/IR also correlates strongly with 60 m/100 m colour (a proxy for dust temperature, e.g. Díaz-Santos et al., 2013) and the IR/-band luminosity ratio, / (Malhotra et al. 2001). Various explanations for the [C ii] deficit have been offered: (1) in high radiation fields, photoionisation of dust grains might saturate, hence the energy of their ejected photo-electrons is reduced, reducing also the gas heating (Luhman et al., 2003); (2) the deficit is due to an increase in the collisional de-excitation of the [C ii] transition due to an increase in gas density (Negishi et al., 2001); (3) a significant fraction of the IR emission may arise from dust absorption of photons from old stellar populations which are not related directly to PDRs (e.g. Rowan-Robinson et al., 2010); (4) a significant portion of the IR emission could emanate from ‘dust-bounded’ structures within photoionised gas regions, but the [C ii] line does not (Luhman et al. 2003; Abel et al. 2009); (5) the [C ii] line may be self-absorbed or optically thick (e.g. NGC 6334 – Boreiko & Betz, 1995) in highly embedded regions (Fischer et al., 2010) (see also Gerin et al. 2015), or (6) the level of IR emission in the most IR-luminous objects may be boosted by AGN activity (Curran, 2009; Sargsyan et al., 2012).
Recent evidence, based on observations of local star-forming galaxies with the Herschel Space Observatory111Herschel is an ESA space observatory with science instruments provided by European-led Principal Investigator consortia and with important participation from NASA. (Pilbratt et al., 2010), points to different modes of star formation driven by the star-formation efficiency, /M (e.g. Young et al., 1986), regardless of the origin of the ionised or neutral phase of the ISM (Graciá-Carpio et al., 2011). Graciá-Carpio et al. find that /M L⊙ M marks a point at which the average properties of the neutral and ionised gas are significantly different. Using a sample of powerful star-forming galaxies they propose a scenario in which highly compressed, more efficient star formation, creates largely enhanced ionisation parameters that manifest themselves in lower line to continuum ratios. This value of /M is closely related to that at which Genzel et al. (2010) and Daddi et al. (2010) claim a transition to a more efficient star-formation mode, above the so-called ‘main sequence’ for star-forming galaxies (Elbaz et al., 2011).
Herschel was able to observe [C ii] line emission from many local galaxies – a legacy that will last into the era of SPICA (the Space Infrared Telescope for Cosmology and Astrophysics – Nakagawa et al., 2012). Comprehensive analyses of these observations are mandatory if we are to interpret ground-based observations of [C ii] towards high-redshift galaxies, e.g. with the Atacama Large Millimeter Array (ALMA), where the [C ii] line is shifted into accessible atmospheric windows (e.g. Maiolino et al., 2005, 2009; Walter et al., 2009; De Breuck et al., 2011, 2014; Riechers et al., 2013, 2014). Indeed, recent studies of luminous, high-redshift galaxies have revealed a [C ii] behaviour which contrasts with that seen locally. Instead of looking like powerful ULIRGs – at the same luminosity – they exhibit striking similarities in terms of [C ii]/IR ratios to normal local star-forming galaxies (Ivison et al., 2010; Hailey-Dunsheath et al., 2010; Stacey et al., 2010; Valtchanov et al., 2011).
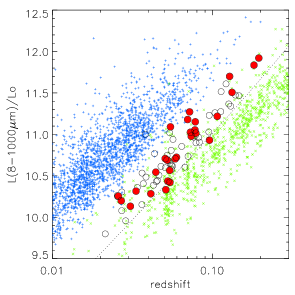
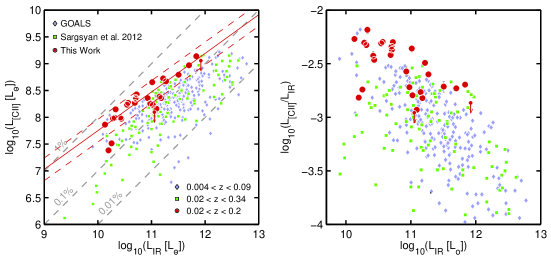
In this paper, we present Herschel Photodetector Array Camera and Spectrometer (PACS; Poglitsch et al. 2010) Integral Field Unit (IFU) detections of a sample of dusty galaxies. We populate the versus diagram with galaxies that lie at distances between 90 Mpc () and 1000 Mpc (). This study therefore bridges the gap between local galaxies and the growing body of data acquired for galaxies at high redshift. Our study performs a uniquely wide and detailed parameter space exploration that perfectly complements recent Herschel studies at low and intermediate redshifts, e.g. the Herschel ULIRG Survey (HERUS; Farrah et al. 2013) and the Great Observatories All-sky LIRG Survey (GOALS – Díaz-Santos et al., 2013), a sample of LIRGs at .
In what follows, we adopt a Kroupa initial mass function (IMF – Kroupa & Weidner, 2003) and a CDM cosmology with km s-1 Mpc-1, and .
2 Sample selection for PACS spectroscopy
We make use of the internal phase-1 data release (v2; Rigby et al. 2011; Smith et al. 2011, Valiante et al. in prep., and Bourne et al. in prep) taken from the three equatorial fields of the Herschel-Astrophysical Terahertz Large Area Survey (H-ATLAS222www.h-atlas.org– Eales et al., 2010). We make use of both Spectral and Photometric Imaging Receiver (SPIRE; Griffin et al. 2010) and PACS H-ATLAS data (Pascale et al. 2011; Ibar et al. 2010). From the total number of 109,231 sources detected in these fields, we performed the following selection criteria for our targets: (1) a flux density threshold at mJy, where 160 m is near the peak of the spectral energy distribution (SED) of a local star-forming galaxy; (2) targets without PACS 160-m ( ) neighbours within 2 arcmin from their centroids (to avoid problems when chopping; see § 3); (3) an unambiguously identification in the Sloan Digital Sky Survey (SDSS DR6 – Adelman-McCarthy et al., 2008) (reliability , Smith et al. 2011, Bourne et al. in prep.); (4) galaxies need to be smaller than the PACS spectroscopic field of view, so restricted to sources with Petrosian SDSS radii smaller than 15 arcsec in the -band (see Fig. 3); (5) high-quality spectroscopic redshifts from the Galaxy and Mass Assembly survey (GAMA333www.gama-survey.org – Driver et al., 2009, 2011) (z_qual 3). Note that GAMA combines spectra from SDSS with deeper spectra taken with the AAOmega fibre-fed spectrograph on the 3.9-m Anglo-Australian Telescope; (6) a redshift between (median, 0.05), where the upper limit is imposed by the point at which the [C ii] emission is redshifted to the edge of the PACS spectrometer 160 m band (which is known to leak), and the lower limit is imposed by the Petrosian -band criterion. Applying all these criteria, we remain with a sample of 327 sources.
For each field, we randomly selected galaxies to span a wide range of optical morphological types and IR luminosities. In total, we selected a statistically significant sample of 84 galaxies for a [C ii] spectroscopic campaign using Herschel-PACS during its second open time call. Galaxies have photometric detections at 100, 160, 250, 350 and 500 m by Herschel, including Wide-field Infrared Survey Explorer (WISE – Wright et al., 2010) photometry, and approximately half of them were also detected by IRAS at 60 m (using the Revised Imperial IRAS–FSC Redshift Catalogue444astro.ic.ac.uk/home/mrrobinson, rifscz_short.v2; Wang et al. 2014). The combination of IRAS/WISE/Herschel/SDSS photometry and GAMA spectroscopy allows accurate estimates for a wide range of physical parameters, including (having a range of ), dust temperature, stellar masses, emission line strengths, metallicities, etc. (see § 4).
3 PACS IFU observations and data analysis
Data were obtained between 2013 April 18–28, a few weeks before Herschel ran out of liquid helium, for the Herschel Open Time project, ot2_eibar_1 (P.I. E. Ibar). Of the parent sample of 84 galaxies, 28 were observed (Table 1), all from only one of the equatorial H-ATLAS coverages – the GAMA-09 h field. The selection of these 28 was performed purely on the basis of scheduling efficiency, so this sample is representative of the parent sample, just smaller in number (see Fig. 1).
| IAU name | Nickname | GAMA ID | obsid |
|---|---|---|---|
| HATLAS J09:17:21.9100:19:18.8 | G09.v2.117 | 601323 | 1342271048 |
| HATLAS J09:12:05.8200:26:55.5 | G09.v2.42 | 216401 | 1342270763 |
| HATLAS J09:09:49.5901:48:45.9 | G09.v2.26 | 324842 | 1342270761 |
| HATLAS J09:07:50.1301:01:42.6 | G09.v2.107 | 279387 | 1342270762 |
| HATLAS J09:05:32.6602:02:20.0 | G09.v2.58 | 382362 | 1342270757 |
| HATLAS J09:00:04.9800:04:46.7 | G09.v2.55 | 209807 | 1342270755 |
| HATLAS J08:58:35.9601:31:48.9 | G09.v2.76 | 376679 | 1342270657 |
| HATLAS J08:58:28.6200:38:14.8 | G09.v2.80 | 622694 | 1342270756 |
| HATLAS J08:57:48.0000:46:41.2 | G09.v2.48 | 622662 | 1342270656 |
| HATLAS J08:54:50.3302:12:08.9 | G09.v2.38 | 386720 | 1342270658 |
| HATLAS J08:54:06.0501:11:30.5 | G09.v2.137 | 301346 | 1342270655 |
| HATLAS J08:53:56.5900:12:55.6 | G09.v2.170 | 600026 | 1342270649 |
| HATLAS J08:53:46.4700:12:51.6 | G09.v2.45 | 600024 | 1342270648 |
| HATLAS J08:53:40.8701:33:48.1 | G09.v2.103 | 323855 | 1342270654 |
| HATLAS J08:52:34.3901:34:19.8 | G09.v2.87 | 323772 | 1342270653 |
| HATLAS J08:51:12.8301:03:43.6 | G09.v2.235 | 371789 | 1342270651 |
| HATLAS J08:51:11.4801:30:06.9 | G09.v2.60 | 376293 | 1342270652 |
| HATLAS J08:49:07.1500:51:40.2 | G09.v2.175 | 3624571 | 1342270647 |
| HATLAS J08:46:30.7900:50:55.1 | G09.v2.90 | 278475 | 1342270650 |
| HATLAS J08:44:28.4102:03:49.8 | G09.v2.52 | 345754 | 1342270371 |
| HATLAS J08:44:28.2702:06:57.3 | G09.v2.77 | 386263 | 1342270370 |
| HATLAS J08:43:50.9000:55:34.0 | G09.v2.102 | 371334 | 1342270372 |
| HATLAS J08:43:05.1801:08:57.0 | G09.v2.167 | 300757 | 1342270373 |
| HATLAS J08:42:17.7102:12:22.3 | G09.v2.232 | 867786 | 1342270365 |
| HATLAS J08:41:39.4501:53:44.8 | G09.v2.299 | 345647 | 1342270364 |
| HATLAS J08:38:32.0100:00:44.5 | G09.v2.111 | 208589 | 1342270374 |
| HATLAS J08:37:45.3300:51:42.3 | G09.v2.66 | 3895257 | 1342270362 |
| HATLAS J08:36:01.5700:26:18.1 | G09.v2.23 | 214184 | 1342270363 |

We targeted the redshifted [C ii]-157.7 m line emission using PACS spectroscopy in the first order/r1 filter. PACS comprises an array of spaxels, 9.4 arcsec 9.4 arcsec each, covering 2m of bandwidth covered. The instantaneous field of view in a single pointing (pointed-mode) observation is thus 47 arcsec 47 arcsec, hence based on the optical size, the majority of the line emission falls on the central spaxel.
The observations were made with a small chopping angle (1.5 arcmin), as appropriate for our sources. Note that our selection criteria have ensured that no sources would lie in the chopped beam. The H-ATLAS survey targeted areas of low IR background, so that the background intensities never approached the detector saturation level.
We retrieved the calibrated PACS level-2 data products (processed with SPG v12.1.0) using the Herschel User Interface555archives.esac.esa.int/hsa/ui/hui.jnlp (HUI v6.0.4). We exported the hps3drb (blue) and hps3drr (red) data cubes, including the appended signal, coverage, noise and wavelength index. These data cubes comprise spaxels rebinned spectral channels for each observed galaxy. At the observed frequencies, the effective spectral resolution is 190–240 km s-1, providing useful kinematical information for typical disk-like galaxies (see Table 3). We use the Interactive Data Language (idl) to analyse these cubes along with the wavelength index array.
First, we find the best flux density measurement by comparing the central spaxel line emission (plus an aperture correction 0.4–0.5; a point-like estimate) with the summed over the whole IFU (extended estimate). We conclude that the best compromise in terms of signal-to-noise for the line flux density is to use the weighted sum (aided by the appended instrumental noise cube) of the central spaxels. The addition of the outer spaxels only introduced noise in the signal. We recover, on average, 10% more flux in the extended estimate than in the point-like one.
[C ii] line fluxes were measured via a Gaussian fit to the added spectra (see Fig. 2), fitting simultaneously a linear background slope and a Gaussian using the mpfitpeak routine within idl. To perform the fit, we removed channels suffering from higher noise in both ends of the spectrum.
Using the spectroscopic redshifts, we calculate [C ii] luminosities following Solomon & Vanden Bout (2005). In order to estimate uncertainties for the line parameters, we ran a Monte-Carlo realisation (), randomly varying the signal per spectral channel using the instrumental error cube. Based on these simulated data, we quote 1- uncertainties for the line measurements and 3- upper limits (based on intrinsic 400 km s-1 FWHM widths) in Table 3.
We opted to receive data in order/b3 (blue filter at 70 m) rather than order/g2 (green), as we already have 100-m continuum photometry from the H-ATLAS imaging survey. This PACS blue point was expected to be used to improve the photometric SED sampling of the targets. We explored the blue spectra in the 53–63 m range (depending on the source redshift) and found no clear signs of line emission in the data cubes, as expected. The significance of the continuum level (blue and red) was not high enough to permit a reliable photometric point for our SED fitting approach.
4 Results
4.1 SED Properties
Making use of the Herschel-PACS, Herschel-SPIRE, and the publicly available broadband measurements from WISE-22 m (all targets detected) and IRAS (17 sources reliably detected at 60 m), we fitted the SED of each galaxy following a similar approach as in Ibar et al. (2013). We fit a usual modified black body but forcing the SED shape to a power law in the high-frequency range of the spectra. The fits are aided by the known optical redshifts. We shift all SEDs to rest-frame frequencies, following (), and then fit the following parametrisation
| (1) |
where
| (2) |
The and parameters refer to Planck and Boltzmann constants, respectively. is the usually called dust emissivity index (e.g. Seki & Yamamoto, 1980; Dunne et al., 2011) – an averaged property of the dust grain emission over of whole galaxy. The parameter is obtained numerically at
| (3) |
which is simply used to match the slope of the modified black body function with the high-frequency power-law (roughly at 100–200 m). This parameter does not have a physical meaning, nevertheless it is useful to account for the the mid-IR part of the spectra which otherwise is underestimated by a simple modified black-body (see Appendix A). Examples of best fit SED are shown in Fig. 2. To measure the IR luminosity, , we integrate the best fitted SED in rest-frame frequencies between THz (1000 m) and THz (8 m),
| (4) |
Under this parametrisation, we obtain the dust temperature (), the dust emissivity index (), the mid-IR slope (), and the normalisation which provides the total IR luminosity (rest-frame 8–1000 m). Uncertainties for each parameter were obtained from a Monte-Carlo simulation (), randomly varying the broadband photometry as appropriate for their measured uncertainties (Table 3). The best-fit SEDs for all our target galaxies are shown in Fig. 2. We find that our sample have luminosities of the order of , dust temperatures of , mid-IR slopes in the range of (plus two outliers at 4.5), and dust emissivity indices of .
4.2 The [C ii] deficit
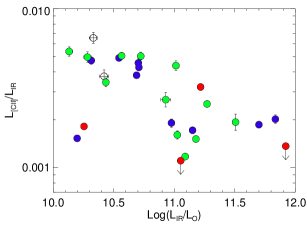
Like many before us, we find that [C ii] luminosity (including PDR and non-PDR components, which cannot be disentangled in this study) correlates strongly with luminosity over approximately two orders of magnitude (Fig. 4). A simple linear regression (excluding [C ii] undetections) results in and the distribution has a Spearman’s rho rank correlation coefficient of 0.88 and a two-sided significance of its deviation from cero of . The slope of this correlation evidences the so-called [C ii] deficit, i.e. at higher IR luminosities the line to continuum ratio decreases.
4.3 Correlations with dust properties
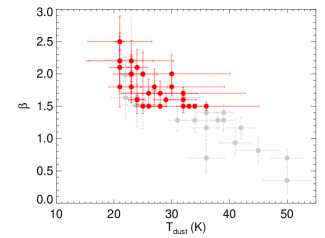
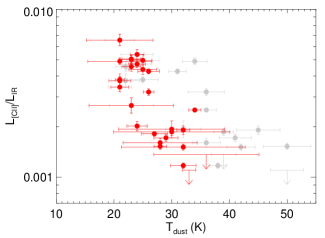
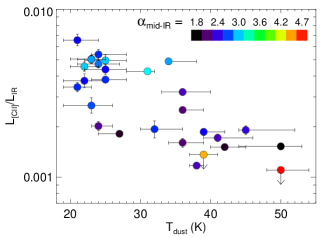
The quality of our data permits us to explore dust temperatures in great detail (uncertainties range from 1 to 5 K based on Monte-Carlo simulations; see Table 3). This is a major step forward compared to previous studies that only provided a proxy for the dust temperature, e.g. using the IRAS 100 m to 60 m ratio (Malhotra et al. 2001). Within our sample, most of the low-luminosity, low-redshift galaxies with L⊙, have isothermal dust temperatures of K (Fig. 5) – typical of ‘normal’ -ATLAS galaxies (e.g. Smith et al. 2013). The galaxies with cooler dust ( K) tend to have higher [C ii]/IR ratios than warmer galaxies. We find that 90 per cent of the galaxies with K have [C ii]/IR . This fraction decreases to 20 per cent for hotter galaxies.
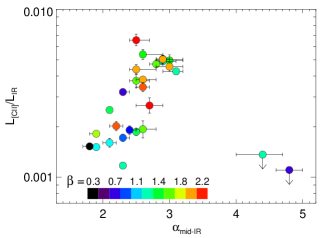
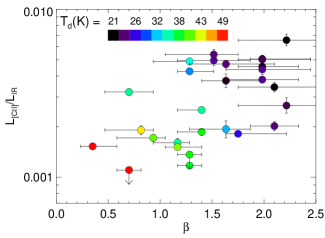
It is interesting to note the mild correlation where flatter mid-IR slopes tend to produce lower [C ii]/IR ratios. This might be a manifestation for the presence of stronger radiation fields contributing to the 22 m flux density, or simply due to the poor mid-IR constraints on the SED-fitting approach (see also § 4.4). We find that the fitted dust emissivity index, , correlates with the [C ii]/IR ratio, where higher values are found in galaxies with higher [C ii]/IR ratios (Fig. 5). In Table 2 we explore various possible correlations for the [C ii]/IR ratio as a function of fitted and observed quantities.
4.4 Correlations with WISE colours
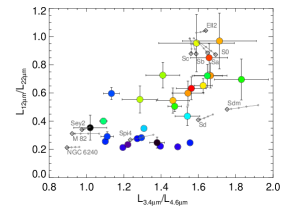
Fig. 6 shows a colour-colour diagram using WISE and Herschel photometry for our sample. We find that low [C ii]/IR ratios ( 2.5 ) are almost ubiquitous among galaxies presenting a flux density ratio , i.e. a power-law with . Note that all of our galaxies got fitted values which are steeper than (see Fig. 5), implying that the WISE colours do not reflect the same mid-IR slope. In fact, Fig. 6 indicates that the [C ii]/IR luminosity ratio depends strongly as a function of the 22 m flux density (see also Table 2).
In Fig. 6, we also show the expected WISE and Herschel colours from different SED templates taken from Polletta et al. (2007) and convolved with WISE transmission filters in the redshift range of this study (). We find that mid-IR templates from star-bursting galaxies (e.g. NGC 6240) and moderately luminous AGNs (e.g. Sey2) are well suited to explain low ratios (i.e. lower [C ii]/IR ratios). Higher [C ii]/IR ratios ratios tend to be better explained by spiral Hubble-type galaxies (S0–Sc). A close inspection to their mid-IR to far-IR SEDs, suggests three signatures controlling the ratio; the strength of the PAH 7.7 m emission line system, the Silicate absorption band at 9.8 m and the slope of the spectra. Unfortunately, with the present data we are unable to distinguish between these different features. We have performed a basic simulation taking into account the broadband filters and artificial SEDs including different slopes, equivalent widths of the PAH emission and Si absorption band. We find that the mid-IR slope is probably the dominant component in varying the observed ratio. On the other hand, on average, galaxies with low (high) [C ii]/IR ratios have low (high) (1.45) ratios. Based on Polletta et al.’s templates, we find that WISE colours from elliptical, or normal early-type galaxies, or powerful AGNs, lie outside Fig. 6, in agreement with the far-IR selection criteria which prefers star-forming dusty galaxies.
| -0.7121 0.1021 | -0.1713 0.0094 | -0.49 | 1.1 | |
| (K) | -1.9803 0.0180 | -0.0182 0.0005 | -0.72 | 0.0 |
| -3.5550 0.0256 | 0.4082 0.0105 | 0.75 | 0.0 | |
| -2.8705 0.0141 | 0.2084 0.0094 | 0.52 | 0.7 | |
| 4.9372 0.2326 | -0.2388 0.0074 | -0.76 | 0.0 | |
| 1.4705 0.3232 | -0.1231 0.0098 | -0.42 | 3.3 | |
| – | – | -0.31 | 12.8 | |
| – | – | -0.26 | 19.2 | |
| – | – | -0.26 | 19.3 | |
| – | – | -0.25 | 21.4 | |
| -3.4390 0.0329 | 0.6224 0.0234 | 0.62 | 0.1 | |
| -2.9487 0.0096 | 0.8443 0.0194 | 0.87 | 0.0 | |
| -2.2960 0.0079 | -5.5447 0.1360 | -0.82 | 0.0 | |
| – | – | 0.19 | 36.4 | |
| – | – | -0.04 | 82.8 | |
| -0.3570 0.0792 | -0.2462 0.0088 | -0.65 | 0.0 |
| Target | fwhm[CII] | [C ii]/IR | 12+log10(O/H) | BPT | Morph. | |||||||||||
|---|---|---|---|---|---|---|---|---|---|---|---|---|---|---|---|---|
| (Jy) | (km s-1) | (Jy km s-1) | () | (kpc) | (Gyr-1) | class | ||||||||||
| (1) | (2) | (3) | (4) | (5) | (6) | (7) | (7) | (9) | (10) | (11) | (12) | (13) | (14) | (15) | (16) | (17) |
| G09.v2.102 | 0.073 | 1.900.06 | 35622.88 | 84946 | 1.700.09 | 11.030.01 | 36 2 | 1.20.2 | 2.100.06 | 1.60 | 3.5 | 10.630.12 | 0.30 | – | 1 | ES |
| G09.v2.103 | 0.041 | 4.450.06 | 2200.10 | 150931 | 0.950.02 | 10.280.03 | 25 2 | 1.50.4 | 3.000.18 | 4.96 | 5.0 | 10.480.12 | 0.08 | – | 1 | S |
| G09.v2.107 | 0.128 | 4.500.09 | 22721.31 | 146762 | 9.330.40 | 11.700.01 | 39 1 | 1.40.1 | 2.500.05 | 1.86 | 4.2 | 10.510.13 | 1.84 | 8.9230.011 | 0 | I |
| G09.v2.111 | 0.078 | 3.390.07 | 19218.32 | 105242 | 2.430.10 | 11.150.01 | 41 2 | 0.90.2 | 2.300.06 | 1.72 | 5.1 | 10.550.13 | 0.48 | 9.1470.013 | 0 | ES |
| G09.v2.117 | 0.054 | 2.990.06 | 16812.24 | 89831 | 0.990.04 | 10.420.04 | 22 2 | 1.60.3 | 2.500.18 | 3.75 | 7.6 | 10.700.12 | 0.06 | – | – | ES |
| G09.v2.137 | 0.044 | 6.050.06 | 2848.39 | 234942 | 1.710.03 | 10.540.02 | 34 2 | 1.30.2 | 2.900.17 | 4.90 | 2.5 | 10.130.13 | 0.31 | 9.0100.006 | 0 | ES |
| G09.v2.167 | 0.078 | 0.460.05 | – | – | 1.25 | 11.050.03 | 50 2 | 0.70.1 | 4.800.20 | 1.10 | 2.5 | 10.350.14 | 0.61 | – | 2 | E |
| G09.v2.170 | 0.051 | 4.520.07 | 19512.97 | 143938 | 1.410.04 | 10.330.03 | 21 2 | 2.20.5 | 2.500.13 | 6.54 | 4.4 | 10.260.13 | 0.14 | – | – | S |
| G09.v2.175 | 0.070 | 3.030.06 | 31217.73 | 123546 | 2.280.09 | 11.180.01 | 42 2 | 1.20.2 | 1.900.05 | 1.51 | 3.4 | 10.480.11 | 0.60 | – | 1 | E |
| G09.v2.232 | 0.096 | 2.150.07 | 1840.01 | 64832 | 2.280.11 | 10.930.04 | 23 3 | 2.20.6 | 2.700.20 | 2.67 | 7.5 | – | – | – | 1 | ES |
| G09.v2.235 | 0.027 | 3.110.07 | 14219.93 | 90134 | 0.240.01 | 10.200.01 | 50 4 | 0.30.2 | 1.800.05 | 1.53 | 1.6 | 9.940.11 | 0.22 | 8.6650.000 | 0 | ES |
| G09.v2.23 | 0.033 | 5.250.05 | 3568.34 | 237344 | 0.970.02 | 10.310.02 | 24 2 | 1.60.4 | 2.800.13 | 4.72 | 3.6 | 10.550.11 | 0.07 | 8.9350.007 | 0 | ES |
| G09.v2.26 | 0.182 | 4.560.13 | 10323.42 | 105251 | 13.810.68 | 11.840.02 | 24 1 | 2.10.2 | 2.200.08 | 2.02 | 6.4 | 11.250.12 | 0.46 | 9.1420.007 | 0 | EI |
| G09.v2.299 | 0.074 | 2.440.06 | 25825.34 | 88048 | 1.810.10 | 10.980.01 | 45 3 | 0.80.2 | 2.400.08 | 1.91 | 2.3 | 10.540.11 | 0.33 | 9.2140.012 | 0 | E |
| G09.v2.38 | 0.059 | 2.940.05 | 52716.39 | 179458 | 2.300.08 | 10.700.02 | 22 1 | 2.00.3 | 3.000.17 | 4.55 | 4.6 | 10.890.11 | 0.08 | 9.1150.648 | 0 | ES |
| G09.v2.42 | 0.055 | 3.890.07 | 21517.74 | 129143 | 1.450.05 | 11.090.01 | 38 1 | 1.30.1 | 2.300.04 | 1.17 | 2.8 | 10.460.12 | 0.51 | – | 1 | E |
| G09.v2.45 | 0.051 | 6.100.06 | 2667.28 | 227441 | 2.180.04 | 10.710.01 | 31 1 | 1.30.2 | 3.100.13 | 4.27 | 4.0 | 10.280.13 | 0.32 | 8.9010.009 | 0 | S |
| G09.v2.48 | 0.072 | 7.170.07 | 2237.67 | 239843 | 4.690.09 | 11.270.01 | 36 1 | 1.40.1 | 2.100.03 | 2.51 | 2.4 | 10.580.13 | 0.59 | – | 1 | EI |
| G09.v2.52 | 0.026 | 4.350.06 | 16811.33 | 133133 | 0.330.01 | 10.250.01 | 27 1 | 1.80.3 | 1.900.05 | 1.81 | 2.7 | 10.290.11 | 0.11 | – | 2 | ES |
| G09.v2.55 | 0.054 | 4.280.07 | 29615.46 | 169753 | 1.860.06 | 10.570.02 | 23 1 | 2.00.3 | 2.900.11 | 5.05 | 3.3 | 10.810.11 | 0.07 | – | 1 | ES |
| G09.v2.58 | 0.052 | 5.410.06 | 2239.54 | 183239 | 1.860.04 | 10.690.02 | 25 2 | 2.00.4 | 2.600.10 | 3.81 | 3.4 | 10.600.12 | 0.15 | 9.0860.047 | 0 | ES |
| G09.v2.60 | 0.060 | 3.520.05 | 48213.53 | 199755 | 2.660.07 | 10.720.02 | 23 2 | 2.00.4 | 2.900.17 | 5.03 | 5.0 | 10.630.12 | 0.15 | – | 1 | S |
| G09.v2.66 | 0.031 | 6.730.07 | 1778.13 | 209035 | 0.730.01 | 10.130.03 | 24 2 | 1.50.3 | 2.600.17 | 5.38 | 3.1 | 10.350.12 | 0.07 | – | 1 | S |
| G09.v2.76 | 0.107 | 3.610.08 | 23018.52 | 120147 | 5.300.21 | 11.220.01 | 36 3 | 0.70.2 | 2.300.07 | 3.21 | 7.9 | 11.070.12 | 0.17 | – | 2 | EI |
| G09.v2.77 | 0.079 | 3.920.06 | 40314.68 | 191758 | 4.510.14 | 11.010.03 | 25 2 | 2.00.4 | 2.500.18 | 4.38 | 4.6 | 10.590.13 | 0.32 | – | 1 | S |
| G09.v2.80 | 0.053 | 3.420.07 | 10415.06 | 90732 | 0.940.03 | 10.440.02 | 21 2 | 2.10.4 | 2.600.12 | 3.44 | 4.0 | 10.750.12 | 0.06 | – | 1 | ES |
| G09.v2.90 | 0.133 | 1.700.06 | 45955.95 | 90991 | 6.220.63 | 11.510.02 | 32 3 | 1.60.2 | 2.600.16 | 1.93 | 4.7 | 10.730.11 | 0.73 | – | 1 | E |
| G09.v2.87 | 0.195 | 1.170.12 | – | – | 11.38 | 11.920.01 | 39 2 | 1.30.2 | 4.400.98 | 1.36 | 3.3 | 10.590.10 | 2.58 | – | 2 | E |
4.5 Correlations with optical properties
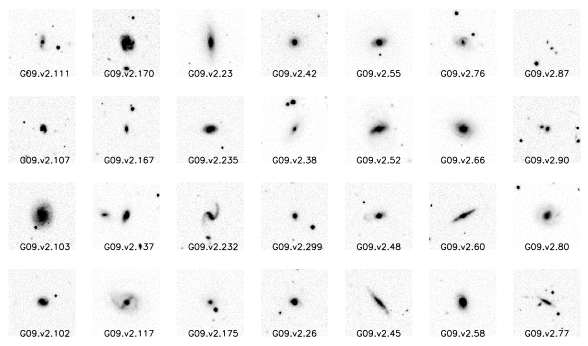
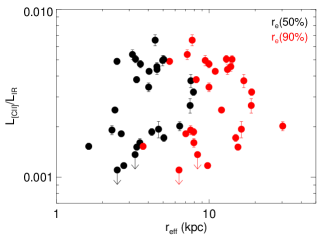
In this section, we explore the optical properties of the targets. First, we look for morphological features. We downloaded the corresponding fits files -band images from the SDSS archive666skyserver.sdss3.org/dr9/en/tools/chart/ (see Fig. 3). We masked all sources which are not contributing to the far-IR emission, and created the encircled energy fraction as a function of a radius centred at the peak source position. We measured the effective radius at which 50 % (and 90 %) of the power is encircled, and then transformed this projected size into a physical scale at the given redshift of the galaxy. These scales are shown in Fig. 7 as a function of the [C ii]/IR ratio. No clear correlation is found between these two observables (Table 2).
We then performed a basic visual inspection using the -band SDSS imaging to classify these galaxies in three populations: ellipticals (‘E’), spirals (‘S’) and irregulars (‘I’). Some galaxies show morphologies which are not possible to classify in a single population. In these cases we use a combination of letters, e.g. ‘ES’ or ‘EI’, to refer to a prominent bulge with a disk or an irregular morphology, respectively. Under this classification, in Fig. 7 we show that the [C ii]/IR ratio is preferentially higher in galaxies presenting a prominent disk compared to those which do not present disky morphologies.
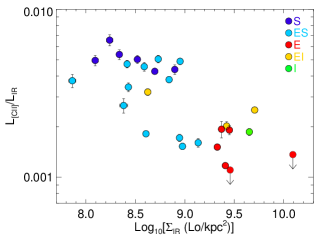
In order to provide an estimate for the IR surface brightness of the galaxies, we consider the optical -band radius as a proxy for the actual IR radius, so we define . We reckon this is a strong assumption so this value should be interpreted with caution. As expected, we find that the previous morphological classification is correlated to the surface brightness. Indeed, those with low values tend to be those presenting disk-like morphologies, while those which are classified as pure elliptical tend to be those with highest brightness in the sample.
With the aim to identify possible [C ii] self-absorption (e.g. following Gerin et al. 2015), we have looked for the properties of edge-on galaxies within the spiral population (see Fig. 3). The four identified edge-on galaxies tend to have a well defined high [C ii]/IR ratios of , and do not deviate from the rest of the ‘spiral-only’ population.
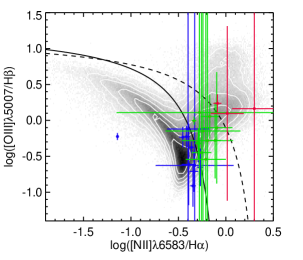
To characterise the nature of our galaxies, we have utilised the SDSS and GAMA spectra to locate them in the “Baldwin, Phillips & Terlevich” (BPT) diagram (Baldwin et al. 1981). Emission line strengths for H, H, [N ii]6583 and [O iii]5007 are extracted from spectra using the GANDALF pipeline (see details in Hopkins et al. 2013). Only two galaxies do not have all four lines detected. We show these data in Fig. 8, where our sample is over-plotted on top of the whole spectroscopic SDSS population. We find that our sample locates all over the star-forming, AGN and composite (a mix of both) regions. The main selection criterion, mJy, therefore introduces a significant number of low-luminosity AGNs in the sample. This permits to test if AGN activity plays an important role in the [C ii]/IR ratio. Note that none of our galaxies falls close to the peak of the distribution of star-forming SDSS galaxies. We show that under the BPT classification, our sample of star-forming and composite galaxies do not show significant differences in terms of [C ii]/IR ratios (Fig. 8). We note, however, that the uncertainties in the line flux ratios might be blurring any possible correlation.
The stellar masses () for all galaxies are calculated as described in Taylor et al. (2011), using GAMA catalogue version v08. The stellar mass estimates were derived by fitting their SEDs (Bruzual & Charlot 2003) to the SDSS imaging – data which have been re-processed by the GAMA team (Hill et al. 2011). The dust obscuration law applied was that of Calzetti et al. (2000), and a Chabrier (2003) IMF was assumed. The stellar masses are determined by integrals that are weighted to the probability of each SED fit. This has been performed to all galaxies regardless of the nature (star-forming/AGN) defined by the BPT diagram. We have not applied any conversion factor to convert from Chabrier to Kroupa IMF because the variation is negligible compared to the measured errors. Taylor et al. demonstrate that the relation between (–) and offers a simple indicator of the stellar masses. To account for aperture effects, a correction based on the Sérsic fit to the surface brightness profiles is applied to the stellar masses (see Taylor et al. 2011; Kelvin et al. 2012).
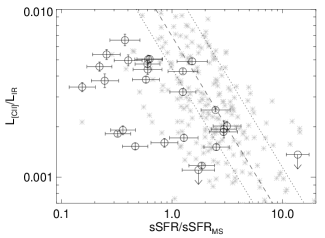
We use the SFR derived from the bolometric IR emission, following Kennicutt (1998). In combination with the stellar mass estimate we obtain the specific-SFRs (sSFR ). We find the sSFR seems to anti-correlate with the [C ii]/IR luminosity ratios (see Fig. 9), hence those galaxies presenting lower [C ii]/IR ratios are preferentially passing through more violent bursts of star-formation. In order to remove a possible dependency on redshift and follwing Díaz-Santos et al. (2013)’s work, we have divided our sSFR estimates by the one expected at the ‘main-sequence’ defined by Elbaz et al. (2011) (at the given redshift). We find that our sources are centred at the main sequence value but cover a wide range of two orders of magnitude around it (see Fig. 9). If we compare our sample to Díaz-Santos et al.’s, our sample is more representative of ‘normal’ star-forming galaxies than theirs.
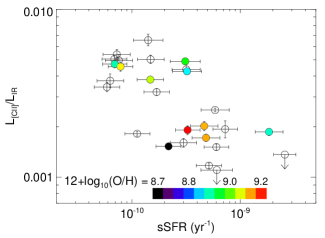
For those galaxies of which are defined as star-forming in the BPT diagram (Fig. 8), we measure reliable metallicities using the o3n2 index of Pettini & Pagel (2004), and converting those values to the calibration of Tremonti et al. (2004), following Lara-López et al. (2013). We find that these star-forming galaxies present metallicities between . For comparison, Solar metallicity is 8.91. In low metallicity environments (), the IR emission is expected to drop but the [C ii] emission would remain almost invariant, therefore the [C ii]/IR ratio is expected to be higher in low metallicity environments (see also Rubin et al. 2009; De Looze et al. 2014). Nevertheless, our sample does not probe these lower metallicities (mainly due to dust selection criterion) and so we cannot investigate correlation of [C ii] with metallicities.
5 Discussion
For many years it has been a great challenge to explain why there is a decrease in the [C ii]/IR luminosity ratio towards bright () IR luminosities. It is well established that this ratio has an intimate dependency on the strength of the radiation field () and the density () of the ISM. As explained in § 1, the [C ii] emission comes from a whole range of different ISM states; ionised, atomic and/or molecular. Unfortunately, given the low resolution of our Herschel observations, these different components are impossible to disentangle directly from imaging. Fibre-based optical spectroscopy cannot spatially separate these components neither.
First of all, we look for possible biases introduced by the selection criteria used to construct our galaxy sample. We identify that one of the most important criterion is the flux density mJy threshold, which introduces a strong selection effect on the redshift-luminosity distribution of the targets (see Fig. 1). Our targets span a redshift range between and , so approximately 2.2 Gyr of cosmic time. Based on the measured sSFR, the galaxies in our sample double their stellar masses in scales of Gyr (median 4 Gyr; see Fig. 9), values which are in most cases longer than 2.2 Gyr. In this work, we consider that for most of our targets the evolution is short in comparison to the redshift slide, i.e. a galaxy at fixed luminosity will be behaving the same at as at . Only a fourth of the targets double their stellar masses in scales which are shorter than 2.2 Gyr (those ongoing more violent star-bursts). This assumption is necessary to alleviate the luminosity-redshift dependency seen in Fig. 1. In terms of the ISM evolution using large samples of galaxies, Lara-López et al. (2009) finds no variation of the metallicity properties in this redshift range, nevertheless the dust mass density evolves strongly as a function of redshift, incrementing by a factor of two from to (Dunne et al. 2011). For the purposes of this work, we assume the flux density threshold at mJy does not introduce biases on the results.
Significant differences are found between galaxies presenting high and low [C ii]/IR luminosity ratios (see Table 2) – understood in this study as greater or lower than . We find that galaxies with high ratios:
-
•
have cold dust temperatures, preferentially lower than 30 K (see Fig. 5). This evidence indicates that these galaxies present a prominent IR component coming from extended ISM regions rather than compact ones located at the vicinity of powerful star-forming nuclear regions;
-
•
have a high WISE flux density ratio of (see Fig. 6). This range of mid-IR ratios tend to be associated to normal Hubble-type spiral galaxies, a ratio induced by a combination of spectral features within the broad WISE m and 22 m filters: prominent PAH emission lines (not suppressed by strong radiation fields), a weak 10 m Silicate absorption band (indicating moderate extinction levels), and a 22 m spectra which does not seem to be dominated by powerful hot dust emission, e.g. a young and violent star-burst or an AGN torus;
-
•
have preferentially lower surface brightness () as shown in Fig. 7 (see significance in Table 2). We stress this estimate uses the effective -band radius as a proxy for the IR extension. If the mean free path of the far-UV photons is large, then the strength of the radiation fields would be directly proportional to (Wolfire et al. 1990). If this is the case, this suggests that galaxies with weaker radiation fields produce higher [C ii]/IR luminosity ratios. Nevertheless, given the lack of correlation between [C ii]/IR and (see Table 2), this behaviour could be a manifestation of the correlation with instead;
-
•
have preferentially disk-like morphologies. Those galaxies which are classified as spirals (‘S’), without prominent bulges, are those with the highest [C ii]/IR ratios (; see Fig. 7), similar to that found by Díaz-Santos et al. (2013) while looking at the pure star-forming LIRGs in their sample. These evidences suggest that galaxies with high [C ii]/IR ratios evolve quiescently rather than triggered by a major merger event with a subsequent powerful nuclear star-burst;
-
•
present a wide range of sSFR yr-1 (IR-based), hence the mechanism controlling the [C ii] emission does not seem to relate to the efficiency of converting gas into stars. At constant SFR, these galaxies range from to Gyr to double their stellar masses. These results do not agree with the [C ii]/IR versus sSFR/sSFRMS correlation (see Fig. 9) found by Díaz-Santos et al. (2013), probably because we observe more ‘normal’ galaxies (relative to the ‘main-sequence’ defined by Elbaz et al. 2011) than their local LIRGs sample, and also given by the fact that our sample does not include a significant number of galaxies with low [C ii]/IR ratios that permit to evaluate the correlation at higher sSFR levels. Our data might suggest an evidence for a plateau in Díaz-Santos et al.’s correlation at sSFR/sSFR, probably induced by a different and more inefficient star-formation mechanism controlling the [C ii]/IR ratio (Daddi et al. 2010; Graciá-Carpio et al. 2011).
5.1 The strength of the radiation field
Modelling the [C ii] emission as coming from PDRs, we suggest that one of the main parameters responsible in controlling the [C ii]/IR ratio is the strength of the far-UV radiation field (). This is supported by the significant correlation found between dust temperatures, and , with the luminosity ratio. Higher dust temperatures suggest higher radiation fields generated by higher SFR surface densities, which might create large ionised complexes, especially expected in those galaxies with high IR luminosities . These more extreme conditions could easily change the dominant ISM state responsible for the bulk of the [C ii] emission (e.g. Díaz-Santos et al. 2013).
Actually, the far-UV radiation field (produced by O and B stars) is one of the main contributors to the heating of the gas via the photo-electric effect on dust grains. In the case of soft radiation fields, the ejection rate of photo-electrons from dust decreases (e.g. Spaans et al. 1994), while in the case of strong radiation fields, the dust grains become positively charged, increasing the potential well that the photo-electrons need to overcome, and thus reducing the input energy transferred to the gas by photo-electrons (Tielens & Hollenbach 1985; Malhotra et al. 1997, 2001; Luhman et al. 2003).
We suggest that the [C ii]/IR ratio is controlled by the strength of the far-UV radiation fields, hence the decrement of the [C ii] line with respect to IR emission is most probably due to an increment of positively charged dust grains (higher dust temperatures), which reduces the efficiency of the far-UV radiation field in transferring energy into the gas.
Negishi et al. (2001) found that the / (where is the density of electrons of the ISM) ratio does not drive the [C ii]/IR ratio but they suggest that high gas densities play an important role in controlling the [C ii] emission. Morphologically speaking, our analysis shows that galaxies with low [C ii]/IR ratios tend to have prominent bulges in nuclear regions, i.e. probably suggesting that gas density plays an important role in the [C ii]/IR ratio. However, we were unable to identify a clear correlation between [C ii]/IR ratio and sSFR, indicating that more efficient SFR in compact regions is probably not controlling the [C ii]/IR ratio (at least at the parameter space explored by this work). Unfortunately, with the available data presented in this work, we are unable to separate the intimate relation between the strength of the radiation field and the density of the ISM. To separate both parameters we require [C ii] together with another emission line, such as the fine transitions of [N ii], [O i] and [C i] or rotational transitions of CO to properly determine the physical conditions of the ISM (e.g. Wolfire et al. 1989; Hailey-Dunsheath et al. 2010).
5.2 The ISM origin of the [C ii] emission
We show that galaxies presenting high [C ii]/IR ratios have relatively cold dust temperatures, have dominant disk-like morphologies, and low surface brightness, evidences that indicate relatively weaker far-UV radiation fields. As previously shown by Pineda et al. (2014), the origin of the [C ii] emission in the Milky Way (a ‘normal’ spiral galaxy) is not only from cold PDRs, but includes also contributions of the same order from ionised gas, diffuse atomic gas and CO-dark H2. It is expected that weaker radiation fields would imply smaller complexes of ionised gas. We argue that sources with high [C ii]/IR ratios might not only emit their [C ii] luminosity from cold PDRs but also from the diffuse and extended atomic ISM phase. Without a H2 tracer (e.g. CO lines), we are unable to prove this statement, although it points out to the difficulties in understanding the origin of the [C ii] emission with a single far-IR line detection.
5.3 Old stellar populations contributing to the cold IR emission
The [C ii] and IR luminosities are intimately related to the star-formation process. In this section we explore if the ‘[C ii]-deficit’ could be a manifestation of an inclusion of an IR emitting component which is not related to the star-formation, but to old stellar populations. Actually, the IR SED component coming from dust heated by old stellar populations is cold, diffuse and is predominantly emitted at long m wavelengths. We have explored the possibility that the 500 m luminosity could correlate with the [C ii]/IR ratio, although no clear trends are observed (see Table 2). If a prominent cirrus-like emission is present in these galaxies, the Rayleigh-Jeans would tend to have flatter spectra (between 250 and 500 m), hence would tend to bias the fitted dust emissivity index (see also Appendix A) – this parameter basically controls the slope in the Rayleigh-Jeans regime. With the available data it is not possible to distinguish different physical dust properties from a strong cirrus component. Nevertheless, it is worth mentioning that the anti-correlation found between best fit and the [C ii]/IR luminosity ratio (Fig. 5) suggests that it is unlikely that the bolometric IR luminosity is dominated by a cold cirrus component, hence responsible for the decrement seen in [C ii]/IR as a function of IR luminosity. This is in agreement with the selection criterion mJy which prefers galaxies dominated by star-forming heating.
5.4 Self absorption or optically thick
Extraordinarily large column densities are required to make the [C ii] emission optically thick. Self absorption has been employed to explain the [C ii] emission from AGN-dominated systems, like Mrk 231 (Fischer et al. 2010) where H i column densities could be higher than 10cm-2. For most star-burst galaxies this effect is expected to be small, especially at the luminosity range explored by this work . On the other hand, Gerin et al. (2015) have recently shown that on the plane of the Milky Way the presence of foreground absorption may completely cancel the emission from a background far-IR emitter in medium spectral resolution data, suggesting that spectra should be taken at high spectral resolution, e.g. using HIFI (de Graauw et al. 2010) rather than PACS, to interpret correctly the [C ii] emission, therefore the [C ii]/IR ratio.
In order to explore this idea, we have identified all four edge-on galaxies in our sample as possible optically thick [C ii] candidates (along the line of sight). We find that all four galaxies are at the high end of the [C ii]/IR luminosity ratio distribution. This result suggests that the [C ii] emission might not be self-absorbed, at least by the disk, where most of the H ii regions and surrounding PDRs are placed.
Supposing that the whole [C ii] emission of the disk (mostly PDR-related) is absorbed, then the observed high [C ii]/IR ratios should come from a diffuse [C ii] component preferentially located above/below the disk. Note also that these edge-on galaxies tend to show line FWHMs which are 200 km s-1 (see Table 3), helping the line emission to escape from the disk.
5.5 IR emission contaminated by an AGN
It has been previously shown that sources harbouring an AGN have lower [C ii] to IR luminosity ratios (e.g. Sargsyan et al. 2012). In Fig. 8, we have classified star-forming galaxies from AGNs using the BPT diagram. Error bars are large, although we find that star-forming, composite and AGN populations are indistinguishable in terms of [C ii]/IR luminosity ratios, possibly suggesting that the presence of an AGN might be playing a local but not a global role on the [C ii]/IR luminosity ratios – at least at the low AGN luminosities presented in this work. This is supported by Díaz-Santos et al. (2013) as they found that AGNs selected by a simple PAH equivalent width threshold do not modify significantly the [C ii]/IR luminosity ratio.
6 Conclusion
We have used recent PACS spectroscopic [C ii] observations to describe its relation to the IR luminosity in a sample of 28 galaxies selected from the -ATLAS survey. This sample has high-quality IR photometry from WISE, IRAS and Herschel, with the addition of unambiguous photometry and spectroscopy from the SDSS and GAMA surveys.
In summary, after an exploration over a wide multi-wavelength parameter space, we have identified the following correlations. We find that galaxies with high luminosity ratios tend to: have , dust temperatures lower than 30 K, high WISE colours in the range , present disk-like morphologies, have low surface brightness (using the -band effective radius), and got a range of star-formation rate efficiencies (sSFR Gyr-1).
Assuming that the physical properties of star-forming galaxies, at fixed luminosity, are the same at and (the range of redshift of our galaxy sample), and based on the correlations found between the [C ii]/IR luminosity ratio and the dust temperature (and ), we conclude that the most probable parameter controlling the [C ii]/IR luminosity ratio is the strength of the radiation field (averaged over the entire galaxy) – probably inducing an increment of the positive charge of dust grains that has an effect in the effective energy deposited by the radiation field in the electrons extracted from dust grains.
The lack of correlation between galaxies with high [C ii]/IR luminosity ratios () and sSFR values suggests that the efficiency to convert gas into stars (e.g. in high density environments) is not playing a dominant role in the line to continuum behaviour, contrary to the correlation found by Díaz-Santos et al. (2013). We are probably observing a plateau for the correlation at lower SFR/SFR ratios, maybe product of a different star-forming mechanism that controls the [C ii]/IR ratio.
We find that the [C ii] deficit is unlikely to be a manifestation of optically thick [C ii] emission, as evidenced by the high [C ii]/IR luminosity ratios found in edge-on spiral galaxies. On the other hand, the analysis we performed to characterise the nature of our galaxies, using the BPT diagram, is not conclusive as all star-forming galaxies, AGNs and composite populations do not clearly distinguish from each other in terms of the [C ii]/IR luminosity ratio. We conclude that at least at the AGN luminosities shown by our sample, AGN activity does not seem to play a dominant role in the [C ii] deficit.
7 Acknowledgments
E. Ibar acknowledges funding from CONICYT FONDECYT postdoctoral project N∘:3130504. RJI, LD and SM acknowledge support from the European Research Council in the form of Advanced Investigator programme, COSMICISM. CF acknowledges funding from CAPES (proc. 12203-1). We would like to thank the anonymous referee for the helpful comments. The Herschel-ATLAS is a project with Herschel, which is an ESA space observatory with science instruments provided by European-led Principal Investigator consortia and with important participation from NASA. The H-ATLAS website is http://www.h-atlas.org/. PACS has been developed by a consortium of institutes led by MPE (Germany) and including UVIE (Austria); KU Leuven, CSL, IMEC (Belgium); CEA, LAM (France); MPIA (Germany); INAF-IFSI/OAA/OAP/OAT, LENS, SISSA (Italy); IAC (Spain). This development has been supported by the funding agencies BMVIT (Austria), ESA-PRODEX (Belgium), CEA/CNES (France), DLR (Germany), ASI/INAF (Italy), and CICYT/MCYT (Spain). GAMA is a joint European-Australasian project based around a spectroscopic campaign using the Anglo-Australian Telescope. The GAMA input catalogue is based on data taken from the Sloan Digital Sky Survey and the UKIRT Infrared Deep Sky Survey. Complementary imaging of the GAMA regions is being obtained by a number of independent survey programs including GALEX MIS, VST KiDS, VISTA VIKING, WISE, Herschel-ATLAS, GMRT and ASKAP providing UV to radio coverage. GAMA is funded by the STFC (UK), the ARC (Australia), the AAO, and the participating institutions. The GAMA website is http://www.gama-survey.org/. This work has been developed thanks to TOPCAT software (Taylor 2005).
References
- Abel et al. (2009) Abel N. P., Dudley C., Fischer J., Satyapal S., van Hoof P. A. M., 2009, ApJ, 701, 1147
- Adelman-McCarthy et al. (2008) Adelman-McCarthy J. K. et al., 2008, ApJS, 175, 297
- Bakes & Tielens (1994) Bakes E. L. O., Tielens A. G. G. M., 1994, ApJ, 427, 822
- Baldwin et al. (1981) Baldwin J. A., Phillips M. M., Terlevich R., 1981, PASP, 93, 5
- Boreiko & Betz (1995) Boreiko R. T., Betz A. L., 1995, ApJ, 454, 307
- Bruzual & Charlot (2003) Bruzual G., Charlot S., 2003, MNRAS, 344, 1000
- Calzetti et al. (2000) Calzetti D., Armus L., Bohlin R. C., Kinney A. L., Koornneef J., Storchi-Bergmann T., 2000, ApJ, 533, 682
- Chabrier (2003) Chabrier G., 2003, PASP, 115, 763
- Contursi et al. (2002) Contursi A. et al., 2002, AJ, 124, 751
- Cormier et al. (2012) Cormier D. et al., 2012, A&A, 548, A20
- Curran (2009) Curran S. J., 2009, A&A, 497, 351
- Daddi et al. (2010) Daddi E. et al., 2010, ApJ, 714, L118
- Dalgarno & McCray (1972) Dalgarno A., McCray R. A., 1972, ARA&A, 10, 375
- De Breuck et al. (2011) De Breuck C., Maiolino R., Caselli P., Coppin K., Hailey-Dunsheath S., Nagao T., 2011, A&A, 530, L8
- De Breuck et al. (2014) De Breuck C. et al., 2014, ArXiv e-prints
- de Graauw et al. (2010) de Graauw T. et al., 2010, A&A, 518, L6
- De Looze et al. (2014) De Looze I. et al., 2014, A&A, 568, A62
- Díaz-Santos et al. (2013) Díaz-Santos T. et al., 2013, ApJ, 774, 68
- Driver et al. (2011) Driver S. P. et al., 2011, MNRAS, 413, 971
- Driver et al. (2009) Driver S. P. et al., 2009, Astronomy and Geophysics, 50, 050000
- Dunne et al. (2011) Dunne L. et al., 2011, MNRAS, 417, 1510
- Eales et al. (2010) Eales S. et al., 2010, PASP, 122, 499
- Elbaz et al. (2011) Elbaz D. et al., 2011, A&A, 533, A119
- Farrah et al. (2013) Farrah D. et al., 2013, ApJ, 776, 38
- Fischer et al. (2010) Fischer J. et al., 2010, A&A, 518, L41
- Genzel et al. (2010) Genzel R. et al., 2010, MNRAS, 407, 2091
- George et al. (2013) George R. D. et al., 2013, MNRAS, 436, L99
- Gerin et al. (2015) Gerin M. et al., 2015, A&A, 573, A30
- Graciá-Carpio et al. (2011) Graciá-Carpio J. et al., 2011, ApJ, 728, L7
- Griffin et al. (2010) Griffin M. J. et al., 2010, A&A, 518, L3
- Hailey-Dunsheath et al. (2010) Hailey-Dunsheath S., Nikola T., Stacey G. J., Oberst T. E., Parshley S. C., Benford D. J., Staguhn J. G., Tucker C. E., 2010, ApJ, 714, L162
- Herrera-Camus et al. (2015) Herrera-Camus R. et al., 2015, ApJ, 800, 1
- Hill et al. (2011) Hill D. T. et al., 2011, MNRAS, 412, 765
- Hopkins et al. (2013) Hopkins A. M. et al., 2013, MNRAS, 430, 2047
- Ibar et al. (2010) Ibar E. et al., 2010, MNRAS, 409, 38
- Ibar et al. (2013) Ibar E. et al., 2013, MNRAS, 434, 3218
- Ivison et al. (2010) Ivison R. J. et al., 2010, A&A, 518, L35
- Kauffmann et al. (2003) Kauffmann G. et al., 2003, MNRAS, 346, 1055
- Kelvin et al. (2012) Kelvin L. S. et al., 2012, MNRAS, 421, 1007
- Kennicutt (1998) Kennicutt R. C., Jr., 1998, ARA&A, 36, 189
- Kewley et al. (2001) Kewley L. J., Dopita M. A., Sutherland R. S., Heisler C. A., Trevena J., 2001, ApJ, 556, 121
- Kramer et al. (2013) Kramer C. et al., 2013, A&A, 553, A114
- Kroupa & Weidner (2003) Kroupa P., Weidner C., 2003, ApJ, 598, 1076
- Lara-López et al. (2009) Lara-López M. A., Cepa J., Bongiovanni A., Pérez García A. M., Castañeda H., Fernández Lorenzo M., Pović M., Sánchez-Portal M., 2009, A&A, 505, 529
- Lara-López et al. (2013) Lara-López M. A. et al., 2013, MNRAS, 434, 451
- Luhman et al. (2003) Luhman M. L., Satyapal S., Fischer J., Wolfire M. G., Sturm E., Dudley C. C., Lutz D., Genzel R., 2003, ApJ, 594, 758
- Madden (2000) Madden S. C., 2000, New Astronomy Review, 44, 249
- Madden et al. (1993) Madden S. C., Geis N., Genzel R., Herrmann F., Jackson J., Poglitsch A., Stacey G. J., Townes C. H., 1993, ApJ, 407, 579
- Maiolino et al. (2009) Maiolino R., Caselli P., Nagao T., Walmsley M., De Breuck C., Meneghetti M., 2009, A&A, 500, L1
- Maiolino et al. (2005) Maiolino R. et al., 2005, A&A, 440, L51
- Malhotra et al. (1997) Malhotra S. et al., 1997, ApJ, 491, L27
- Malhotra et al. (2001) Malhotra S. et al., 2001, ApJ, 561, 766
- Nakagawa et al. (2012) Nakagawa T., Matsuhara H., Kawakatsu Y., 2012, in Society of Photo-Optical Instrumentation Engineers (SPIE) Conference Series, Vol. 8442, Society of Photo-Optical Instrumentation Engineers (SPIE) Conference Series
- Negishi et al. (2001) Negishi T., Onaka T., Chan K.-W., Roellig T. L., 2001, A&A, 375, 566
- Pascale et al. (2011) Pascale E. et al., 2011, MNRAS, 415, 911
- Pettini & Pagel (2004) Pettini M., Pagel B. E. J., 2004, MNRAS, 348, L59
- Pilbratt et al. (2010) Pilbratt G. L. et al., 2010, A&A, 518, L1
- Pineda et al. (2014) Pineda J. L., Langer W. D., Goldsmith P. F., 2014, ArXiv e-prints
- Pineda et al. (2013) Pineda J. L., Langer W. D., Velusamy T., Goldsmith P. F., 2013, A&A, 554, A103
- Poglitsch et al. (2010) Poglitsch A. et al., 2010, A&A, 518, L2
- Polletta et al. (2007) Polletta M. et al., 2007, ApJ, 663, 81
- Riechers et al. (2013) Riechers D. A. et al., 2013, Nature, 496, 329
- Riechers et al. (2014) Riechers D. A. et al., 2014, ApJ, 796, 84
- Rigby et al. (2011) Rigby E. E. et al., 2011, MNRAS, 415, 2336
- Rowan-Robinson et al. (2010) Rowan-Robinson M. et al., 2010, MNRAS, 409, 2
- Rubin et al. (2009) Rubin D. et al., 2009, A&A, 494, 647
- Sanders & Mirabel (1996) Sanders D. B., Mirabel I. F., 1996, ARA&A, 34, 749
- Sargsyan et al. (2012) Sargsyan L. et al., 2012, ApJ, 755, 171
- Seki & Yamamoto (1980) Seki J., Yamamoto T., 1980, Ap&SS, 72, 79
- Shetty et al. (2009) Shetty R., Kauffmann J., Schnee S., Goodman A. A., 2009, ApJ, 696, 676
- Smith et al. (2011) Smith D. J. B. et al., 2011, MNRAS, 416, 857
- Smith et al. (2013) Smith D. J. B. et al., 2013, MNRAS, 436, 2435
- Solomon & Vanden Bout (2005) Solomon P. M., Vanden Bout P. A., 2005, ARA&A, 43, 677
- Spaans et al. (1994) Spaans M., Tielens A. G. G. M., van Dishoeck E. F., Bakes E. L. O., 1994, ApJ, 437, 270
- Stacey et al. (1991) Stacey G. J., Geis N., Genzel R., Lugten J. B., Poglitsch A., Sternberg A., Townes C. H., 1991, ApJ, 373, 423
- Stacey et al. (2010) Stacey G. J., Hailey-Dunsheath S., Ferkinhoff C., Nikola T., Parshley S. C., Benford D. J., Staguhn J. G., Fiolet N., 2010, ApJ, 724, 957
- Swinbank et al. (2012) Swinbank A. M. et al., 2012, MNRAS, 427, 1066
- Taylor et al. (2011) Taylor E. N. et al., 2011, MNRAS, 418, 1587
- Taylor (2005) Taylor M. B., 2005, in Astronomical Society of the Pacific Conference Series, Vol. 347, Shopbell P., Britton M., Ebert R., ed, Astronomical Data Analysis Software and Systems XIV, p. 29
- Tielens & Hollenbach (1985) Tielens A. G. G. M., Hollenbach D., 1985, ApJ, 291, 722
- Tremonti et al. (2004) Tremonti C. A. et al., 2004, ApJ, 613, 898
- Valtchanov et al. (2011) Valtchanov I. et al., 2011, MNRAS, 415, 3473
- Walter et al. (2009) Walter F., Riechers D., Cox P., Neri R., Carilli C., Bertoldi F., Weiss A., Maiolino R., 2009, Nature, 457, 699
- Wang et al. (2014) Wang L., Rowan-Robinson M., Norberg P., Heinis S., Han J., 2014, MNRAS, 442, 2739
- Wolfire et al. (1989) Wolfire M. G., Hollenbach D., Tielens A. G. G. M., 1989, ApJ, 344, 770
- Wolfire et al. (1990) Wolfire M. G., Tielens A. G. G. M., Hollenbach D., 1990, ApJ, 358, 116
- Wright et al. (2010) Wright E. L. et al., 2010, AJ, 140, 1868
- Young et al. (1986) Young J. S., Schloerb F. P., Kenney J. D., Lord S. D., 1986, ApJ, 304, 443
Appendix A
Testing fitted parameters
As described in § 4, our SED fitting approach includes a non-standard method. The inclusion of the power-law in the mid-IR forces the slope of the modified black-body emission at 100–200 m, possibly introducing a bias on the derived dust temperature or dust emissivity index. For this reason we repeated the SED fitting approach excluding the mid-IR slope, leaving just the modified black body (MBB from Eqn.2) component. For these purposes we just use the Herschel photometry, i.e. the 100, 160, 250, 350 and 500 m data points. We also restricted, between 1.5 and 2.5, the range of possible values for the dust emissivity index.
The first thing to note is that these new fits are unable to describe the high-frequency part of the spectra, hence we cannot use them to get bolometric IR measurements. These new fits, however, show a clear difference between derived parameters. On average, we find that with this new SED-fitting method, the decreased by 6 K while increased by 0.5 – parameters which are well known to be correlated (e.g. Shetty et al. 2009; Smith et al. 2013). These results are shown in Fig. 10. This clearly demonstrate that converting from fitted parameters to ‘physical’ parameters should be taken with great caution.
Even though a significant difference is seen between derived parameters coming from these two different SED fitting approaches, the previous trend seen in [C ii]/IR luminosity ratio as a function of dust temperature remains (see Fig. 10). This confirms, again, that high [C ii]/IR ratios are associated to galaxies dominated by cold dust emission.