Discovery of H i gas in a young radio galaxy at using the Australian Square Kilometre Array Pathfinder
Abstract
We report the discovery of a new 21-cm H i absorption system using commissioning data from the Boolardy Engineering Test Array of the Australian Square Kilometre Array Pathfinder (ASKAP). Using the 711.5 – 1015.5 MHz band of ASKAP we were able to conduct a blind search for the 21-cm line in a continuous redshift range between and , which has, until now, remained largely unexplored. The absorption line is detected at towards the GHz-peaked spectrum radio source PKS B1740517 and demonstrates ASKAP’s excellent capability for performing a future wide-field survey for H i absorption at these redshifts. Optical spectroscopy and imaging using the Gemini-South telescope indicates that the H i gas is intrinsic to the host galaxy of the radio source. The narrow [O iii] emission lines show clear double-peaked structure, indicating either large-scale outflow or rotation of the ionized gas. Archival data from the XMM-Newton satellite exhibit an absorbed X-ray spectrum that is consistent with a high column density obscuring medium around the active galactic nucleus. The H i absorption profile is complex, with four distinct components ranging in width from 5 to 300 km s-1 and fractional depths from 0.2 to 20 per cent. In addition to systemic H i gas, in a circumnuclear disc or ring structure aligned with the radio jet, we find evidence for a possible broad outflow of neutral gas moving at a radial velocity of km s-1. We infer that the expanding young radio source ( yr) is cocooned within a dense medium and may be driving circumnuclear neutral gas in an outflow of 1 yr-1.
keywords:
methods: data analysis – ISM: jets and outflows – galaxies: active – galaxies: ISM – radio lines: galaxies.1 Introduction
Over the past 60 yr the 21-cm hyperfine transition of atomic hydrogen (H i) has been used by astronomers to measure the distribution and kinematics of the neutral interstellar medium (ISM) in galaxies and, importantly, trace the available fuel for future star-formation. Wide-field surveys have systematically measured the H i content in nearby galaxies (e.g. van der Hulst et al. 2001; Meyer et al. 2004; Walter et al. 2008; Koribalski 2010; Oosterloo et al. 2010; Haynes et al. 2011; Heald et al. 2011; Serra et al. 2012; Wang et al. 2013), while at greater distances individual H i-rich galaxies have been detected out to (e.g. Catinella et al. 2008; Verheijen et al. 2010; Freudling et al. 2011). Statistical techniques, such as spectral stacking (e.g. Lah et al. 2009; Delhaize et al. 2013; Rhee et al. 2013; Geréb et al. 2014) and intensity mapping (e.g. Chang et al. 2010; Masui et al. 2013) have also provided constraints on the cosmological H i mass density at and respectively.
At higher redshifts it becomes increasingly difficult for existing radio telescopes to detect the faint 21-cm emission from individual galaxies and we must look to absorption against background sources, either at 21-cm (e.g. Carilli et al. 1998; Curran et al. 2006, 2008, 2011, 2013b; Kanekar et al. 2009) or the Ly line at 1216 Å (e.g. Péroux et al. 2003; Rao et al. 2006; Noterdaeme et al. 2012; Zafar et al. 2013), to understand the evolving H i content of the distant Universe. Deficiency of spatial information is the significant drawback of using absorption to map the neutral ISM, yet it still provides one of the few practical methods of directly detecting cold H i gas in individual galaxies at an epoch of the Universe () that has, until now, remained largely unexplored (e.g. Lagos et al. 2014).
Aside from intervening galaxies, H i absorption is also a direct tracer of the interaction between radio source and host galaxy. Recent 21-cm surveys of radio-loud active galactic nuclei (AGN) have revealed the varied kinematic signatures of rotating discs, infalling and outflowing gas, and individual offset clouds (e.g. van Gorkom et al. 1989; Morganti et al. 2001; Vermeulen et al. 2003; Morganti et al. 2005; Gupta et al. 2006; Emonts et al. 2010; Chandola et al. 2011; Allison et al. 2012, 2014; Geréb et al. 2015). Amongst these heterogeneous samples we often find that the most compact sources have the highest rate of detection, the result of either intrinsically higher column densities of neutral gas (Pihlström et al. 2003), the relative orientation between source and absorber (Curran et al. 2013a) or, quite possibly, a combination of both (Orienti et al. 2006; Geréb et al. 2015). The population of compact steep-spectrum (CSS; kpc) and gigahertz peaked-spectrum (GPS; kpc) radio sources are particularly interesting targets since they are thought to constitute recently triggered radio AGN ( – yr; Fanti et al. 1995; Readhead et al. 1996; Owsianik & Conway 1998). Higher detection yields of H i absorption in these sources may be indicative of the dense and dusty environments in which they are born.
By studying the kinematics of the H i gas in young radio galaxies, along with the molecular and ionized gas, we can understand the processes by which these radio jets are triggered and their subsequent feedback on the neutral ISM. Vermeulen et al. (2003) and Morganti et al. (2005) found examples of blue-shifted H i absorption components at large negative velocities ( km s-1) with respect to galaxies hosting compact radio sources, symptomatic of jet-driven outflows of neutral gas. More recently, in-depth case studies of individual radio AGN, using high spatial resolution 21-cm and multiwavelength data, have provided direct evidence for the existence of yr-1 jet-driven outflows of H i, co-located with outflows of ionized and molecular gas e.g. 1504+377 (Kanekar & Chengalur 2008), 4C 12.50 (Morganti et al. 2013), 3C 293 (Mahony et al. 2013) and IC 5063 (Tadhunter et al. 2014).
The advent of precursor and pathfinder telescopes to the Square Kilometre Array (SKA), in particular the Australian SKA Pathfinder (ASKAP; Johnston et al. 2007; Deboer et al. 2009; Schinckel et al. 2012), the South African MeerKAT telescope (Booth et al. 2009) and the Westerbork Aperture Tile in Focus (APERTIF; Oosterloo et al. 2009), will enable astronomers to carry out radio-selected surveys for H i absorption over most of the sky. Crucially, such surveys are made possible by significant improvements in bandwidth, field-of-view, and new observatories with reduced terrestrial radio frequency interference (RFI).
Here we report the first result from a search for redshifted absorption using the ASKAP Boolardy Engineering Test Array (BETA; Hotan et al. 2014), a six-antenna prototype designed to demonstrate the feasibility and science capability of phased-array feeds (PAFs) based on a planar connected “chequerboard” array (Hay & O’Sullivan 2008). The backend digital beamformer weights the signal from 188 independent PAF receptors at the focal plane of each antenna to electronically form up to nine simultaneous primary beams within an area of approximately 30 deg2. This impressive flexibility in field-of-view is matched by the telescope’s spectral capability; the fine filterbank generates 16 416 channels over 304 MHz of bandwidth, at observing frequencies between 0.7 and 1.8 GHz, achieving an average 21-cm line resolution of km s-1 and maximum H i redshift of . We are currently using BETA to search for H i absorption towards the brightest and most compact radio sources in the southern sky. We will continue to modify our target sample to fainter sources as more antennas are added to the ASKAP array, culminating in the First Large Absorption Survey in H i (FLASH).
Throughout this paper we adopt a flat cold dark matter (CDM) cosmology with = 70 km s-1 Mpc-1, = 0.3 and = 0.7. Radial velocities and redshifts have been corrected for the solar barycentric standard of rest frame. Uncertainties are given as 1 intervals unless otherwise stated.
2 HI absorption with BETA
2.1 A pilot survey of bright, compact radio sources
As part of the early commissioning and science demonstration phase of ASKAP, we are using BETA to carry out a pilot survey of H i absorption at towards the brightest and most compact radio sources in the southern sky. The sensitivity of the telescope is substantially lower than will be achieved with the full ASKAP111The full array is expected to have 36 antennas, each fitted with a PAF that can simultaneously form up to 36 beams. and so we select targets that optimize the optical depth sensitivity, through both a high signal-to-noise ratio (S/N) continuum background and high expected fraction of radio flux obscured by foreground neutral gas. The following is a list of criteria from which we select our targets.
-
1.
Visible at declinations of .
-
2.
A total flux density greater than 1 Jy in existing all-sky catalogues at similar frequencies to this band, which include the National Radio Astronomy Observatory Very Large Array Sky Survey (NVSS; Condon et al. 1998), the Sydney University Molonglo Sky Survey (SUMSS; Mauch et al. 2003) and the second epoch Molonglo Galactic Plane Survey (MGPS-2; Murphy et al. 2007).
-
3.
Either or no known redshift according to the NASA/IPAC Extragalactic Database (NED)222\urlhttp://ned.ipac.caltech.edu/, thus excluding those sources that are known to be located in front of the volume probed by .
-
4.
A significant fraction of the total flux density is distributed on the compact scales measured by very-long-baseline-interferometry (VLBI), based on those sources listed in the VLBI radio fundamental catalogue333\urlhttp://astrogeo.org/rfc (Petrov 2013 and references therein)..
We present here our first new detection of 21-cm absorption using BETA as a demonstration of the capability of the ASKAP telescope to perform radio-selected surveys for redshifted H i. In future work we will present the results of further observations from this pilot survey.
2.2 PKS B1740517
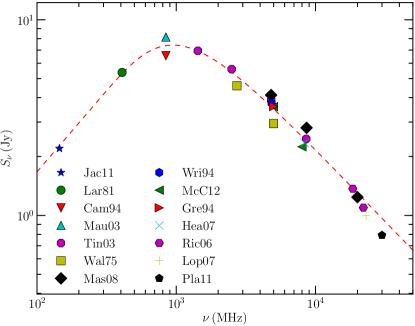
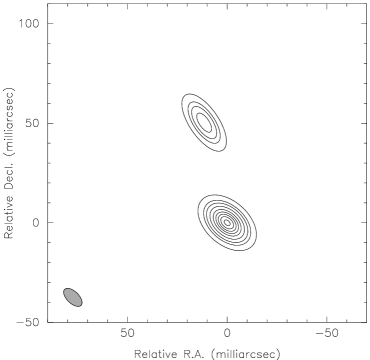
PKS B1740517 was one of the first sources selected for BETA observations based on the selection criteria outlined above. It is an archetypal GPS radio source (Randall et al. 2011), peaking at an observed frequency of 1 GHz, with optically thick and thin spectral indices444We adopt the convention that the spectral index is defined by , where is the flux density and is the frequency. of and , respectively (see Fig. 1). The relative compactness and high flux density ( Jy; Mauch et al. 2003) of this source make it an ideal target for H i absorption. Flux monitoring by King et al. over 700 d, using the 26-m antenna at the Mt. Pleasant Observatory (King 1994; Jauncey et al. 2003), indicated that the source is weakly varying at 2.3 GHz (by approximately 20 per cent), with no variation seen at 8.4 GHz over this time range. They demonstrated, by fitting to visibility data from three baselines in the network of Australian VLBI antennas (Parkes – Hobart, Parkes – Perth and Parkes – Alice Springs), that the 2.3 GHz continuum emission is adequately modelled by two compact Gaussian components of angular extent less than 10 mas and separated by 52 mas (Fig. 2). While there is some residual flux on the longest baselines, which might be indicative of more complex compact structure, the total flux density at 2.3 GHz is apparently accounted for by the modelled compact components. The spectral behaviour, VLBI-scale structure and low variability are all evidence that this radio source is intrinsically young and/or confined by its environment (e.g. O’Dea 1998).
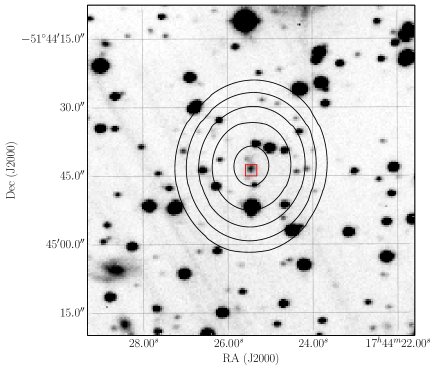
At a Galactic latitude of and longitude of , PKS B1740517 is seen through a densely populated foreground (Fig. 2), which is likely the reason for the lack of optical information for this source. Despite this, di Serego-Alighieri et al. (1994) used imaging and spectroscopy with the ESO 3.6-m telescope to secure an optical identification of the host galaxy, noting that it has a particularly red continuum. Unfortunately they could not detect any strong optical emission lines and hence secure a spectroscopic redshift. Approximate indicators of the redshift have been determined by photometric means: Wall & Peacock (1985) give a rough estimate of based on their empirically derived -band magnitude relationship (but noting a poor optical identification with the radio source), while Burgess & Hunstead (2006) estimate that based on the -band magnitude of 20.8. At longer wavelengths, the infrared colours [3.4 – 4.6 m] = 1.06 and [4.6 – 12 m] = 2.85, from the Wide-field Infrared Survey Explorer (WISE; Wright et al. 2010), are consistent with a quasi-stellar object at (fig. 1 of Blain et al. 2013). These photometric indicators of the redshift suggested that PKS B1740517 would provide a suitable background target against which we might detect absorption in the range with BETA.
2.3 Observations
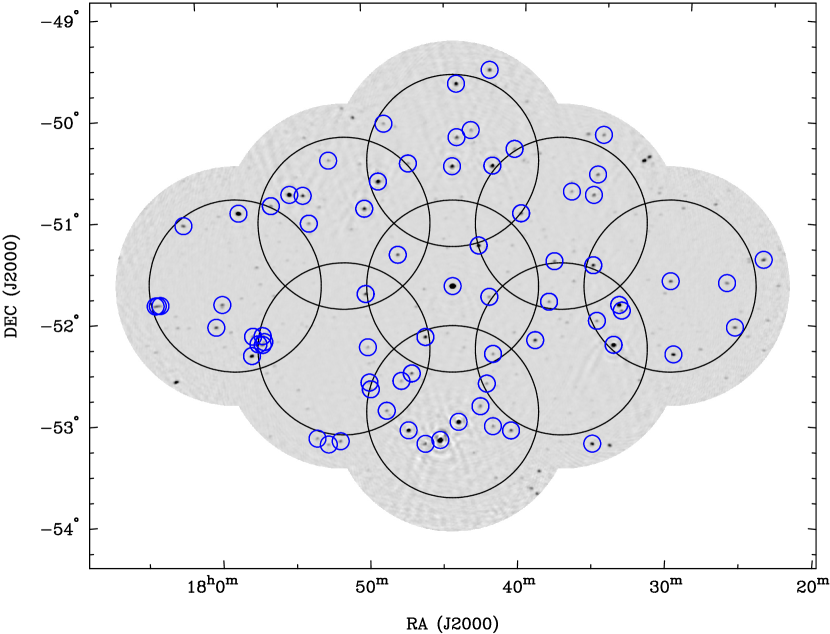
On three dates – 2014 June 24, August 03 and September 01 – we used the 711.5–1015.5 MHz band of the ASKAP BETA prototype (Hotan et al. 2014) to search for 21-cm absorption towards PKS B1740517 in the redshift range . In Table 1 we summarize the parameters for each of these observations. Fig. 3 shows the nominal footprint of the nine PAF beams for our observation (a symmetric diamond pattern), centred on and . Additional observations of a calibrator source (PKS B1934638) were carried out in short 5 – 15 min scans at the centre of each PAF beam. Using weights for the PAF elements that maximize the S/N in the required direction (see Hotan et al. 2014), beams were generated with nominal half-power widths that decrease from 207 to 145 across the whole bandpass. The six 12 m antennas of BETA are arranged in an array that is elongated by a factor of approximately 2 in the eastwest direction, with baselines in the range 37 – 916 m. Therefore the data are sensitive to angular scales in the range 1 – 39 arcmin across the band. The fine filterbanks in the beamformer generate 16 416 independent spectral channels separated by approximately 18.5 kHz, equivalent to H i velocities in the range – .
2.4 Data analysis
We used the CASA555\urlhttp://casa.nrao.edu package (McMullin et al. 2007) to separate the data into each of the nine beams and flag the auto-correlations and large amplitude values due to digital glitches. The PAF beams are formed digitally by applying weights to elemental receptors, which in the case of BETA are constant in a repeating pattern of 4 and 5 MHz intervals. There are some sharp bandpass effects at the edges of these intervals, but within them we find that the bandpass is smooth for most of the band at a level consistent with the noise in our data. This is further corroborated by the absence of any false positive detection; see Section 3.3. We therefore pursued a calibration strategy that splits the band, at full spectral resolution, into 64 chunks based on the exact pattern of 4 and 5 MHz intervals. Separately we generated a single data set of coarse channels across the band by averaging over 513 of the fine channels. The 18.5-kHz fine channels are used to search for H i absorption, while the 9.5 MHz coarse channels produce high S/N images that are used for self-calibration.
We performed calibration, imaging and further flagging of the data using tasks from the MIRIAD666\urlhttp://www.atnf.csiro.au/computing/software/miriad/ package (Sault et al., 1995). Those 18.5-kHz channels that were corrupted by narrow-band RFI were flagged using a MIRIAD implementation of the SumThreshold method developed by Offringa et al. (2010), which typically resulted in data loss of a few per cent. The majority of this low-level RFI is caused by single-channel spikes, commonly referred to as birdies, which are generated by the cooling system flow regulator valves associated with the first generation of phased-array feeds. Further corrupted data, resulting from problems with individual antennas, antenna baselines or the backend correlator, were also manually removed at this stage. In particular, there was an intermittent problem with the time synchronisation between individual correlator cards that resulted in 50 per cent of the spectral band being flagged for the data obtained on 2014 June 24 and September 01.
The flux density scale and rough gain corrections for each antenna were calculated using short scans (between 5 and 15 min) of PKS B1934638 in each PAF beam, based on the model of Reynolds (1994). These solutions were then transferred to the corresponding data in the PKS B1740517 field. We achieved further correction for the time-dependent gains by performing multiple iterations of self-calibration on the coarse-channel data, which span the whole band and thereby provide optimal S/N. Initially the SUMSS 843 MHz radio catalogue (Mauch et al., 2003) was used to construct a sky model for each PAF beam, followed by models generated from the data using a multi-frequency synthesis variant of the CLEAN algorithm (Högbom, 1974). At each iteration the MIRIAD SELFCAL task was used to solve for the time-dependent gains, and we simply transferred these corrections to each of the corresponding 64 chunks of 18.5 kHz fine-channel data.
Precise subtraction of the continuum flux density was achieved by generating continuum images for each of the 64 chunks of fine-channel data and then subtracting the CLEAN component models (using UVMODEL) from the visibilities. Removal of any residual flux density, including curvature of the instrumental bandpass towards low frequencies, was performed by fitting a second-order polynomial to each chunk and subtracting using UVLIN. Channels containing any detected absorption features were subsequently excluded in iterative refinement of the above continuum subtraction procedure. We image the continuum-subtracted data in the standard way, forming cubes that are equal to the nominal full width at half-maximum (FWHM) of the beams at the middle of the band. Spectra were then extracted at the positions of identified continuum target sources within each beam centre and converted to units of fractional absorption through dividing by the continuum.
| Date | MJD | PAF beams | Antennas | ||||||
|---|---|---|---|---|---|---|---|---|---|
| Start | End | (h) | (arcsec) | () | (mJy beam-1) | ||||
| 2014 June 24 | 56832.442 | 56832.921 | 1 (centre) | 1, 8, 9, 15 | 11.5 | 90 | 70 | +70 | 23 |
| 2014 August 03 | 56872.649 | 56872.774 | 9 (diamond) | 1, 3, 6, 8, 15 | 3.0 | 340 | 100 | 40 | 37 |
| 2014 September 01 | 56901.224 | 56901.723 | 9 (diamond) | 1, 6, 8, 9, 15 | 11.9 | 100 | 80 | 90 | 18 |
| Epoch | ID | |||||
|---|---|---|---|---|---|---|
| (km s-1) | (per cent) | |||||
| 2014 June 24 | 1 | |||||
| 2 | ||||||
| 3 | ||||||
| 4 | ||||||
| 2014 August 03 | 1 | |||||
| 2 | ||||||
| 2014 September 01 | 1 | |||||
| 2 | ||||||
| 3 | ||||||
| 4 | ||||||
| Average | 1 | |||||
| 2 | ||||||
| 3 | ||||||
| 4 |
2.5 Combining spectra from multiple PAF beams
Some sources in the field may be common to multiple PAF beams (see Fig.3) and so we construct a single spectrum by averaging over spectra from the individual beams. Since our arrangement of the PAF beams here is such that they do overlap, the noise in each spectrum is not independent and so the optimal S/N is given by weighting each spectrum by the inverse of the noise covariance matrix. In the case of the diamond footprint used here, the nominal noise correlation measured between adjacent beams (separated by between their centres) ranges from approximately 30 to 10 per cent across the 711.5 – 1015.5 MHz band. The optimal averaged spectrum is then given by
| (1) |
and
| (2) |
where is the noise covariance matrix between beams, is the set of fractional absorption data in each beam and is an accompanying set of weights, which in this case are unity. The elements of are estimated empirically by measuring the noise covariance between pairs of beams on a per-pixel basis.
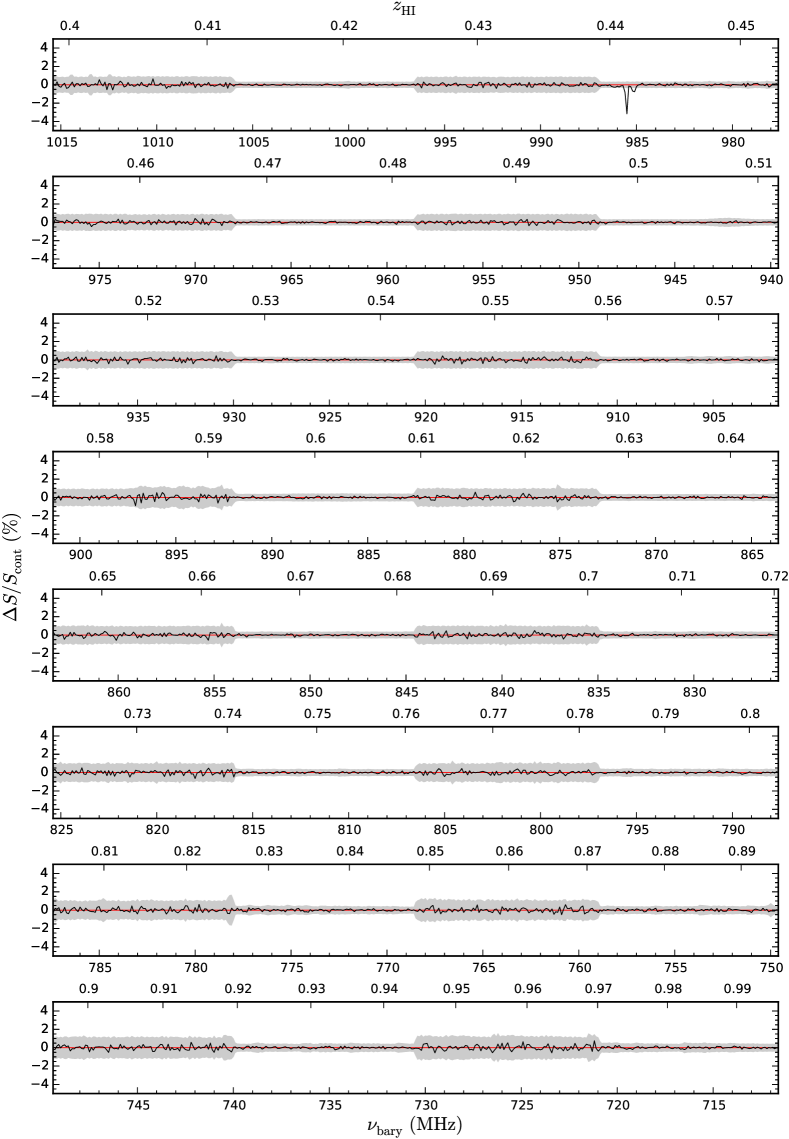
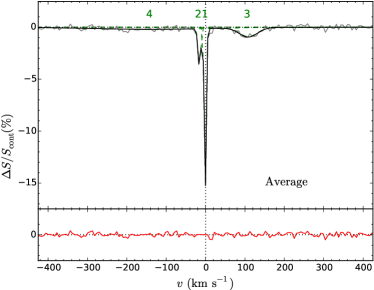
In Fig. 4 we show the resulting full 711.5–1015.5 MHz spectrum towards PKS B1740517, averaged over all three epochs. It is clear that the quality of the spectrum in this band is extremely high and we did not need to excise any large region due to RFI. As described above, only minor birdies were found, and these were due to hardware issues that either have been fixed or will not be present for the full ASKAP system. These observations make us optimistic that ASKAP will be a successful instrument in this frequency range.
3 Results
3.1 HI absorption towards PKS B1740517
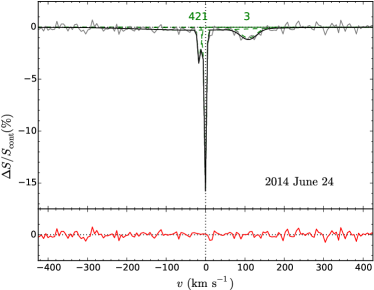
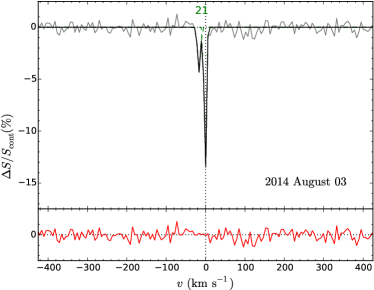
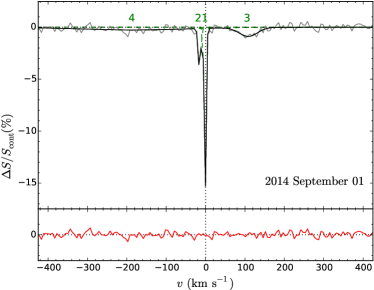
We search for the signature of H i absorption in the BETA data using a spectral line detection and modelling technique based on Bayesian model comparison (see Allison et al. 2014 and references therein). This technique is a robust method of model selection, enabling us to both assign a significance to the detection and compare between increasingly complex model representations of the data. The spectral data are modelled by convolving a physical model of the line, consisting of multiple Gaussian components, with the known gain response of the fine filterbank channels. Using this method we detect a single absorption line in the 21-cm spectrum of PKS B1740517, located at an observed frequency of 985.5 MHz, equal to a H i redshift of . By sequentially increasing the number of Gaussian components, and comparing the Bayes factors, we arrive at a best-fitting spectral model for each of our observing epochs, and for the average spectrum. In Table 2 we summarize the model parameters and in Fig. 5 we show the best fitting Gaussian components and the total model.
We find that the combined data are best fitted by four components, corresponding to two narrow components (widths 5 and 8 km s-1) at the position of peak absorption and two broad components (widths 50 and 350 km s-1), which are, respectively, redshifted and blueshifted with reference to the peak absorption. The latter blueshifted broad component, with a peak at approximately 0.2 per cent of the continuum, is arguably the most tentative. However, we believe the veracity of this detection for the following reasons: (a) the inclusion of this component is strongly warranted by the data above the formal noise, with an increase in log evidence of and a decrease in reduced chi-squared for the best-fitting model parameters of ; (b) other such features are not present elsewhere, either in this spectrum or other sources in the field (see Section 3.3); (c) the feature is stable to changes in our continuum subtraction procedure. While formally detected above the noise, the peak strength of this feature is weak and further observations are needed for confirmation. We discuss the possible physical interpretations of these results in Section 5.
3.2 Spectral variability
Our observations with BETA were carried out in three separate epochs with adjacent intervals of 40 and 29 d. Over these time intervals we can test for variability of the individual spectral components. Limited observational evidence in the literature indicates that per cent stochastic fluctuations may occur in the relative fluxes of some H i absorption components on time-scales of days to several weeks; prominent examples are the two intervening absorption systems towards the flat-spectrum quasars AO 0235+164 (Wolfe et al. 1982) and PKS B1127145 (Kanekar & Chengalur 2001), which exhibit flux variation but no significant shift in position or width. Several possible models exist to explain such behaviour, which include motion of radio source components with respect to the foreground absorber (Briggs 1983), interstellar scintillation in the Milky Way Galaxy (Macquart 2005), and microlensing of the background source (Lewis & Ibata 2003). Due in part to limited channel sampling of the strongest absorption components, our data are sensitive (at 3 ) to fractional variations in the optical depth of only 30 per cent over a 2 month interval. For a background source traversing the absorber at a velocity close to the speed of light, our data are sensitive to fluctuations in the 21-cm opacity of more than 30 per cent on transverse scales less than 0.05 pc. If we consider instead the case of interstellar scintillation, for an absorber at , the required physical scales are much less than a few parsecs. Since we find no significant evidence for variability in the component parameters given in Table 2 this suggests that the bulk of the cold H i gas in these components is distributed uniformly over parsec scales, consistent with that found in Local Group galaxies (c.f. 100 pc; Braun 2012) and radio galaxies (Curran et al. 2013a). Given our time sampling of approximately a month, it is also possible that significant scintillation may occur on day and intraday time-scales to which our data are not yet sensitive.
3.3 Intervening absorption towards other sources
The field of view available with nine PAF beams enables a wider search for intervening H i absorption in the spectra of multiple sources. Based on a nominal noise per channel of 20 mJy beam-1 for the data averaged over all three observations, we searched the spectra of 72 sources brighter than 100 mJy within 1° of each beam centre, selected from the SUMSS (Mauch et al. 2003) and MGPS-2 (Murphy et al. 2007) catalogues, giving a 5 detection limit for absorption against the weakest sources at the beam centre. Using the spectral-line finding technique of Allison et al. (2014) we found no further H i absorption in the spectra of radio sources in this field i.e. all spectra are consistent with the noise.
We can estimate the expected number of intervening absorbers with a column density greater than by
| (3) | |||||
where is the frequency distribution of systems with column density and is the comoving path length given (in a flat CDM universe) by
| (4) |
To estimate as a function of redshift we perform a simple linear interpolation between distributions measured for the local Universe (Zwaan et al. 2005) and at (Noterdaeme et al. 2009).
For each sight line towards our 72 sources we calculate the comoving path interval by
| (5) |
where is the column density sensitivity for detection of an absorption line as a function of spectral channel, and is the channel separation in redshift. Given that the BETA spectra span a wide redshift interval, and that absorption can only be detected between the source and observer, we must also take into consideration the distribution of source redshifts. We therefore use the following redshift distribution model of de Zotti et al. (2010)
| (6) |
which is determined from the population of radio sources brighter than 10 mJy at 1.4 GHz. For any given sight line, the probability of the source being located at a redshift beyond is equal to
| (7) |
and so the expected value for the absorption comoving path length probed by each spectral channel is given by
| (8) |
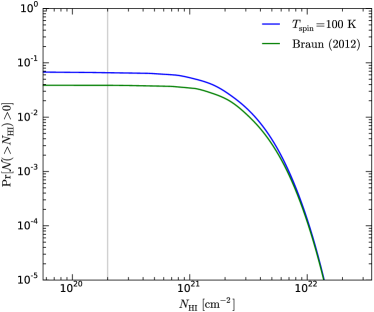
We consider two models that convert the observed spectrum (in units of fractional absorption) to the column density sensitivity. First we use a simple conversion assuming line-of-sight gas of spin temperature K, covering factor and velocity FWHM km s-1. The column density sensitivity is then given by
| (9) |
where is the optical depth sensitivity estimated from the spectral noise per channel and assuming a covering factor of unity. In the case of our second model we use a simple two-phase sandwich geometry for the gas where the cold neutral medium (CNM; K) is sandwiched by a layer of warm neutral medium (WNM; K), which acts as a shield from local high energy UV and X-ray radiation (for further details see Kanekar et al. 2011 and Braun 2012). In this case the column density sensitivity is given by
| (10) |
where is the threshold column density of WNM at which the CNM can form, and is the saturation column density as the optical depth in CNM tends to infinity. We use values for these parameters of cm-2 and cm-2, obtained by Braun (2012) from model fitting to detailed 21-cm observations of the Milky Way Galaxy, Messier 31 and the Large Magellanic Cloud.
The probability of detecting absorbers with column densities greater than is then given by
| (11) |
where is the expected number of absorbers given by Equation 3. Based on the above models of the H i gas we expect to detect less than intervening absorption systems with column densities greater than about cm-1, with a corresponding probability of less than for detecting at least one such system (see Fig. 6). Therefore the lack of any intervening detection in our data is consistent with the known distributions of H i in the local and distant Universe.
4 Multi-wavelength follow-up
4.1 Optical spectroscopy with Gemini-South
4.1.1 Observations and data analysis
| Line | (flux) | Equivalent width | (luminosity) |
|---|---|---|---|
| (erg s-1 cm-2) | (Å) | (erg s-1) | |
| [O ii] | |||
| H | |||
| [O iii] | |||
| [O iii] | |||
| [O i] |
As discussed in Section 2.2, prior to our observations with the BETA telescope the redshift of the optical counterpart to PKS B1740517 was not well known, with no spectroscopically determined value available from the literature. Furthermore, the H i redshift did not match any of the published photometric estimates. The interpretation of the observed absorption required an accurate knowledge of the host galaxy redshift, so that the H i gas could be associated either with the host galaxy of the radio source or with an intervening system.
We therefore obtained time from Gemini-South under the Director’s Discretionary Time program (proposal code GS-2014B-DD-2) to acquire long-slit spectroscopy and -band imaging with the Gemini Multi-Object Spectrograph (GMOS; Hook et al. 2003). The long-slit spectroscopy was taken with the R400 grating, utilizing two grating settings with central wavelengths 7000 and 7050 Å. This was chosen to put the H and [O iii] lines in the centre of the spectrum for a host redshift equal to that of the H i absorption. At each grating setting we obtained s exposures, giving a total exposure time of 1.5 h. A 1.5-arcsec slit was used, and the CCD was binned on-chip.
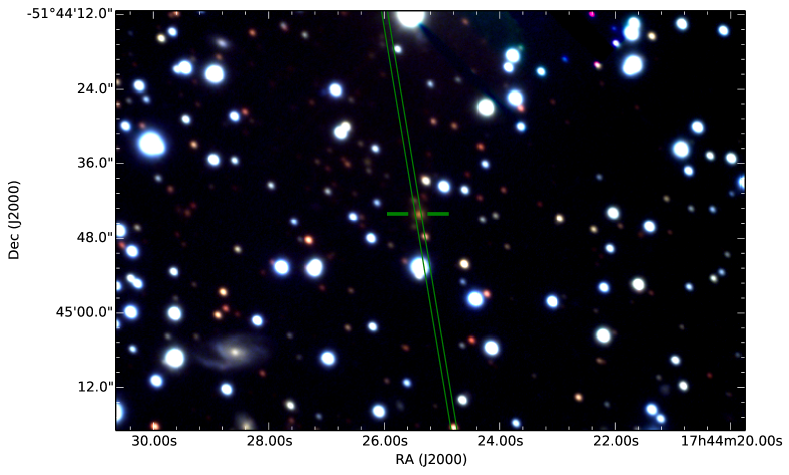
The spectra were reduced in IRAF, using standard techniques within the Gemini package. The spectra were bias-subtracted and flat-fielded using calibration frames from the Gemini Facility Calibration Unit (GCAL). Wavelength calibration made use of Cu-Ar comparison spectra, and the spectrum was flux calibrated using observations of the standard star Feige 110. We estimate an rms error of 0.9 Å in the wavelength calibration, based on the spread in the Cu-Ar lines. We also acquired images with GMOS in the bands. Each image consisted of s exposures, which were binned on-chip, giving a pixel scale of 0.16 arcsec pixel-1. A three-colour image ( as blue, as green and as red) is shown in Fig. 7. Adjusting the original astrometry of the Gemini image using the -band image from the SuperCosmos Sky Survey (Hambly et al. 2001) we find that the centroid position of the large central galaxy (indicated by the solid horizontal bars in Fig. 7) agrees with the ICRF2 position of PKS B1740517 to within 0.6 arcsec.
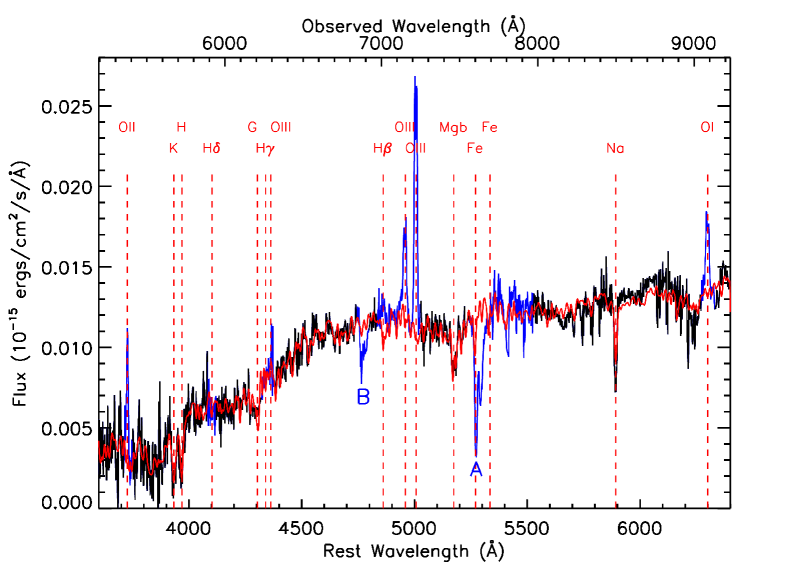
The full GMOS spectrum is shown in Fig. 8 with a measured FWHM spectral resolution of 11 Å from fitting the Cu-Ar arc spectra. Clearly apparent are the [O iii] doublet, the [O ii] and [O i] emission lines, all consistent with a redshift that matches the H i absorption. There is also evidence of [O iii] emission. However, it is contaminated by subtraction of the 6300 Å sky line and so we cannot infer accurate kinematics for this line. We note that there is almost no sign of Balmer-line emission, with weak H at Å and H redshifted out of the observed band. In order to obtain an estimate of the systemic redshift of the host galaxy, we use the Penalized Pixel-Fitting method (pPXF; Cappellari & Emsellem 2004) to fit stellar population synthesis models (Vazdekis et al. 2010) to the underlying stellar continuum. Using this method we obtain a systemic redshift of , where the uncertainty is derived by summing in quadrature the formal error due to the noise () and the wavelength calibration (). We therefore conclude that the H i absorption system seen towards PKS B1740517 is intrinsic to the galaxy hosting the radio AGN.
4.1.2 Emission line ratios and kinematics
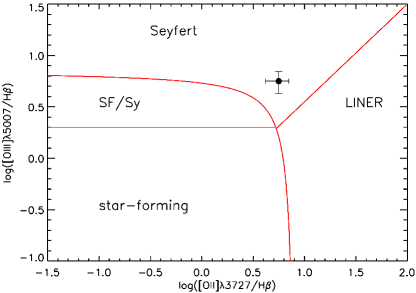
In Table 3 we summarize the properties of individual emission lines seen in the Gemini spectrum, where the fluxes and equivalent widths are estimated from fitting Gaussian models to the emission lines after subtraction of the best-fitting stellar population models. The continuum level, used in calculating the equivalent width, is measured adjacent to the relevant line from the original unsubtracted spectrum. Equivalent width ratios of [O iii]/H = and [O ii]H = place PKS B1740517 in the Seyfert region of the blue classification diagram for redshifted emission line galaxies (Fig. 9; Lamareille 2010). The [O i] line is particularly strong ([O i]/[O iii] = ), which in combination with the parity in strength of the [O iii] and [O ii] lines could be an indicator of Low-Ionization Nuclear Emission line Region (LINER; Heckman 1980) behaviour. Strong [O i] and [O iii] emission arise from excitation by fast shocks (300 – 500 km s-1), which also indicates possible interaction between the radio jets and interstellar gas (Dopita & Sutherland 1995).
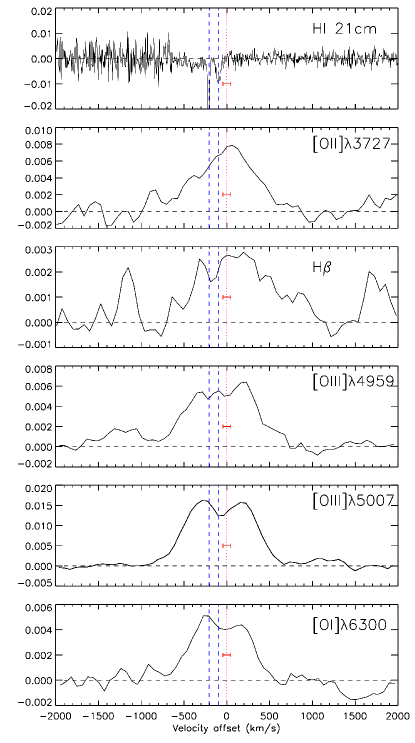
In Fig. 10 we show the velocity structure of the optical emission lines (after subtraction of the fitted stellar component) in the rest frame defined by the systemic redshift. Despite the low spectral resolution (ranging from 350 to 650 km s-1 across the observed band), there is strong evidence for double-peaked structure in the [O iii] and [O i] emission lines. In particular, the high S/N [O iii] line clearly shows two peaks separated by a velocity of approximately 500 km s-1. Conversely, the strong [O ii] line appears to have only a single peak at the systemic velocity, but is at much lower S/N than the two [O iii] lines and is likely confused by the unresolved doublet.
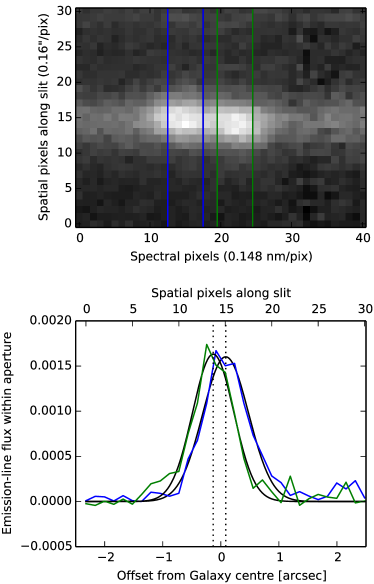
The relative strength of the narrow oxygen and H lines strongly indicate that the emission is dominated by gas ionized by the AGN, rather than star formation. So far only a few AGN with double-peaked [O iii] lines have been reported in the literature (Liu et al., 2010; Smith et al., 2010; Shen et al., 2011), and their origin has largely been ascribed to kinematic effects within a single, rather than binary, AGN (see Fu et al. 2012). In Fig. 11 we show the spatial distribution of the [O iii] line along the slit, which exhibits a clear separation of 0.22 arcsec (1.3 kpc at ) between the peaks. Such behaviour could be due to an outflow of AGN-driven gas (e.g Fischer et al. 2011), perhaps even directly as a result of radio jet–cloud interaction (e.g. Stockton et al. 2007; Rosario et al. 2010), but could also be due to kpc-scale rotation of the ionized gas. While detection of an ionized outflow would be typical of the host galaxy of a powerful compact radio source, the large scale seen here would be at odds with other GPS sources, where ionized outflows are seen on the same scale as the radio jet (e.g. Holt et al. 2009). Several recent integral field spectroscopic (IFS) observations of luminous (radio-quiet) Type II AGN (e.g. Liu et al. 2013; Harrison et al. 2014; McElroy et al. 2015) have confirmed the prevalence of large-scale AGN-driven winds. A similar spatially resolved IFS study of the narrow line emission would confirm the origin of the ionized gas kinematics in PKS B1740517.
4.2 Archival data from XMM-Newton
4.2.1 Data analysis
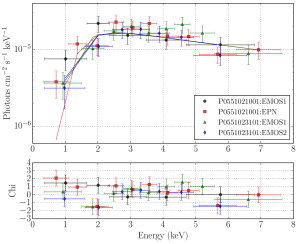
By matching the ICRF2 position of PKS B1740517 to sources listed in the 3XMM-DR4 XMM-Newton Serendipitous Source Catalogue, we found a bright X-ray source, 3XMM J174425.3514444, at an angular separation of 1 arcsec. This field was serendipitously observed as part of targeted observations towards HD 160691, a fifth-magnitude star also known as Arae, which is 5.9 arcmin away from PKS B1740517. Via the XMM-Newton Science Archive777\urlhttp://xmm.esac.esa.int/xsa/, we obtained four X-ray spectra of PKS B1740517 (see Fig. 12), from two separate observations of integration time 7800 and 11 700 s, and fitted these simultaneously using the modelling package XSPEC (Arnaud, 1996). We found that the X-ray spectra are well fitted by a standard absorbed power-law model. Because of the relatively low Galactic latitude of , we incorporate an additional fixed absorption component in our model due to the Galactic foreground, estimated within XSPEC to be . Using this model, we obtain an estimate of the intrinsic column density towards PKS B1740517 of , a photon index of and a 1 keV normalization of photons cm-2 s-1 keV-1. While the intrinsic column density is consistent with that measured for other X-ray observed GPS radio sources, the photon index is harder888, for the sample of 16 X-ray observed GPS sources discussed by Tengstrand et al. (2009)., possibly indicating an obscured Compton-thick AGN, similar to that seen for PKS B1607+26 (Tengstrand et al. 2009). If the observed spectrum is indeed arising from reflection of the primary X-ray emission off a Compton-thick obscuring medium, then sight-lines to the AGN may instead have column densities in excess of cm-2. Using the above best fitting model to the XMM-Newton spectra we estimate an X-ray luminosity of erg s-1, consistent with the distribution of luminosities measured for other GPS radio sources (Tengstrand et al. 2009).
4.2.2 An X-ray upper limit on the HI spin temperature
Combining the X-ray derived total column density of elemental hydrogen and the 21-cm opacity data allows us to estimate an upper limit on the H i spin temperature, and compare this with direct measurements of the spin temperature in other galaxies. In the absence of any H i emission, the 21-cm optical depth is given by
| (12) |
where is the change in flux density due to absorption, is the continuum flux density and is the covering factor, i.e. the fraction of background source obscured by the foreground absorber. The column density of H i gas (in units of atoms cm-2) is then given by
| (13) |
where is the 21-cm spin temperature (in units of K) and is the rest-frame velocity integrated optical depth (in units of km s-1). For sight lines where several gas components may exist at different spin temperatures, is the column-density-weighted harmonic mean over those components. Assuming that the 21-cm and X-ray spectra probe similar sight lines through the gas, an upper limit on the spin temperature can be obtained from
| (14) |
where is the total column density of elemental hydrogen (in atomic, ionized and molecular form) estimated from the XMM-Newton spectra.
We estimate the 21-cm optical depth from our BETA data using Equation 12, which of course depends on the value we adopt for the covering factor (. Assuming a covering factor of unity (which gives a lower limit to the optical depth and hence a spin temperature upper limit), our best estimate of the total integrated optical depth from the average BETA spectrum is km s-1. Based on the column density of total hydrogen derived from a simple absorbed power-law model of the X-ray spectra, we obtain an upper limit on the spin temperature of K. The large fractional uncertainty in the X-ray derived results in a poor constraint on this upper limit, yet is consistent with other direct measurements of extragalactic spin temperatures, both from 21-cm observations of known damped Ly absorption systems towards quasars (Curran 2012; Kanekar et al. 2014) and by combining the intrinsic H i absorption in quasars with extinction estimates from their optical continuum (e.g. PKS B1549790; Holt et al. 2006). While this agreement is reassuring, the assumption of similar sight lines to the radio and X-ray sources is tentative at best, depending on the extent of the radio source and mechanism generating the X-ray emission.
5 Discussion
The H i absorption line profiles associated with radio galaxies are typically complex, encoding small-scale variation in both the 21-cm opacity and the background source structure that are often difficult to disentangle and accurately model. However, we can attempt to overcome this by amalgamating information from the integrated H i spectrum, the radio continuum and any available multiwavelength data. In the following we discuss the inferred properties of the background radio source, followed by the individual components seen in the absorption spectrum and their most likely physical interpretation.
5.1 Properties of the background radio source
PKS B1740517 is a powerful young GPS radio source, which through optical imaging and spectroscopy we have established is hosted by a luminous Seyfert galaxy at . A least-squares fit to the spectral energy distribution (SED) shown in Fig. 1 yields a spectral age of approximately yr, where we have assumed an equipartition magnetic field (Murgia 2003). From VLBI observations, King found that the 2.3-GHz flux density is contained within two 10 mas-scale radio components, in a ratio of approximately of 3.9 to 1 (King, 1994). The angular separation of the two components is 52 mas, corresponding to a physical scale of pc. From the integrated SED alone we cannot confirm whether the components represent hot-spots associated with two jets or a core and jet. In previous VLBI studies of compact sources (Stanghellini et al. 1997; Snellen et al. 2000; de Vries et al. 2009) it was found that GPS radio sources associated with galaxies (as opposed to quasars) tend to exhibit compact double (CD) or compact symmetric object (CSO) morphologies. In the following discussion we therefore assume that the VLBI-scale structure seen in this source represents radio emission associated with jet hotspots, but cannot rule out the possibility of a core and jet without further spectral information for the two source components.
The brightness asymmetry of the two jet components could be either caused by an intrinsic difference in the radio luminosity, possibly resulting from an inhomogeneous circumnuclear medium, or by an orientation effect. In the latter case we can estimate the angle at which the radio jet axis is inclined to the line-of-sight, as follows
| (15) |
where is the brightness ratio, is the spectral index and is the bulk Lorentz factor in the jet. Assuming that the intrinsic luminosities of the two jet components are equal and that , (and a typical Lorentz factor in the range ), we estimate that the jet axis is inclined by with respect to the line-of-sight, giving a jet axis radius of pc. Based on the spectral age we estimate an average separation velocity of approximately 0.4 over the lifetime of the radio AGN, consistent with directly measured expansion velocities of similarly powerful GPS and CSS sources (see de Vries et al. 2009 and references therein). The combined linear size, X-ray luminosity and 5-GHz radio luminosity999For comparison with the literature we define the 5-GHz luminosity as , where is the rest-frame frequency and is the luminosity density. ( erg s-1) are all typical of other GPS radio sources in the literature (e.g. Tengstrand et al. 2009).
5.2 The cold neutral gas in PKS B1740517
5.2.1 Absorption components 1 and 2
Absorption components 1 and 2 in the BETA spectrum have similar velocities and may either be separate cold clouds of H i or the same structure seen against both source components. With a width of km s-1, the deep component is unusually narrow for extragalactic H i absorption associated with the host galaxies of radio AGN101010Borthakur et al. (2014) also found very narrow intervening absorption through the dwarf galaxy UCG 7408 ( km s-1), corresponding to cold gas at a kinetic temperature of K.. Typical widths often range from more than 10 to 1000 km s-1 and are largely attributed to turbulent and bulk motion of gas that is either rotating or radially outflowing/infalling with respect to the nucleus (see e.g. Allison et al. 2013, Geréb et al. 2015 and references therein). Narrow absorption is often found near to the systemic velocity and thought to be associated with gas in a regularly rotating structure, such as a disc or ring, through which a single sight line to a compact radio source picks out the velocity dispersion.
In Fig. 10 we compare the velocity structure of the H i absorption and optical emission lines. The prominent narrow component is blue shifted by approximately km s-1 with respect to the systemic velocity and also the dynamical centre of the [O iii] emission lines. Assuming that the radio source is co-spatial with the AGN, this offset would indicate that the gas is either rotating or outflowing radially towards the observer from the nucleus. A similar 200 km s-1 velocity offset is seen for narrow H i absorption ( km s-1) in the nearby Seyfert 2 galaxy NGC 2110. Detailed modelling by Gallimore et al. (1999) showed that the absorbing gas is located in a -pc disc, close to the radio source and with similar orientation to the jet axis. The velocity offset seen here would also suggest that the separation of the gas and radio source is small, indicating a location that is pc away from the central nucleus. Since a jet-driven radial outflow would likely result in significant turbulence of the gas, and therefore the narrow absorption would represent an intact cloud that has become entrained, it is more likely that we are seeing absorption through a foreground structure.
It is also possible that an unforeseen systematic error in the Gemini spectrum (e.g. contamination from dust obscuration) may have caused an artificial offset between the optical redshift and the narrow absorption. If the narrow feature is instead at the systemic velocity, this would place the absorbing gas at a distance much further out in the galaxy (similar to PKS 1814637; Morganti et al. 2011), and would represent tangentially rotating gas seen in absorption against the central radio AGN. Similarity between the line ratios of absorption components 1 and 2 and the flux densities of the radio components would also suggest lines of sight to each. Under this scenario the distance of the absorbing gas from the nucleus would simply be given by
| (16) |
where is the physical separation of the two radio components, is the rotational velocity of the gas (assumed to be km s-1) and is the velocity separation of the two absorption components. However, there is no obvious evidence of the effect of dust obscuration in the Gemini data and verifying this would require deeper optical imaging and resolved spectroscopy.
The peak H i component is sufficiently narrow that we can estimate a reasonable upper limit on the kinetic temperature of the gas. We use the following relationship between the temperature and line width
| (17) |
where is the FWHM of the spectral line, is the mass of a hydrogen atom and is the Boltzmann constant. Given that turbulent motion of the gas will result in line broadening, we expect that the true kinetic temperature could be significantly less than this and in a phase similar to the CNM of the Milky Way (– K; Wolfire et al. 2003). Assuming that the gas is dense enough to be collisionally excited, the kinetic temperature is a reasonable proxy for the H i spin temperature, and provides a stronger constraint than the X-ray upper limit derived in Section 4.2.2. However, irradiation by UV emission from the AGN and continuum emission from the powerful radio source may drive the spin temperature to much higher values (Bahcall & Ekers 1969). Given the high luminosity of the radio source, and the fact that we detect H i absorption, we find it improbable that the spin temperature could be dominated by 21-cm radiation. We therefore assume that the gas is sufficiently dense and/or shielded from the continuum to be collisionally excited, but acknowledge that otherwise the spin temperature could be an order of magnitude higher than the kinetic temperature.
If the peak absorption is located in front of the fainter radio component it would imply that all of the radio flux is being absorbed (given the flux ratio of 3.9 to 1 at 2.3 GHz), in which case we would expect the profile to be saturated. Given that the ASKAP spectral channels do not fully sample this narrow line111111Making this system an excellent future target for proposed high spectral resolution zoom modes with the SKA pathfinders., we cannot adequately resolve the profile to test for saturation. However, resolved H i absorption lines associated with radio AGN do not typically exhibit saturation and such a scenario would indicate that the gas here is considerably colder than the upper limit given in Equation 17. We therefore favour the scenario that the peak absorption is seen in front of the brighter radio source. In which case the H i covering factor of the total radio flux is , and so the velocity integrated optical depth for the deep component is km s-1. Using the above upper limit to the kinetic temperature, and the relationship given by Equation 13, we estimate a corresponding column density of cm-2. The angular size of the brighter radio component measured by King (1994) is mas mas (at 2.3 GHz), which at a redshift of equates to a physical scale of pc2. We therefore estimate a mass of for the foreground gas cloud. Uncertainties in the spin temperature and covering factor mean that the column density and mass could be an order of magnitude larger.
5.2.2 Absorption components 3 and 4
Component 3 (Fig. 5) is consistent with the dynamical centre of the [O iii] emission and offset by approximately km s-1 with respect to the systemic velocity. Its width ( km s-1) is comparable with H i absorption often seen through the inclined discs of nearby Seyfert galaxies (e.g. Dickey 1982; Gallimore et al. 1999; Allison et al. 2014). It is likely that component 3 is arising from tangentially rotating H i gas in a disc or ring, which would give a radial velocity close to that of the system. On the other side of the absorption complex we tentatively see a weak, broad 300 km s-1 feature (component 4) shifted by km s-1 with respect to the system. Such a profile is typical of jet-driven neutral outflows seen in the host galaxies of other powerful radio AGN and we discuss this further in Section 5.3.
Under the alternative scenario discussed above, whereby the deep narrow absorption is actually at the systemic redshift (and an unknown systematic error is causing a velocity offset), we infer a similar model to that of PKS B1814637 (Morganti et al. 2011), where the narrow absorption is arising from gas in the larger galaxy and the broader features are the result of a rotating circumnuclear disc close to the radio source. However, there is no evidence so far to suggest that the optical redshift is being corrupted by a systematic error, and further observations at higher spatial and spectral resolution would shed light on this possibility.
5.3 A possible jet-driven neutral gas outflow
Jet-driven neutral gas outflows are direct indicators of the feedback between a powerful radio AGN and the surrounding ISM (Hardcastle et al. 2007). Gas outflows are found to be ubiquitous in the host galaxies of powerful compact radio AGN, and signify the growth of the source as it expands through a natal cocoon of dust and gas (e.g. Holt et al. 2009). In the case of PKS B1740517, absorption component 4 (Fig. 5) may represent a neutral gas outflow that is being driven by the approaching jet as it drives into the circumnuclear gas. The mass outflow rate of the neutral gas can be estimated by assuming a simple superwind model (Heckman et al. 2000):
| (18) |
where is the solid angle into which the gas is flowing (assumed to be ), is the radius, is the velocity of the outflow, and is the column density of H i gas. Using an outflow velocity of km s-1 and a column density estimate of cm-2, which assumes that the outflowing gas has a similar spin temperature to that of the narrow absorption, we estimate an outflow rate of 1 yr-1. This is strongly dependent upon our assumptions about the geometry and spin temperature of the gas, and we note that the outflow rate may be an order of magnitude higher. Within this framework the narrow absorption may either represent unperturbed circumnuclear gas or a dense cloud that has become entrained in the outflow.
6 Conclusion and future prospects
Using commissioning data from the six-antenna BETA of ASKAP we have discovered H i 21-cm absorption that is intrinsic to the host galaxy of the powerful compact radio source PKS B1740517. Our result demonstrates the excellent potential of ASKAP to search for H i in a continuous redshift range of 0.4 – 1.0, equivalent to look back times in the range 4.2 – 7.7 Gyr. Such a capability is made possible by the excellent radio quiet environment of the observatory site at these frequencies. Furthermore, the detection and characterization of a complex absorption profile is very encouraging for the study of the neutral environments of radio AGN in future wide-field, broad-band absorption surveys with ASKAP and other SKA pathfinders.
Optical spectroscopy with the 8-m Gemini-South telescope confirms that the H i absorption is intrinsic to the host galaxy of the radio source. The galaxy has a luminous active nucleus, with several forbidden oxygen lines exhibiting double-peaked structure on large-scales that indicate possible AGN-driven outflows of ionized gas. Archival data from the XMM-Newton satellite show that the soft X-ray emission is absorbed by a dense obscuring medium, possibly Compton thick. The profile of the H i line is complex and exhibits the typical narrow and broad features associated with absorption in the host galaxy of a compact radio AGN. Based on the significantly blueshifted broad absorption we conclude that PKS B1740517 represents a recently triggered radio source ( yr) in which the jets are breaking through the surrounding cocoon of dense circumnuclear gas. This object requires further study, with spatially resolved optical and 21-cm spectroscopy, and deeper optical imaging, to fully understand the neutral and ionized gas kinematics.
Acknowledgements
We thank Sean Farrell, Davide Burlon, Rebecca McElroy and David Parkinson for useful discussions. We also thank the anonymous referee and Flornes Yuen for useful comments that help to improve this paper.
The Australian SKA Pathfinder is part of the Australia Telescope National Facility which is managed by CSIRO. Operation of ASKAP is funded by the Australian Government with support from the National Collaborative Research Infrastructure Strategy. Establishment of the Murchison Radio-astronomy Observatory was funded by the Australian Government and the Government of Western Australia. ASKAP uses advanced supercomputing resources at the Pawsey Supercomputing Centre. We acknowledge the Wajarri Yamatji people as the traditional owners of the Observatory site.
Supporting observations were obtained at the Gemini Observatory, which is operated by the Association of Universities for Research in Astronomy, Inc., under a cooperative agreement with the NSF on behalf of the Gemini partnership: the National Science Foundation (USA), the National Research Council (Canada), CONICYT (Chile), the Australian Research Council (Australia), Ministério da Ciência, Tecnologia e Inovação (Brazil) and Ministerio de Ciencia, Tecnología e Innovación Productiva (Argentina). X-ray data were based on observations obtained with XMM-Newton, an ESA science mission with instruments and contributions directly funded by ESA member states and NASA.
JRA acknowledges support from a Bolton Fellowship. RM gratefully acknowledges support from the European Research Council under the European Union’s Seventh Framework Programme (FP/2007-2013) ERC Advanced Grant RADIOLIFE-320745. Parts of this research were conducted by the Australian Research Council Centre of Excellence for All-sky Astrophysics (CAASTRO), through project number CE110001020. We have made use of Astropy, a community-developed core Python package for astronomy (Astropy Collaboration, 2013); the NASA/IPAC Extragalactic Database (NED) which is operated by the Jet Propulsion Laboratory, California Institute of Technology, under contract with the National Aeronautics and Space Administration; NASA’s Astrophysics Data System Bibliographic Services; the SIMBAD data base and VizieR catalogue access tool, both operated at CDS, Strasbourg, France.
The authors would also like to acknowledge the large group of people who have contributed to the planning, design, construction and support of BETA and ASKAP. This includes: Kerry Ardern, Brett Armstrong, Jay Banyer, Samantha Barry, Tim Bateman, Ron Beresford, Brayden Briggs, Kate Brooks, Graeme Carrad, Ettore Carretti, Frank Ceccato, Raji Chekkala, Kate Chow, Geoff Cook, Paul Cooper, Evan Davis, Ludovico de Souza, Jack Dixon, Peter Duffy, Troy Elton, Brian Jeffs, Alex Harding, George Hobbs, Ron Koenig, Arkadi Kosmynin, Tom Lees, Amy Loke, Li Li, Stacy Mader, Tony Maher, Neil Marston, Vincent McIntyre, Ian McRobert, Samantha Mickle, Ray Moncay, Neale Morison, John Morris, Tony Mulry, Alan Ng, Wilfredo Pena, Nathan Pope, Brett Preisig, Lou Puls, Michael Reay, Ken Reeves, Adrian Rispler, Victor Rodrigues, Daniel Roxby, Tim Ruckley, Craig Russell, Aaron Sanders, Ken Smart, Mark Wieringa, Tim Wilson, Kjetil Wormnes and Xinyu Wu.
We would finally like to acknowledge the contributions of the ASKAP survey science teams, represented by the following group leaders: Shami Chatterjee, John Dickey, Bryan Gaensler, Peter Hall, Tom Landecker, Martin Meyer, Tara Murphy, Ingrid Stairs, Lister Staveley-Smith, Russ Taylor and Steven Tingay.
References
- Allison et al. (2012) Allison J. R. et al., 2012, MNRAS, 423, 2601
- Allison et al. (2013) Allison J. R., Curran S. J., Sadler E. M., Reeves S. N., 2013, MNRAS, 430, 157
- Allison et al. (2014) Allison J. R., Sadler E. M., Meekin A. M., 2014, MNRAS, 440, 696
- Arnaud (1996) Arnaud K. A., 1996, in ASP Conf. Ser., Vol. 101, Astronomical Data Analysis Software and Systems V, Jacoby G. H., Barnes J., eds., Astron. Soc. Pac., San Francisco, p. 17
- Bahcall & Ekers (1969) Bahcall J. N., Ekers R. D., 1969, ApJ, 157, 1055
- Blain et al. (2013) Blain A. W. et al., 2013, ApJ, 778, 113 (erratum: ApJ, 782, 58)
- Booth et al. (2009) Booth R. S., de Blok W. J. G., Jonas J. L., Fanaroff B., 2009, arXiv:0910.2935
- Borthakur et al. (2014) Borthakur S., Momjian E., Heckman T. M., York D. G., Bowen D. V., Yun M. S., Tripp T. M., 2014, ApJ, 795, 98
- Braun (2012) Braun R., 2012, ApJ, 749, 87
- Briggs (1983) Briggs F. H., 1983, ApJ, 274, 86
- Burgess & Hunstead (2006) Burgess A. M., Hunstead R. W., 2006, AJ, 131, 114
- Campbell-Wilson & Hunstead (1994) Campbell-Wilson D., Hunstead R. W., 1994, Proc. of the Astro. Soc. Aust., 11, 33
- Cappellari & Emsellem (2004) Cappellari M., Emsellem E., 2004, PASP, 116, 138
- Carilli et al. (1998) Carilli C. L., Menten K. M., Reid M. J., Rupen M. P., Yun M. S., 1998, ApJ, 494, 175
- Catinella et al. (2008) Catinella B., Haynes M. P., Giovanelli R., Gardner J. P., Connolly A. J., 2008, ApJ, 685, L13
- Chandola et al. (2011) Chandola Y., Sirothia S. K., Saikia D. J., 2011, MNRAS, 418, 1787
- Chang et al. (2010) Chang T.-C., Pen U.-L., Bandura K., Peterson J. B., 2010, Nature, 466, 463
- Condon et al. (1998) Condon J. J., Cotton W. D., Greisen E. W., Yin Q. F., Perley R. A., Taylor G. B., Broderick J. J., 1998, AJ, 115, 1693
- Curran (2012) Curran S. J., 2012, ApJ, 748, L18
- Curran et al. (2013a) Curran S. J., Allison J. R., Glowacki M., Whiting M. T., Sadler E. M., 2013a, MNRAS, 431, 3408
- Curran et al. (2011) Curran S. J. et al., 2011, MNRAS, 413, 1165
- Curran et al. (2006) Curran S. J., Whiting M. T., Murphy M. T., Webb J. K., Longmore S. N., Pihlström Y. M., Athreya R., Blake C., 2006, MNRAS, 371, 431
- Curran et al. (2013b) Curran S. J., Whiting M. T., Sadler E. M., Bignell C., 2013b, MNRAS, 428, 2053
- Curran et al. (2008) Curran S. J., Whiting M. T., Wiklind T., Webb J. K., Murphy M. T., Purcell C. R., 2008, MNRAS, 391, 765
- de Vries et al. (2009) de Vries N., Snellen I. A. G., Schilizzi R. T., Mack K.-H., Kaiser C. R., 2009, A&A, 498, 641
- de Zotti et al. (2010) de Zotti G., Massardi M., Negrello M., Wall J., 2010, A&AR, 18, 1
- Deboer et al. (2009) Deboer D. R. et al., 2009, Proc. IEEE, 97, 1507
- Delhaize et al. (2013) Delhaize J., Meyer M. J., Staveley-Smith L., Boyle B. J., 2013, MNRAS, 433, 1398
- di Serego-Alighieri et al. (1994) di Serego-Alighieri S., Danziger I. J., Morganti R., Tadhunter C. N., 1994, MNRAS, 269, 998
- Dickey (1982) Dickey J. M., 1982, ApJ, 263, 87
- Dopita & Sutherland (1995) Dopita M. A., Sutherland R. S., 1995, ApJ, 455, 468
- Emonts et al. (2010) Emonts B. H. C. et al., 2010, MNRAS, 406, 987
- Fanti et al. (1995) Fanti C., Fanti R., Dallacasa D., Schilizzi R. T., Spencer R. E., Stanghellini C., 1995, A&A, 302, 317
- Fey et al. (2009) Fey A., Gordon G., Jacobs C., eds., 2009, The Second Realization of the International Celestial Reference Frame by VLBI, IERS Technical Notes 35. Verlad des Bundesamts fur Kartographie und Geodasie, Frankfurt am Main
- Fischer et al. (2011) Fischer T. C., Crenshaw D. M., Kraemer S. B., Schmitt H. R., Mushotsky R. F., Dunn J. P., 2011, ApJ, 727, 71
- Freudling et al. (2011) Freudling W. et al., 2011, ApJ, 727, 40
- Fu et al. (2012) Fu H., Yan L., Myers A. D., Stockton A., Djorgovski S. G., Aldering G., Rich J. A., 2012, ApJ, 745, 67
- Gallimore et al. (1999) Gallimore J. F., Baum S. A., O’Dea C. P., Pedlar A., Brinks E., 1999, ApJ, 524, 684
- Geréb et al. (2015) Geréb K., Maccagni F. M., Morganti R., Oosterloo T. A., 2015, A&A, 575, A44
- Geréb et al. (2014) Geréb K., Morganti R., Oosterloo T. A., 2014, A&A, 569, A35
- Gregory et al. (1994) Gregory P. C., Vavasour J. D., Scott W. K., Condon J. J., 1994, ApJS, 90, 173
- Gupta et al. (2006) Gupta N., Salter C. J., Saikia D. J., Ghosh T., Jeyakumar S., 2006, MNRAS, 373, 972
- Hambly et al. (2001) Hambly N. C. et al., 2001, MNRAS, 326, 1279
- Hardcastle et al. (2007) Hardcastle M. J., Evans D. A., Croston J. H., 2007, MNRAS, 376, 1849
- Harrison et al. (2014) Harrison C. M., Alexander D. M., Mullaney J. R., Swinbank A. M., 2014, MNRAS, 441, 3306
- Hay & O’Sullivan (2008) Hay S. G., O’Sullivan J. D., 2008, Radio Sci., 43, 6
- Haynes et al. (2011) Haynes M. P. et al., 2011, AJ, 142, 170
- Heald et al. (2011) Heald G. et al., 2011, A&A, 526, A118
- Healey et al. (2007) Healey S. E., Romani R. W., Taylor G. B., Sadler E. M., Ricci R., Murphy T., Ulvestad J. S., Winn J. N., 2007, ApJS, 171, 61
- Heckman (1980) Heckman T. M., 1980, A&A, 87, 152
- Heckman et al. (2000) Heckman T. M., Lehnert M. D., Strickland D. K., Armus L., 2000, ApJS, 129, 493
- Högbom (1974) Högbom J. A., 1974, A&AS, 15, 417
- Holt et al. (2006) Holt J., Tadhunter C., Morganti R., Bellamy M., González Delgado R. M., Tzioumis A., Inskip K. J., 2006, MNRAS, 370, 1633
- Holt et al. (2009) Holt J., Tadhunter C. N., Morganti R., 2009, MNRAS, 400, 589
- Hook et al. (2003) Hook I. et al., 2003, in Proc. SPIE, Vol. 4841, Instrument Design and Performance for Optical/Infrared Ground Based Telescopes, Iye M., Moorwood A. F. M., eds., SPIE, Bellingham, p. 1645
- Hotan et al. (2014) Hotan A. W. et al., 2014, Publ. Astron. Soc. Aust., 31, e041
- Jacobs et al. (2011) Jacobs D. C. et al., 2011, ApJL, 734, L34
- Jauncey et al. (2003) Jauncey D. L. et al., 2003, Publ. Astron. Soc. Aust., 20, 151
- Johnston et al. (2007) Johnston S. et al., 2007, Publ. Astron. Soc. Aust., 24, 174
- Kanekar et al. (2011) Kanekar N., Braun R., Roy N., 2011, ApJL, 737, L33
- Kanekar & Chengalur (2001) Kanekar N., Chengalur J. N., 2001, MNRAS, 325, 631
- Kanekar & Chengalur (2008) Kanekar N., Chengalur J. N., 2008, MNRAS, 384, L6
- Kanekar et al. (2009) Kanekar N., Prochaska J. X., Ellison S. L., Chengalur J. N., 2009, MNRAS, 396, 385
- Kanekar et al. (2014) Kanekar N. et al., 2014, MNRAS, 438, 2131
- King (1994) King E., 1994, PhD thesis, Univ. Tasmania, Hobart
- Koribalski (2010) Koribalski B. S., 2010, in ASP Conf. Ser., Vol. 421, Galaxies in Isolation: Exploring Nature Versus Nurture, Verdes-Montenegro L., Del Olmo A., Sulentic J., eds., Astron. Soc. Pac., San Francisco, p. 137
- Lagos et al. (2014) Lagos C. D. P., Baugh C. M., Zwaan M. A., Lacey C. G., Gonzalez-Perez V., Power C., Swinbank A. M., van Kampen E., 2014, MNRAS, 440, 920
- Lah et al. (2009) Lah P. et al., 2009, MNRAS, 399, 1447
- Lamareille (2010) Lamareille F., 2010, A&A, 509, A53
- Large et al. (1981) Large M. I., Mills B. Y., Little A. G., Crawford D. F., Sutton J. M., 1981, MNRAS, 194, 693
- Lewis & Ibata (2003) Lewis G. F., Ibata R. A., 2003, MNRAS, 340, 562
- Liu et al. (2013) Liu G., Zakamska N. L., Greene J. E., Nesvadba N. P. H., Liu X., 2013, MNRAS, 436, 2576
- Liu et al. (2010) Liu X., Shen Y., Strauss M. A., Greene J. E., 2010, ApJ, 708, 427
- López-Caniego et al. (2007) López-Caniego M., González-Nuevo J., Herranz D., Massardi M., Sanz J. L., De Zotti G., Toffolatti L., Argüeso F., 2007, ApJS, 170, 108
- Macquart (2005) Macquart J.-P., 2005, A&A, 433, 827
- Mahony et al. (2013) Mahony E. K., Morganti R., Emonts B. H. C., Oosterloo T. A., Tadhunter C., 2013, MNRAS, 435, L58
- Massardi et al. (2008) Massardi M. et al., 2008, MNRAS, 384, 775
- Masui et al. (2013) Masui K. W. et al., 2013, ApJ, 763, L20
- Mauch et al. (2003) Mauch T., Murphy T., Buttery H. J., Curran J., Hunstead R. W., Piestrzynski B., Robertson J. G., Sadler E. M., 2003, MNRAS, 342, 1117
- McConnell et al. (2012) McConnell D., Sadler E. M., Murphy T., Ekers R. D., 2012, MNRAS, 422, 1527
- McElroy et al. (2015) McElroy R., Croom S. M., Pracy M., Sharp R., Ho I.-T., Medling A. M., 2015, MNRAS, 446, 2186
- McMullin et al. (2007) McMullin J. P., Waters B., Schiebel D., Young W., Golap K., 2007, in ASP Conf. Ser., Vol. 376, Astronomical Data Analysis Software and Systems XVI, Shaw R. A., Hill F., Bell D. J., eds., Astron. Soc. Pac., San Francisco, p. 127
- Meyer et al. (2004) Meyer M. J. et al., 2004, MNRAS, 350, 1195
- Moffet (1975) Moffet A. T., 1975, in Stars and Stellar Systems, Vol. 9, Galaxies and the Universe, Sandage A., Sandage M., Kristian J., eds., University of Chicago Press, Chicago, p. 211
- Morganti et al. (2013) Morganti R., Fogasy J., Paragi Z., Oosterloo T., Orienti M., 2013, Science, 341, 1082
- Morganti et al. (2011) Morganti R., Holt J., Tadhunter C., Ramos Almeida C., Dicken D., Inskip K., Oosterloo T., Tzioumis T., 2011, A&A, 535, A97
- Morganti et al. (2001) Morganti R., Oosterloo T. A., Tadhunter C. N., van Moorsel G., Killeen N., Wills K. A., 2001, MNRAS, 323, 331
- Morganti et al. (2005) Morganti R., Tadhunter C. N., Oosterloo T. A., 2005, A&A, 444, L9
- Murgia (2003) Murgia M., 2003, Publ. Astron. Soc. Aust., 20, 19
- Murphy et al. (2007) Murphy T., Mauch T., Green A., Hunstead R. W., Piestrzynska B., Kels A. P., Sztajer P., 2007, MNRAS, 382, 382
- Noterdaeme et al. (2012) Noterdaeme P. et al., 2012, A&A, 547, L1
- Noterdaeme et al. (2009) Noterdaeme P., Petitjean P., Ledoux C., Srianand R., 2009, A&A, 505, 1087
- O’Dea (1998) O’Dea C. P., 1998, PASP, 110, 493
- Offringa et al. (2010) Offringa A. R., de Bruyn A. G., Biehl M., Zaroubi S., Bernardi G., Pandey V. N., 2010, MNRAS, 405, 155
- Oosterloo et al. (2010) Oosterloo T. et al., 2010, MNRAS, 409, 500
- Oosterloo et al. (2009) Oosterloo T., Verheijen M. A. W., van Cappellen W., Bakker L., Heald G., Ivashina M., 2009, in Wide Field Astronomy and Technology for the Square Kilometre Array, Torchinsky S. A., van Ardenne A., van den Brink-Havinga T., van Es A. J. J., Faulkner A. J., eds., Proc. Sci.
- Orienti et al. (2006) Orienti M., Morganti R., Dallacasa D., 2006, A&A, 457, 531
- Owsianik & Conway (1998) Owsianik I., Conway J. E., 1998, A&A, 337, 69
- Péroux et al. (2003) Péroux C., McMahon R. G., Storrie-Lombardi L. J., Irwin M. J., 2003, MNRAS, 346, 1103
- Petrov (2013) Petrov L., 2013, AJ, 146, 5
- Pihlström et al. (2003) Pihlström Y. M., Conway J. E., Vermeulen R. C., 2003, A&A, 404, 871
- Planck Collaboration VII (2011) Planck Collaboration VII, 2011, A&A, 536, A7
- Randall et al. (2011) Randall K. E., Hopkins A. M., Norris R. P., Edwards P. G., 2011, MNRAS, 416, 1135
- Rao et al. (2006) Rao S. M., Turnshek D. A., Nestor D. B., 2006, ApJ, 636, 610
- Readhead et al. (1996) Readhead A. C. S., Taylor G. B., Xu W., Pearson T. J., Wilkinson P. N., Polatidis A. G., 1996, ApJ, 460, 612
- Reynolds (1994) Reynolds J., 1994, AT Technical Document AT/39.3/040
- Rhee et al. (2013) Rhee J., Zwaan M. A., Briggs F. H., Chengalur J. N., Lah P., Oosterloo T., Hulst T. v. d., 2013, MNRAS, 435, 2693
- Ricci et al. (2006) Ricci R., Prandoni I., Gruppioni C., Sault R. J., de Zotti G., 2006, A&A, 445, 465
- Rosario et al. (2010) Rosario D. J., Shields G. A., Taylor G. B., Salviander S., Smith K. L., 2010, ApJ, 716, 131
- Sault et al. (1995) Sault R. J., Teuben P. J., Wright M. C. H., 1995, in ASP Conf. Ser., Vol. 77, Astronomical Data Analysis Software and Systems IV, Shaw R. A., Payne H. E., Hayes J. J. E., eds., Astron. Soc. Pac., San Francisco, p. 433
- Schinckel et al. (2012) Schinckel A. E., Bunton J. D., Cornwell T. J., Feain I., Hay S. G., 2012, in Proc. SPIE, Vol. 8444, 84442A
- Serra et al. (2012) Serra P. et al., 2012, MNRAS, 422, 1835
- Shen et al. (2011) Shen Y., Liu X., Greene J. E., Strauss M. A., 2011, ApJ, 735, 48
- Smith et al. (2010) Smith K. L., Shields G. A., Bonning E. W., McMullen C. C., Rosario D. J., Salviander S., 2010, ApJ, 716, 866
- Snellen et al. (2000) Snellen I. A. G., Schilizzi R. T., van Langevelde H. J., 2000, MNRAS, 319, 429
- Stanghellini et al. (1997) Stanghellini C., O’Dea C. P., Baum S. A., Dallacasa D., Fanti R., Fanti C., 1997, A&A, 325, 943
- Stockton et al. (2007) Stockton A., Canalizo G., Fu H., Keel W., 2007, ApJ, 659, 195
- Tadhunter et al. (2014) Tadhunter C., Morganti R., Rose M., Oonk J. B. R., Oosterloo T., 2014, Nature, 511, 440
- Tengstrand et al. (2009) Tengstrand O., Guainazzi M., Siemiginowska A., Fonseca Bonilla N., Labiano A., Worrall D. M., Grandi P., Piconcelli E., 2009, A&A, 501, 89
- Tingay et al. (2003) Tingay S. J., Jauncey D. L., King E. A., Tzioumis A. K., Lovell J. E. J., Edwards P. G., 2003, PASJ, 55, 351
- van der Hulst et al. (2001) van der Hulst J. M., van Albada T. S., Sancisi R., 2001, in ASP Conf. Ser., Vol. 240, Gas and Galaxy Evolution, Hibbard J. E., Rupen M., van Gorkom J. H., eds., Astron. Soc. Pac., San Francisco, p. 451
- van Gorkom et al. (1989) van Gorkom J. H., Knapp G. R., Ekers R. D., Ekers D. D., Laing R. A., Polk K. S., 1989, AJ, 97, 708
- Vazdekis et al. (2010) Vazdekis A., Sánchez-Blázquez P., Falcón-Barroso J., Cenarro A. J., Beasley M. A., Cardiel N., Gorgas J., Peletier R. F., 2010, MNRAS, 404, 1639
- Verheijen et al. (2010) Verheijen M. A. W. et al., 2010, in ISKAF2010 Science Meeting, van Leeuwen J., ed., Proc. Sci.
- Vermeulen et al. (2003) Vermeulen R. C. et al., 2003, A&A, 404, 861
- Wall & Peacock (1985) Wall J. V., Peacock J. A., 1985, MNRAS, 216, 173
- Wall et al. (1975) Wall J. V., Shimmins A. J., Bolton J. G., 1975, Aust. J. Phys. Astrophys. Suppl., 34, 55
- Walter et al. (2008) Walter F., Brinks E., de Blok W. J. G., Bigiel F., Kennicutt, Jr. R. C., Thornley M. D., Leroy A., 2008, AJ, 136, 2563
- Wang et al. (2013) Wang J. et al., 2013, MNRAS, 433, 270
- Wolfe et al. (1982) Wolfe A. M., Briggs F. H., Davis M. M., 1982, ApJ, 259, 495
- Wolfire et al. (2003) Wolfire M. G., McKee C. F., Hollenbach D., Tielens A. G. G. M., 2003, ApJ, 587, 278
- Wright et al. (1994) Wright A. E., Griffith M. R., Burke B. F., Ekers R. D., 1994, ApJS, 91, 111
- Wright et al. (2010) Wright E. L. et al., 2010, AJ, 140, 1868
- Zafar et al. (2013) Zafar T., Péroux C., Popping A., Milliard B., Deharveng J.-M., Frank S., 2013, A&A, 556, A141
- Zwaan et al. (2005) Zwaan M. A., van der Hulst J. M., Briggs F. H., Verheijen M. A. W., Ryan-Weber E. V., 2005, MNRAS, 364, 1467
Author Affiliations
1CSIRO Astronomy and Space Science, PO Box 76, Epping, NSW 1710,
Australia
2Sydney Institute for Astronomy, School of Physics
A28, University of Sydney, Sydney, NSW 2006, Australia
3ARC
Centre of Excellence for All-sky Astrophysics (CAASTRO)
4School
of Chemical and Physical Sciences, Victoria University of Wellington,
PO Box 600, Wellington 6140, New Zealand
5Netherlands Institute
for Radio Astronomy, Postbus 2, NL-7990 AA Dwingeloo, the
Netherlands
6Kapteyn Astronomical Institute, University of
Groningen, Postbus 800, NL-9700 AV Groningen, the
Netherlands
7School of Physical Sciences, University of
Tasmania, Private Bag 37, Hobart Tasmania 7001,
Australia
8European Southern Observatory,
Karl-Schwarzschild-Str. 2, D-85748 Garching, Germany
9SKA
Organisation, Jodrell Bank Observatory, Lower Withington,
Macclesfield, Cheshire, SK11 9DL, UK
10CSIRO Digital
Productivity, PO Box 76, Epping, NSW 1710, Australia
11Radio
Astronomy Laboratory, University of California Berkeley, 501 Campbell,
Berkeley CA 94720-3411, USA
12Radiation Physics Laboratory,
Sydney Medical School, The University of Sydney, NSW 2006,
Australia
13Inter-University Centre for Astronomy and
Astrophysics, Post Bag 4, Ganeshkhind, Pune University Campus, Pune
411 007, India
14Department of Physics and Electronics, Rhodes
University, PO Box 94, Grahamstown 6140, South
Africa
15International Centre for Radio Astronomy Research
(ICRAR), Curtin University, GPO Box U1987, Perth, WA 6845,
Australia
16Research School of Astronomy and Astrophysics,
Australian National University, Mount Stromlo Observatory, Cotter
Road, Weston Creek, ACT 2611, Australia
17International Centre
for Radio Astronomy Research (ICRAR), The University of Western
Australia, 35 Stirling Hwy, Crawley, WA 6009, Australia
18School
of Physics, University of Melbourne, Victoria 3010,
Australia
19Leiden Observatory, Leiden University, PO Box 9513,
NL-2300 RA Leiden, the Netherlands