11email: csanchez@cab.inta-csic.es 22institutetext: Instituto de Ciencia de Materiales de Madrid, CSIC, c/ Sor Juana Inés de la Cruz 3, 28049 Cantoblanco, Madrid, Spain 33institutetext: Observatorio Astronómico Nacional (IGN), Ap 112, 28803 Alcalá de Henares, Madrid, Spain 44institutetext: Observatorio Astronómico Nacional (IGN), Alfonso XII No 3, 28014 Madrid, Spain 55institutetext: Université de Bordeaux, LAB, UMR 5804, F-33270, Floirac, France 66institutetext: Max-Planck-Institut für Radioastronomie, Auf dem Hügel 69, 53121 Bonn, Germany
Molecular ions in the O-rich evolved star OH231.8+4.2: HCO+, H13CO+ and first detection of SO+, N2H+, and H3O+
OH 231.8+4.2, a bipolar outflow around a Mira-type variable star, displays a unique molecular richness amongst circumstellar envelopes (CSEs) around O-rich AGB and post-AGB stars. We report line observations of the HCO+ and H13CO+ molecular ions and the first detection of SO+, N2H+, and (tentatively) H3O+ in this source. SO+ and H3O+ have not been detected before in CSEs around evolved stars. These data have been obtained as part of a full mm-wave and far-IR spectral line survey carried out with the IRAM 30 m radio telescope and with Herschel/HIFI. Except for H3O+, all the molecular ions detected in this work display emission lines with broad profiles (FWHM 50-90 km s-1), which indicates that these ions are abundant in the fast bipolar outflow of OH 231.8. The narrow profile (FWHM14 km s-1) and high critical densities (106 cm-3) of the H3O+ transitions observed are consistent with this ion arising from denser, inner (and presumably warmer) layers of the fossil remnant of the slow AGB CSE at the core of the nebula. From rotational diagram analysis, we deduce excitation temperatures of 10-20 K for all ions except for H3O+, which is most consistent with 100 K. Although uncertain, the higher excitation temperature suspected for H3O+ is similar to that recently found for H2O and a few other molecules, which selectively trace a previously unidentified, warm nebular component. The column densities of the molecular ions reported here are in the range [1-8]1013 cm-2, leading to beam-averaged fractional abundances relative to H2 of (HCO+)10-8, (H13CO+)210-9, (SO+)410-9, (N2H+)210-9, and (H3O+)710-9 cm-2. We have performed chemical kinetics models to investigate the formation of these ions in OH 231.8 as the result of standard gas phase reactions initiated by cosmic-ray and UV-photon ionization. The model predicts that HCO+, SO+, and H3O+ can form with abundances comparable to the observed average values in the external layers of the slow central core (at [3-8]1016 cm); H3O+ would also form quite abundantly in regions closer to the center ((H3O+)10-9 at 1016 cm). For N2H+, the model abundance is lower than the observed value by more than two orders of magnitude. The model fails to reproduce the abundance enrichment of HCO+, SO+, and N2H+ in the lobes, which is directly inferred from the broad emission profiles of these ions. Also, in disagreement with the narrow H3O+ spectra, the model predicts that this ion should form in relatively large, detectable amounts (10-9) in the external layers of the slow central core and in the high-velocity lobes. Some of the model-data discrepancies are reduced, but not suppressed, by lowering the water content and enhancing the elemental nitrogen abundance in the envelope. The remarkable chemistry of OH 231.8 probably reflects the molecular regeneration process within its envelope after the passage of fast shocks that accelerated and dissociated molecules in the AGB wind 800 yr ago.
Key Words.:
Stars: AGB and post-AGB – circumstellar matter – Stars: winds, outflows – Stars: chemically peculiar – Astrochemistry1 Introduction
OH 231.8+4.2 (hereafter, OH 231.8) is a well-studied bipolar nebula around an OH/IR source111OH/IR objects are infrared-bright evolved stellar objects with a dense envelope showing prominent OH maser emission.. Although its evolutionary stage is not clear because of its many unusual properties, it is believed to be a planetary nebula (PN) precursor probably caught in a short-lived transitional phase. The obscured central star, named QX Pup, is classified as M9-10 III and has a Mira-like variability consistent with an evolved asymptotic giant branch (AGB) star (Cohen, 1981; Feast et al., 1983; Kastner et al., 1992; Sánchez Contreras et al., 2004). The evolution of this object may have been complex since it has a binary companion star (of type A0 V), which has been indirectly identified from the analysis of the stellar spectrum reflected by the nebular dust (Cohen et al., 1985; Sánchez Contreras et al., 2004). The system, located at 1500 pc (Choi et al., 2012), has a total luminosity of 104 and its systemic velocity relative to the Local Standard of Rest (LSR) is 34 km s-1. OH 231.8 is likely a member of the open cluster M 46 with a progenitor mass of 3 (Jura & Morris, 1985).
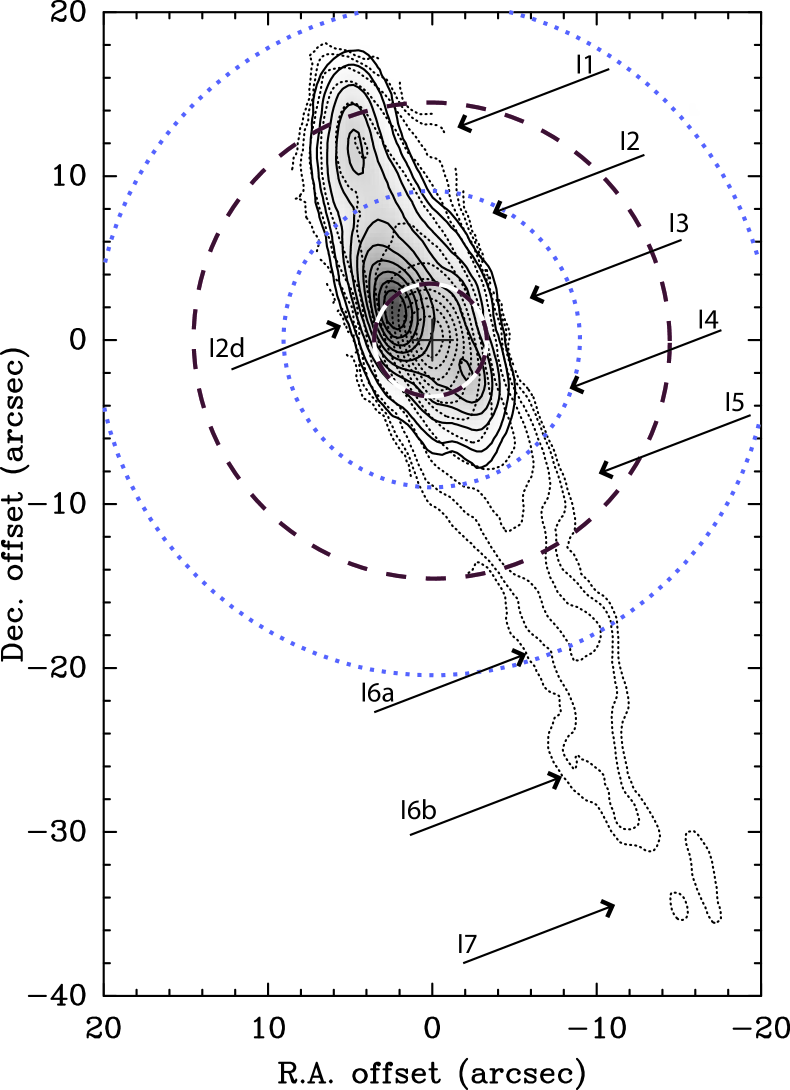
OH 231.8 is surrounded by a massive ( 1 ) and predominantly cold (10-40 K) molecular envelope well characterized by mm-wavelength emission from CO and other molecules (Fig. 1). The molecular gas is located in a very elongated and clumpy structure with two major components: () a central core (referred to as clump I3) with an angular diameter of 6-8″, a total mass of 0.64 , and low expansion velocity of 6-35 km s-1; and () a highly collimated 6′′57′′ bipolar outflow, with a mass of 0.3 and expansion velocities that increase linearly with the distance from the center, reaching values of up to 200 and 430 km s-1 at the tip of the north and south lobe, respectively. The temperature in the lobes is notably low, 10-20 K (Sánchez Contreras et al., 1997; Alcolea et al., 2001).
The molecular envelope of OH 231.8 is markedly different from the slow, roughly round expanding CSEs of most AGB stars; its pronounced axial symmetry, large expansion velocities, and the presence of shocks are common in objects that have left the AGB phase and are evolving to the PN stage, the so-called pre-PNe (Neri et al., 1998; Bujarrabal et al., 2001; Castro-Carrizo et al., 2010; Sánchez Contreras & Sahai, 2012). It is believed that the nebula of OH 231.8 was created as the result of a huge mass-loss event that occurred during the late-AGB evolution of the primary at a rate of 10-4 yr-1. With a total linear momentum of 27 km s-1, the bipolar flow is interpreted as the result of a sudden axial acceleration of the envelope. The linear distance-velocity relation observed in the CO-outflow (with a projected velocity gradient of 6.5 km s-1 arcsec-1) suggests that such an acceleration took place 800 yr ago in less than 150 yr. The low-velocity, low-latitude central core of the outflow is thought to be the fossil remnant of the AGB star’s CSE.
It is probable that the acceleration of the bipolar lobes resulted from the violent collision of underlying jets (emanating from the stellar companion) and the slowly expanding AGB envelope (Sánchez Contreras et al., 2000; Alcolea et al., 2001; Bujarrabal et al., 2002; Sánchez Contreras et al., 2004); this is one plausible scenario that has been proposed to explain the shaping and acceleration of bipolar pre-PNe and PNe (e.g., Sahai & Trauger, 1998; Balick & Frank, 2002). Recently, Sabin et al. (2014) have found indications of a well-organized magnetic field parallel to the major axis of the CO-outflow of OH 231.8 that could point to a magnetic outflow launching mechanism. Alternatively, as noticed by these authors, the magnetic field could have been dragged by the fast outflow, which may have been driven by a different mechanism. For example, the underlying jets could have been launched by the main-sequence companion powered by mass accretion from the mass-losing AGB star through an FU Ori type outburst (Sánchez Contreras et al., 2004) or a much more violent (100 days) Intermediate-luminosity Optical Transient (ILOT) like event (Soker & Kashi, 2012).
OH 231.8 has a remarkably rich and unusual chemistry amongst CSEs around O-rich low-to-intermediate-mass evolved stars. In addition to the typical oxygen-rich content, with molecules such as H2O, OH or SiO (Bowers & Morris, 1984; Morris et al., 1987; Zijlstra et al., 2001; Sánchez Contreras et al., 2002; Desmurs et al., 2007), OH 231.8 displays strong lines of many different molecular species, including many containing carbon. High-angular-resolution mapping of the HCO+ (=1–0) emission (Fig. 1) indicates that this ion is comparatively more abundant in the fast lobes that in the slow central core (Sánchez Contreras et al., 2000). Single-dish maps of the SiO (=5–4) emission show that the abundance of this molecule could also be enhanced in the lobes (Sánchez Contreras et al., 1997). The spectrum of OH 231.8 is unusually rich in lines from S- and N-bearing molecules. For example, it was the first O-rich CSE in which H2S, NS, CS, and OCS were detected, and we have recently reported the first detection of HNCO, HNCS, HC3N, and NO (Velilla Prieto et al., 2014). Some of these S- and N-compounds are present in the envelope at levels not expected in O-rich CSEs around low-to-intermediate mass stars. In the case of OH 231.8, it has been proposed that extra Si and S are released into the gas phase from the sputtering of dust grains by shocks. Shocks might also initiate (endothermic) reactions that trigger the N and S chemistry and could also be additional suppliers of free atoms and ions (Morris et al., 1987; Sánchez Contreras et al., 2000; Velilla Prieto et al., 2014).
We have recently completed a sensitive molecular line survey of this object in the mm-wavelength and far-IR range with the IRAM 30m telescope and Herschel (Velilla Prieto et al., 2014; Sánchez Contreras et al., 2014, full survey data to be published by Velilla Prieto et al., Sanchez Contreras et al., in prep.). We have detected hundreds of molecular transitions, discovered 30 new species (including isotopologues), and extended the rotational ladders for many others. This has led to very detailed information on the global physicochemical structure of this envelope. From a preliminary analysis of the survey data (Sánchez Contreras et al., 2014), we find two main temperature components: a predominantly cold (10-40 K) component mainly traced by CO (but also by, e.g., HCN, HNC, HNCO, and HCO+) and a warm (100 K) molecular component that is selectively traced by certain molecules, such as H2O, amongst a few others (e.g., CS, H2S, and SiS).
In this paper, we report the first detection of the molecular ions SO+, N2H+, and (tentatively) H3O+ in OH 231.8 as part of our surveys. We also present and analyse several lines of HCO+ and H13CO+, which are known to be present in OH 231.8 from earlier works (Morris et al., 1987; Sánchez Contreras et al., 1997, 2000). Molecular ions are believed to be significant contributors to the molecule formation process in circumstellar environments, which are active sites of molecular synthesis. In the interstellar medium (including molecular clouds, star-forming regions, PDRs, etc.) more than 30 molecular ions have been detected, however, in the envelopes around low-to-intermediate mass evolved stars detections still remain scarce and limited to HCO+ in most cases (see, e.g., Cernicharo & Bachiller, 2011). In only a few objects in the post-AGB or PN phase, other positive ions have been detected, namely, CO+, N2H+, CH+, OH+, and (tentatively) HCS+. Except for OH+, so far these ions have been exclusively identified in C-rich objects, which show in general a richer chemistry than their O-rich analogues. In particular, toward the young PN NGC7027, where HCO+, H13CO+, CO+, N2H+, CH+, and, tentatively, HCS+, are observed (Cernicharo et al., 1997; Hasegawa & Kwok, 2001; Zhang et al., 2008, and references therein) and the pre-PN CRL618, where HCO+ and N2H+ are detected (Bujarrabal et al., 1988; Pardo et al., 2007). Recently, the ion OH+ has been detected with Herschel in five PNe (Etxaluze et al., 2014; Aleman et al., 2014). To our knowledge, in circumstellar envelopes negatively charged molecular anions have been found to date only in the C-rich AGB star IRC+10216 (e.g., McCarthy et al., 2006; Cernicharo et al., 2007; Agúndez et al., 2010a).
2 Observations
These data are part of a spectral line survey in the mm/far-IR wavelength range carried out with the IRAM 30 m radio telescope (79-355 GHz; Sánchez Contreras et al., 2011; Velilla Prieto et al., 2013) and the Herschel space observatory (479-1244 GHz; Sánchez Contreras et al., 2014). The spectra are presented in units of antenna-temperature (), which can be converted to a main-beam temperature () scale via =/, where is the frequency dependent ratio between the main-beam efficiency () and the forward efficiency () of the telescope (values are provided in § 2.1 and § 2.2 for IRAM 30 m and Herschel, respectively).
In both surveys, we have observed one single position toward the center of OH 231.8 (with J2000 coordinates R.A.7̄h42m16830; Dec. =14°42′5210). Considering the half power beam width (HPBW) of the IRAM 30 m and Herschel telescopes at the observed frequencies (HPBW30m 7″-29″ and HPBWHSO 18″-41″), this pointing fully covers the slow central core at all frequencies and the fast bipolar lobes up to some extent depending on the frequency (Fig. 1).
2.1 Observations with IRAM 30 m/EMIR
Our mm/submm-wavelength survey was performed with the IRAM 30 m radio telescope (Pico Veleta, Granada, Spain) using the new generation heterodyne Eight MIxer Receiver (EMIR). Spectra were taken in several observational campaigns between years 2009 and 2013. We covered the whole accessible frequency range 79-355 GHz, using the four EMIR bands E090= 3 mm, E150= 2 mm, E230= 1 mm, and E330= 0.8 mm (Carter et al., 2012). The EMIR was operated in single sideband (SSB) mode for band E150, and in dual sideband (2SB) mode for bands E090, E230 and E330. In all cases, the image sideband was rejected with an average sideband rejection of 14 dB. Each receiver band was connected to different backends; here we report data observed with the WILMA autocorrelator, which provides a spectral resolution of 2 MHz, and the Fast Fourier Transform Spectrometer (FTS) in its 195 kHz spectral resolution mode. Observations were done in wobbler switching mode with a wobbler throw of 120″. Pointing and focus were checked regularly (every 1.5 and 4 h, respectively) on strong nearby sources. On-source integration times per tuning step were typically 1 h. Calibration scans on the standard two load system were taken every 18 min. Errors in the absolute flux calibration are expected to be 25%. The parameters of the beam of the IRAM 30 m telescope used in this work are described to a good accuracy as a function of the frequency () by
| (1) |
according to measurement updates performed in August 2013222http://www.iram.es/IRAMES/mainWiki/EmirforAstronomers.
We reduced the data using CLASS333CLASS is a worldwide software to process, reduce, and analyze heterodyne line observations maintained by the Institut de Radioastronomie Millimetrique (IRAM) and distributed with the GILDAS software, see http://www.iram.fr/IRAMFR/GILDAS. following the standard procedure, which includes killing bad channels, subtracting baseline, and averaging individual, good quality scans to produce final spectra.
2.2 Observations with Herschel/HIFI
Observations were carried out with the Herschel Space Observatory (Pilbratt et al., 2010) and its HIFI’s wideband spectrometer (WBS de Graauw et al., 2010) in several runs in November 2011 and April-May 2012. Our survey, executed in spectral scan mode, covers the frequency range 479-1244 GHz (bands 1a-5a) with an average spectral resolution of =1.1 MHz. Observations were performed in the dual beam switching (DBS) mode with a 3′ chop throw. The two orthogonal receivers of HIFI (horizontal H, and vertical V) were used simultaneously.
We reprocessed raw Herschel/HIFI data from level 0 to level 2 running the hifiPipeline task of HIPE444HIPE is a joint development by the Herschel Science Ground Segment Consortium, consisting of ESA, the NASA Herschel Science Center, and the HIFI, PACS, and SPIRE consortia. (versions 9.0-11.0; Ott, 2010). Afterward, level 2 spectra were saved to FITS format and then imported by CLASS where standard data reduction routines were applied: blanking bad-quality data, removing spurs, fitting and subtracting baselines, stitching of the spectrometer subbands, and combining individual spectra. We averaged the spectra from both V and H polarisations (with equal weights), reducing the noise in the final product.
HIFI is a double-sideband (DSB) heterodyne instrument and, therefore, every spectrum contains the upper and lower sideband data folded together. We performed the deconvolution of the DSB data into single-sideband (SSB) format in CLASS using the task deconv. We assumed a side-band gain ratio of one. We performed the DSB-convolution using all bands simultaneously, which takes advantage of redundant observations in the frequency overlap regions between bands and optimizes the rms of the final SSB spectra. The absolute flux calibration uncertainty of the full, deconvolved SSB spectrum is estimated to be 10% (HIFI Observers’ Manual, version 2.4, § 5.7). Here we adopt a more conservative value of 20%.
We adopted the values of HPBW and most recently updated and reported by Mueller et al. (2014)555The HIFI Beam: Release #1. Release Note for Astronomers at http://herschel.esac.esa.int/twiki/bin/view/Public/HifiCalibrationWeb#HIFI_performance_and_calibration, which supersede previous estimates in Roelfsema et al. (2012). HIFI has 14 mixers (7 frequency bands in 2 polarizations), each of which has a frequency-dependent antenna pattern (beam). Detailed models of the beam have been obtained independently for each mixer and separately for polarizations H and V (i.e., a total of 722=28 beam models). The HPBW of HIFI for one spot frequency per mixer and the adopted values for the Ruze-like scaling of the main-beam efficiency () within the frequency range of each mixer are provided in Table 3 and Table 2, respectively, of Mueller et al. (2014). For convenience, we reproduce the values of these beam-model parameters in Table 6 of our Appendix A. Taking these values into account, the HPBW and can be described by
| (2) |
with the forward efficiency, , being 0.96 at all frequencies (Mueller et al. 2014, Roelfsema et al. 2012), and where and are both expressed in m. As shown in Table 6, and are different for the different mixers of HIFI.
3 Results
| Rest Freq. | Transition | Eu | Aul | |
| (MHz) | QNs | (K) | (s-1) | (K km s-1) |
| H12CO+ = 3.888 Debyes | ||||
| 89188.5 | 1 - 0 | 4.3 | 4.161E-05 | 4.56 (0.05) |
| 267557.6 | 3 - 2 | 25.7 | 1.444E-03 | 9.1 (0.30)∗*∗*Flux after removing the contribution of the SO2 line (50%, see § 3.1). |
| 535061.6 | 6 - 5 | 89.9 | 1.244E-02 | 0.15††{\dagger}††{\dagger}Tentative detection.(0.05) |
| 624208.4 | 7 - 6 | 119.8 | 1.997E-02 | 0.11 |
| H13CO+ = 3.888 Debyes | ||||
| 86754.3 | 1 - 0 | 4.2 | 3.829E-05 | 0.50 (0.05) |
| 260255.3 | 3 - 2 | 25.0 | 1.329E-03 | 1.85 (0.11) |
| 346998.3 | 4 - 3 | 41.6 | 3.267E-03 | 0.76 (0.10) |
| 520459.9 | 6 - 5 | 87.4 | 1.145E-02 | 0.11 |
| SO+ = 2.3 Debyes | ||||
| 162198.6 | 7/2-5/2(e) | 16.7 | 1.108E-04 | 0.64 (0.04) |
| 208965.4 | 9/2-7/2(f) | 26.8 | 2.457E-04 | 0.50 (0.08) |
| 254977.9 | 11/2-9/2(e) | 38.9 | 4.566E-04 | 0.55 (0.15) |
| 301361.5 | 13/2-11/2(e) | 53.4 | 7.655E-04 | 0.15 |
| 301736.8 | 13/2-11/2(f) | 53.5 | 7.684E-04 | 0.15 |
| 347740.0 | 15/2-13/2(e) | 70.1 | 1.189E-03 | 0.25††{\dagger}††{\dagger}Tentative detection.(0.15) |
| 348115.2 | 15/2-13/2(f) | 70.2 | 1.193E-03 | 0.17 |
| 486837.2 | 20/2-18/2(f) | 133.5 | 3.330E-03 | 0.11 |
| 487212.1 | 20/2-18/2(e) | 133.7 | 3.338E-03 | 0.11 |
| N2H+ = 3.4 Debyes | ||||
| 93173.1 | 1 - 0 | 4.5 | 3.628E-05 | 0.54 (0.04) |
| 279510.8 | 3 - 2 | 26.8 | 1.259E-03 | 1.17 (0.10) |
| 558965.1 | 6 - 5 | 93.9 | 1.085E-02 | 0.12 |
| 652094.2 | 7 - 6 | 125.2 | 1.741E-02 | 0.14 |
| H3O+ = 1.44 Debyes | ||||
| 307192.4 | 1 - 2 | 79.5 | 3.498E-04 | 0.28 (0.09) |
| 984708.7 | 0 - 1 | 54.6 | 2.305E-02 | 0.40††{\dagger}††{\dagger}Tentative detection.(0.20) |
| 1031299.5 | 4 - 3 | 232.2 | 5.148E-03 | 0.31 |
| 1069827.6 | 4 - 3 | 268.8 | 9.850E-03 | 0.23 |
We detected emission from the molecular ions HCO+, H13CO+, SO+, N2H+, and (tentatively) H3O+ toward OH 231.8 (Table 1 and Figs. 2-5). Except for HCO+ =1–0 (Morris et al., 1987; Sánchez Contreras et al., 1997), HCO+ =3–2, and H13CO+ =1–0 (Sánchez Contreras et al., 1997), all transitions reported here are first detections in this source. SO+ and H3O+ have not been detected before in CSEs around evolved stars (either oxygen- or carbon-rich). Quintana-Lacaci et al. (2013) recently reported the discovery of N2H+ emission toward the massive yellow hypergiant IRC+10420, but no detection of this molecule in O-rich low-to-intermediate mass evolved stars (AGB or post-AGB) has been published to date. Detection of N2H+ has been reported in two C-rich objects, the young PN NGC7027 and the pre-PN CRL618 (see § 1).
In Table 1 we list the main parameters of the molecular transitions observed, which are all in the ground vibrational state. The flux is computed by integrating the area under the line profile. The corresponding formal errors of the flux are given in parenthesis in the last column of the table and have been calculated according to the error propagation theory as
where FWZI is the spectral window (in km s-1) over which the line is integrated and rms is the root mean square statistical noise (in kelvins) of the spectrum near the line for a spectral resolution of (in km s-1). This estimate of the flux error does not include additional uncertainties that may result from baseline subtraction and absolute flux calibration. Typically, we binned our original spectra to match a common velocity resolution of 2 km s-1, except for the 2 MHz-resolution WILMA data at frequencies lower than 300 GHz, for which is already larger than 2 km s-1 (§ 2).
We obtained the line frequencies and other spectroscopic parameters discussed here from the Cologne Database for Molecular Spectroscopy (CDMS; Müller et al., 2005), the Jet Propulsion Laboratory (JPL) molecular spectroscopy database (Pickett et al., 1998), and the MADEX catalogue (Cernicharo, 2012).
3.1 H12CO+ and H13CO+
The three HCO+ lines we observed toward OH 231.8 are shown in Fig. 2. The single-dish profiles of the =1–0 and =3–2 transitions were already known from previous observations (Sánchez Contreras et al., 1997, 2000). As expected, we find similar shapes and absolute intensities (within the calibration uncertainties). The HCO+ =1–0 transition, observed over a full velocity range of 200 km s-1 (=[80:+120]km s-1), is characterized by a broad flattened profile centered around 30 km s-1 with a full width at half maximum of FWHM 90 km s-1 and a weaker, blue-shifted component centered at 53 km s-1 with FWHM25 km s-1.
The HCO+ =3–2 line is also broad, covering the velocity range =[20:+105] km s-1. There is a prominent feature centered at 55 km s-1 with FWHM24 km s-1, which represents roughly half of the total flux measured in the profile. This feature, observed but not discussed in previous works, is a blend of HCO+ =3–2 with the SO2 =133,11–132,12 line at 267.5 GHz (Eu=105 K). SO2 shows a wealth of intense transitions that dominate the mm/far-IR spectrum of OH 231.8. We have used these other SO2 transitions to estimate the total column density and excitation temperature of this molecule with the classic population diagram method (to be published in Sánchez Contreras et al., in prep). Using this technique, we confirm the identification of the SO2 line as the main contributor to the 55 km s-1 feature and remove its emission from the total flux measured. We find that the expected intensity of this SO2 transition accounts for 50% of the total flux measured in the blend at 267 GHz (18 Kkm s-1) and, thus, the remaining 50% is due to HCO+ =3–2 (Table 1). A two Gaussian fit to the blended profile is consistent with the HCO+ line being centered at 40 km s-1 and having FWHM80 km s-1 (although these figures are rather uncertain).
Regarding HCO+ =6–5, although the low S/N ratio prevents an accurate characterization of the profile, the shape of this weak line is also consistent with a broad profile (FWZI60 km s-1) with two peaks around 20 and 50 km s-1, similar to the profile of the H13CO+ =4–3 (also in Fig. 2, right column).
As already noted and discussed by, e.g., Morris et al. (1987) and Sánchez Contreras et al. (1997), the broad HCO+ profiles are notably different from those of most molecules, including 12CO and 13CO. The latter display an intense narrow emission core (in the range =[10:55]km s-1) that arises at the low-velocity, low-latitude parts of the nebula (clump I3), which contain 2/3 of the total nebular mass, plus much weaker broad wings produced by the less massive but faster bipolar lobes. (Profiles of 13CO transitions from our survey are included as additional material in Appendix B, Fig. 11).
The spatio-kinematic distribution of HCO+ =1–0 is known with 4″2″-resolution from interferometric maps by Sánchez Contreras et al. (2000) – see Fig. 1. These data show that, indeed, the different line profiles of HCO+ and CO come from significant differences between the spatial distribution of these molecules. In contrast to CO, the HCO+ =1–0 emission is enhanced in the bipolar lobes and it shows a deficit of emission from the massive slow central region; this explains the broad flattened HCO+ profiles. The HCO+ emission peaks at a compact region (referred to as clump I2d) at 3-4″ along PA50° from the center. There is a large velocity dispersion, of 80 km s-1, within this clump that, indeed, produces the bulk of the HCO+ =1–0 emission in the velocity range =[20:+60] km s-1. The extent of the HCO+ emission in the outflow is smaller than that of CO (in the southern lobe, the HCO+ emission abruptly falls beyond clump I5) although the axial velocity gradient is similar in both cases.
The single-dish profile of the =1–0 transition (Fig. 2) is consistent with the whole HCO+ emission completely filling the telescope beam at 89 GHz, HPBW=273: the bluest HCO+ =1–0 spectral feature at =53 km s-1 traces the tip of the approaching North lobe (clump I1), while the reddest wing emission (up to =120 km s-1) originates in the South lobe (mainly from clump I4 and partially from clump I5).
The smaller full width of the HCO+ =3–2 transition (120 km s-1), compared with the =1–0 line, is consistent with the smaller beam size of the IRAM 30 m telescope at 267 GHz (HPWB=91) and, thus, the smaller fraction of the axial outflow lying within the beam. Given the velocity range over which the HCO+ =3–2 emission is observed in our single-dish data, most of the emission must arise at the nebular center, the bright clump I2d and, partially, at the base of the South lobe.
The full width of the HCO+ =6–5 line is 60 km s-1. At this frequency, the beam of Herschel is sufficiently large (HPBW=398, i.e., larger than the IRAM 30 m beam at 89 GHz) as to include the bipolar HCO+-flow in its full extent. Therefore, one would expect to observe HCO+ =6–5 emission over a velocity range comparable to that of the =1–0 line (200 km s-1). The narrower =6–5 profile could indicate that the emission from this higher excitation transition, which has Eu=89 K, is restricted to regions closer to the nebula center, with smaller expansion velocities. In particular, the emission could mainly be associated with the bright emission clump I2d. However, these conclusions are very tentative because of the low S/N of this transition.
The H13CO+ line profiles are shown in Fig. 2 (right column). As expected, these transitions are weaker than their main isotope analogues. The spectra are broad, with a full width that ranges from 190 km s-1 in the =1–0 transition to 70 km s-1 in the =4–3. They lack a dominant narrow core component but, instead, show broad, multiple-peaked shapes. For the =1–0 transition, we clearly detect emisson at =50 km s-1 from the tip of the North lobe (clump I1). In all transitions, we detect emission from a velocity range that is consistent with emission produced at the bright clump I2d and at the base of the South lobe (clump I4). The emission contribution of the latter, clump I4, concentrates in the range [60:80] km s-1, this spectral feature being rather prominent and sharp in the =3–2 and 4–3 lines.
3.2 SO+
SO+ is a reactive radical with a -electronic state. The energy levels of a -molecule exhibit the additional splittings due to the electron spin and orbital angular momentum interactions (- and -doublets). The rotational levels are defined with three quantum numbers, , , , which represent the absolute value of the projection of the total electronic angular momentum on the molecular axis, the total angular momentum from rotation and electronic motion, and the parity, respectively (Amano, Amano, & Warner, 1991).
A total of twenty SO+ transitions (five -doublets in each of the =1/2 and =3/2 states) lie within the frequency range covered in our mm-wave survey with IRAM 30 m. The SO+ transitions detected toward OH 231.8 are listed in Table 1 and their profiles are shown in Fig. 3. The lines detected correspond to the lowest rotational levels of the ladder of SO+, which require low- excitation temperatures, between Eu=17 and 70 K. The nondetection of the transitions is in very good agreement with the expectations given that the lowest levels are at Eu500 K above the ground, much higher than the average temperature (10-40 K) of the molecular outflow of OH 231.8 (§ 1 and § 4.1). In Table 1 we have not included additional SO+ transitions that may be tentatively detected but that appear partially or fully blended with other stronger lines or in particularly noisy spectral regions (the spectra over the full range of frequencies covering the five SO+ doublets observed are shown in Fig. 10 of the Appendix).
The SO+ line profiles are broad, with FWHM6010 km s-1 and centered around 40 km s-1 (Fig. 3). The moderate S/N of the spectra does not justify an accurate analysis of the profiles, however, it is sufficient to establish that, as for HCO+, the SO+ lines lack a prominent, narrow central core, but instead are dominated by a broad spectral component. This suggests a similar distribution for SO+ and HCO+ and, therefore, it is likely that the emission from both molecules arises mainly at the fast outflow.
3.3 N2H+
N2H+ is a linear, triatomic molecule. Its spectral lines show hyperfine structure due to the electric quadrupole moment of the nitrogen nucleus. The line widths of the individual hyperfine components, which are separated by a few km s-1, are expected to blend because of the large expansion velocities of OH 231.8’s molecular outflow. In Table 1 we list the N2H+ =1–0 and 3–2 transitions detected in the mm-wavelength range and also provide flux upper limits for nondetections from our far-IR survey with Herschel up to upper level energies of Eu160 K.
The spectra of the two N2H+ transitions detected are shown in Fig. 4. Both lines have rather broad, somewhat structured profiles: the =1–0 line is centered at 454 km s-1 and has FWHM=8510 km s-1 and the =3–2 line is centered at 394 km s-1 and has FWHM=7010 km s-1. The smaller line width of the N2H+ =3–2 transition is consistent with the smaller beam size at this frequency (HPBW87), which implies that a smaller fraction of the outflow is probed.
The deconvolved width of the lines at half maximum, taking the hyperfine structure and the spectral resolution of the data into account, is 70 km s-1, indicating that most of the N2H+ emission arises in the fast outflow. As for HCO+ and SO+, N2H+ lines present broad profiles, lacking of a prominent, narrow core component.
3.4 H3O+
The molecular ion H3O+, hydronium, is isoelectronic with ammonia (NH3) and has a similar physical structure: H3O+ is a trigonal pyramid with the oxygen atom at the apex and the hydrogen atoms at the base. Like ammonia, H3O+ undergoes inversions as the oxygen atom tunnels through the plane of the hydrogen atoms leading to the characteristic inversion splitting of its rotational levels. An energy level diagram of this molecule for the lowest four rotational levels is shown by, e.g., Mamon et al. (1987). The rotation-inversions transitions are described by three quantum numbers , where the parity number takes a or value (see, e.g., Kozlov & Levshakov, 2011). H3O+ has both ortho- and para- modifications: transitions with =3, where is an integer 0, are from the ortho and the rest are para variety.
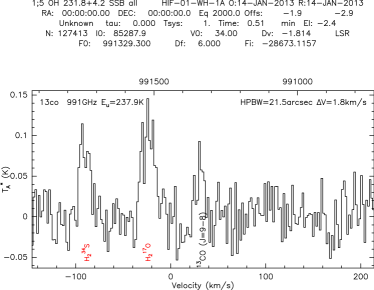
The spectrum of the p-H3O+ =1-2 line at 307 GHz is shown in Fig. 5. A weak emission line is observed centered at =343 km s-1 and with a width of FWHM146 km s-1. This profile is significantly narrower that those of the other molecular ions described here, but consistent with the low expansion velocities found in the central regions of OH 231.8 (§ 1). Although the H3O+ emission is weak, it satisfies a simple objective detection criterion: more than three adjacent channels of width 3.9 km s-1, corresponding to an anticipated line-FWHM of 12km s-1, are above 1.5 (this is adopting a gaussian profile with a 3 level at the peak). Moreover, the line centroid coincides with the systemic velocity of the source within errors, which reinforces the detection case.
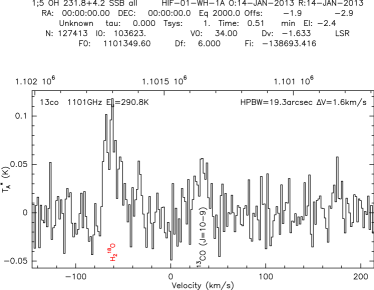
We observed the o-H3O+ =0-1 line at 985 GHz and other transitions of this molecular ion at higher frequencies in our survey with Herschel toward OH 231.8. The spectrum at 985 GHz (shown in Fig. 5) is consistent with weak emission centered at =373 km s-1 and FWHM=85 km s-1. The line flux measured over a 14 km s-1-wide window is 0.4(0.2) K km s-1, so we take a conservative position and consider this as a tentative detection. Nevertheless, it is worth noting that very weak emission from this transition is indeed expected if H3O+ arises in the warm (100 K) envelope component that we recently discovered in our Herschel survey (see § 1 and also § 4.1). This warm component is found to be selectively traced by certain molecules, in particular, by H2O (as well as by CS, H2S, and SiS). Since the chemistry of H3O+ and H2O are expected to be intimately related to each other, we consider the relatively high temperature suspected from the weakness of the H3O+ 985 GHz transition (compared to the H3O+ line at 307 GHz) consistent with both species being produced in similar regions.
4 Analysis
4.1 Column densities and excitation temperatures
We have obtained beam-averaged column densities () and excitation temperatures () for the different ions observed using the standard population diagram technique (e.g., Goldsmith & Langer, 1999). In this method, the natural logarithm of the column density per statistical weight (Nu/gu) is plotted against the energy of the upper level above the ground state (Eu) for a number of transitions of the same molecule. Assuming that the lines are optically thin and thermalized, i.e., all levels are under local thermodynamic equilibrium (LTE) conditions at a given unique temperature, Nu/gu and Eu are related by the following formula:
| (3) |
where is the Boltzmann constant; Wul is the source brightness temperature integrated over velocity; and Sul are the frequency and line strength of the transition, respectively; is the appropriate component of the permanent dipole moment of the molecule; Z() its partition function; and and refer to the upper and lower levels involved in the transitions. According to eq. 3, for a given molecule a straight-line fit to the points in the population diagram provides /Z() from the -axis intercept and from the slope of the fit. The line flux W is given by
| (4) |
where is the ratio between the main-beam efficiency and the forward efficiency of the telescope at a given frequency (values are given in § 2) and is the dilution correction factor. The latter is estimated as
where and are the solid angular extent of the source and the telescope main beam, respectively. These solid angles are expressed above as a function of the telescope beam (HPBW) and the angular major () and minor () axes of a uniform elliptical source (see, e.g., Kramer 1997), which has been taken to roughly represent the elongated molecular outflow of OH 231.8.
Based on the angular extent of the HCO+=1–0 emission in OH 231.8 deduced from interferometric mapping (Sánchez Contreras et al., 2000); see discussion in § 3.1, we adopt a characteristic angular size of 4″12″ for all the species discussed here. Although the spatial distribution of H13CO+, SO+, and N2H+ is unknown, their relatively broad emission profiles and similar excitation requirements justifies our assumption. In the case of H3O+, the narrower line profile and possibly higher inferred (see below) may suggest a more compact distribution. We have also considered a smaller size of the H3O+-emitting area of 4″4″, which leads to a lower but a comparable value for . We note that the adopted angular size affects both Nu/gu and : on the one hand, the smaller the size, the larger the value of Nu/gu obtained from the fit; on the other hand, changes by a different factor for different transitions, which translates into a modification of the slope of the straight-line fit to the points in the population diagram and, thus, into a different . In the particular case of H3O+, both effects compensate to yield a similar value of when adopting a smaller size of 4″4″.
In Fig. 6 we plot the population diagrams for the molecular ions detected in OH 231.8. The partition function, Z(), has been computed for each molecule by explicit summation of a finite number of rotational energy levels from the ground vibrational state using MADEX (Cernicharo, 2012). For H3O+ we have adopted an ortho-to-para ratio of 1, which is the expected value in statistical equilibrium conditions at 50 K (Phillips et al., 1992). The values of and obtained for the different species are given in Table 2. In this table, we also include results for 13CO obtained in Velilla Prieto et al. (2014) using the same technique and assumptions. As discussed by these and other authors, 13CO transitions are optically thin, or only moderately opaque at the line peak toward the densest central parts, and are expected to be thermalized over the bulk of the nebula, with high average densities of 105-106 cm-3, and even larger in low-latitude regions closer to the nebular nucleus.
For HCO+, H13CO+, SO+, and N2H+, the values of obtained are low, 8-20 K, in agreement with previous estimates of the kinetic temperature in the outflow, which is 10-20 K in the fast lobes and, somewhat larger, 10-40 K in the low-velocity, low-latitude component666These temperatures are derived from low- transitions and, thus, correspond to the external layers of the central component, deeper regions are expected to be progressively warmer closer to the central star. (see § 1). The excitation temperature inferred for H3O+, 100 K, is significantly larger than for the rest of the molecular ions (Fig. 6). This value of is very uncertain, however, the upper limit to the flux ratio between the 985 GHz and the 307 GHz transitions indicates temperatures certainy larger than 40 K for the emitting region; otherwise, the 985 GHz line should have been much stronger, and thus well detected, given the relatively low energy of the upper state level of this transition (Eu55 K) compared to that of the 307 GHz line (Eu80 K). Moreover, it is suggestive that the excitation temperature guessed for H3O+ matches very well that deduced for H2O and its main isotopologues, H218O and H217O, from our recent survey with Herschel (Sánchez Contreras et al., 2014). Considering that the chemistry of H3O+ is expected to be closely linked to that of H2O, the obtained result is probably more than an unlucky coincidence.
On top of that, the narrow profile of the H3O+=1-2 line at 307 GHz suggests that the emission arises in the dense central parts of the nebula where the expansion velocities are smaller and the temperatures are presumably higher. Support for this comes from the fact that the narrow line width and lowish LSR velocity we find for H3O+ is, remarkably, also observed for the ( = (2,2) and (3,3) lines of NH3 by Menten & Alcolea (1995). According to these authors, these lines’ profiles are “characterized by a narrow line width of 15 km s-1 (FWHM) and a centroid velocity around 30 km s-1”, which is in excellent agreement with the values we find for H3O+ (see Section 3.4). This gives, first, credence to the reality of our H3O+ detection. Secondly, the NH3 (2,2) and (3,3) lines arise from levels that are at energies 64 and 123 K above the ground state, respectively, and from their ratio Menten & Alcolea calculate a rotation temperature of K from which they conclude that “the narrow component is emitted from a relatively warm region”. By association, this supports our conjecture that the H3O+ emission arises from a warm environment. In contrast, the lower excitation NH3 (1,1) line, which arises from the molecule’s inversion-split para-ground state, shows broader emission than the (2,2) and (3,3) lines over a 73 km s-1 (FWZI) velocity range with a (higher) centroid of 41 km s-1.
For the values of and implied by the population diagrams, all the transitions detected are optically thin ( 0.1). The largest optical depth (at the line peak) is found for the HCO+ =3–2 transition, for which 0.20. In this case, we applied a small opactity correction factor of /(1)1.1, resulting in an insignificant effect on the and deduced from the fit. The optical depth of the HCO+ =1–0 and 3–2 lines is only expected to be larger than 1 for column densities 41014 cm-2; for the rest of the molecular ions under discussion even larger column densities, 1015 cm-2, would be necessary to produce optically thick emission.
In the previous work by Sánchez Contreras et al. (2000), a large opacity for the HCO+ =1–0 transition is also ruled out based on the HCO+/H13CO+(=1–0) intensity ratio, which agrees well with the low 12C/13C isotopic ratio estimated from CO and other molecules in the fast outflow, where the emission is known to be optically thin (see also § 4.2).
4.1.1 Non-LTE excitation effects
When the local density of molecular hydrogen () is insufficient to thermalize the transitions of a given molecule, departures from a linear relation in the population diagram are expected. We have performed a non-LTE excitation analysis of the HCO+ and N2H+ emission. We have considered radiative and collisional processes and solved the statistical equilibrium equations under the large velocity gradient (LVG) approximation using the code MADEX (Cernicharo, 2012, and references therein). We have adopted collisional coefficients for HCO+ and N2H+ from Flower (1999) and Daniel et al. (2005), respectively. For SO+ and H3O+ there are no collisional coefficients available in the literature, and thus non-LTE calculations cannot be done.
The critical densities of the mm-wave transitions of HCO+, H13CO+, and N2H+ observed by us are in the range 105-106 cm-3. These values are comparable to the mean densities in the central core component (106-107 cm-3) and moderately larger that the typical densities of the high-velocity clumps where the bulk of the wing emission arises (105 cm-3). Note that the lowest H2 densities in the molecular outflow of OH 231.8, 104-103 cm-3 are only found at very large distances from the star in the south lobe (clumps I5 and beyond; see Alcolea et al. 2001), but these distant, most tenuous and rapidly expanding regions (at 120 km s-1) do not contribute to the emission profiles of the molecular ions under discussion, as shown in Figs. 2-5.
For our non-LTE excitation calculations, we have adopted a representative density of =105 cm-3. We find that for both HCO+ and N2H+, only mild LTE deviations are expected at this density, which result in values of and (as deduced from the population diagram) slightly lower than the real and . This means that the temperatures and abundances quoted in Table 2 could be lower limits. We have explored the range of input and that would still be consistent with the observations if the characteristic density of the emitting regions is 105 cm-3. For both HCO+ and N2H+, we find that the population diagram could also be reproduced with a temperature of 30-40 K; for these temperatures, the total column densities would be (HCO+)91013 cm-2 and (N2H+)1.51013 cm-2. Therefore, the column densities deduced under non-LTE and LTE conditions do not differ significantly (less than about 15%).
4.2 Fractional abundances
We computed the fractional abundances of the ions relative to H2, =/ as =(13CO)/(13CO) and adopted (13CO)=510-5, as estimated by Morris et al. (1987). This value of the 13CO abundance is in the high end of the typical range for O-rich stars; in the case of OH 231.8, this is consistent with the particularly low 12C/13C isotopic ratio, 5-10, measured in this object (and other O-rich CSEs; Sánchez Contreras et al., 2000; Milam et al., 2009; Ramstedt & Olofsson, 2014, and references therein). We cannot exclude a lower value of (13CO), by a factor 2-3, in which case the abundances derived for the rest of the species should be scaled down in the same proportion. The fractional abundances obtained from the rotational-diagram method are listed in Table 2. As shown in § 4.1.1, the true values of (HCO+) and (N2H+) could be slightly larger than those given in the table if mild non-LTE excitation effects are present (discrepancies 15% are unlikely).
The average fractional abundance of HCO+ in OH 231.8 we derived, (HCO+) 10-8, is in good agreement with previous estimates (Morris et al., 1987; Sánchez Contreras et al., 1997, 2000). Small differences are expected due to data calibration uncertainties and the slightly different (13CO) abundance and excitation temperature adopted in different works. The average abundance of HCO+ in OH 231.8 is also within the range of values observationally determined on a small sample of O-rich envelopes, 0.15-1.310-7 (Pulliam et al., 2011). The abundance of H13CO+, and its comparison with that of HCO+, is consistent with a low 12C/13C isotope ratio of 7, in agreement with previous estimates for this object (see above).
The abundances of the other ions we presented have not been previously reported in O-rich CSEs. The fractional abundance of SO+ in OH 231.8 implies an abundance relative to SO of (SO+)/(SO)210-3; this is taking into account the fractional abundance of SO in OH 231.8 computed in other works, (SO)[1-3]10-6 (Guilloteau et al., 1986; Morris et al., 1987; Sánchez Contreras et al., 2000, and this survey, Sánchez Contreras et al., in prep.). For N2H+, our abundance estimate is consistent with the upper limit provided by Morris et al. (1987) based on the nondetection of the N2H+ =1–0 line by these authors ((N2H+)1.610-8). We deduce an average HCO+ abundance relative to N2H+ of (HCO+)/(N2H+)6; as we will see in § 5.1, the previous ratio may represent an upper limit to the [CO]/[N2] proportion in OH 231.8. For H3O+, we obtain a fractional abundance of 710-9, although we caution that this value is particularly uncertain given the low S/N of the H3O+ spectra. Our estimate is consistent with the range of values measured in interstellar clouds, (H3O+)10-10-10-9 (Wootten et al., 1991; Phillips et al., 1992; Goicoechea & Cernicharo, 2001). In these interstellar regions, the fractional abundance of H3O+ is expected to relate to that of water by a factor 1/1000-1/6000, based on gas-phase model predictions and observations. If this proportion also holds in OH 231.8, then one would infer an order-of-magnitude water content of (H2O)10-5-10-6. This value is at the low edge of the water abundance range deduced for a sample of six evolved O-rich stars, (H2O)[10-3-210-6], with the majority of the stars having (H2O)610-4 (Maercker et al., 2008).
| Species | ||||
|---|---|---|---|---|
| (”)(”) | (cm-2) | (K) | ||
| 13CO | 412 | 3.01017 | 20 | 5.010-5 |
| H12CO+ | 412 | 8.01013 | 14 | 1.310-8 |
| H13CO+ | 412 | 1.21013 | 10 | 2.010-9 |
| SO+ | 412 | 2.21013 | 20 | 3.710-9 |
| N2H+ | 412 | 1.31013 | 8 | 2.210-9 |
| H3O+ | 412 | 41013 | 100 | 710-9 |
| 44 | 51013 | 55 |
We recall that the abundances given in Table 2 represent average values within the emitting regions covered by the telescope beam, that is, the central core and (partially) the fast lobes. The large wing-to-core intensity ratio of the HCO+ profiles is known to reflect an abundance contrast of a factor 3-4 between the fast lobes and the slow central clump I3, as determined by Sánchez Contreras et al. (1997) from their analysis by individual spectral and spatial components of the HCO+ =1–0 emission maps; see their Table 2. This result is also corroborated by the interferometric observations of this transition (Fig. 1), which show that, in contrast to 12CO, 13CO, and most molecules, HCO+ is found in abundance in the lobes of OH 231.8, but it is scarce at the nebula center (Sánchez Contreras et al., 2000).
The broad profiles of H13CO+, SO+, and N2H+ suggest analogous lobe-to-core abundance enhancements for these ions. Unfortunately, except for the HCO+ =1–0 transition, obtaining column densities separately for the different velocity ranges corresponding to the slow core and the fast lobes is hampered by the weakness of the molecular lines. However, a straightforward argument in support of a lobe-to-core abundance ratio 1 for H13CO+, SO+, and N2H+ (as well as, of course, for HCO+) is provided by the large equivalent-width velocity () of these lines; the equivalent-width velocity is given by the ratio of the line flux, , to the peak intensity, (see, e.g., Sánchez Contreras & Sahai, 2012). As can be seen in Fig. 7, the of the emission lines by these species are systematically larger than those of 13CO. The 13CO profiles are dominated by the most massive component, that is, the slow central core (clump I3). The larger of the H13CO+, SO+, and N2H+ profiles indicates that the contribution to the emitting profile from the less massive fast lobes is larger for these ions than for 13CO, implying that their fractional abundances in the fast lobes are higher than in the slow massive clump I3. This also indicates that the true abundances of HCO+, H13CO+, SO+, and N2H+ in the lobes and in the slow central clump are higher and lower, respectively, than the beam-averaged values given in Table 2.
In the case of H3O+, the narrow profile of the weak =1-2 transition at 307 GHz suggests that the bulk of the emission is produced in the slow central clump I3. The of this transition is very uncertain but if it is confirmed to be lower than that of 13CO (by higher S/N observations), as suggested by our data (Fig.7), then one would infer a larger abundance of this ion in the slow core than in the fast lobes (i.e., a lobe-to-core abundance ratio 1). Moreover, since the higher suspected for H3O+ compared to that deduced for 13CO favors the origin of the H3O+ emission in envelope layers closer to the center, the average abundance in Table 2 could represent a lower limit to the true value in the central, compact emitting regions.
4.2.1 Upper limits to nondetections
We provide upper limits to the column densities and fractional abundances of other ions that are not detected in OH 231.8 and that may be of interest (Table 3). We have adopted common values for the source emitting size, 4″12″, =15 K, and FWHM=40 km s-1 and LTE conditions. For the ions considered, adopting a smaller size, larger excitation temperatures, and narrower profiles (as may be the case of H3O+) normally results in slightly smaller values of and than those given in the Table. For the different ions, the upper limits to are derived from the rms noise around the transition that is expected to have the largest S/N in our data (adopting =15 K); we have always checked that the upper limits obtained are also consistent with the nondetections of the rest of the transitions in the frequency range of our observations.
| Ion | ( cm-2) | Ion | ( cm-2) | ||
|---|---|---|---|---|---|
| OH+ | ¡3 | ¡5 | HOC+ | ¡1 | ¡2 |
| H2O+ | ¡2 | ¡3 | H2COH+ | ¡1 | ¡2 |
| CO+ | ¡2 | ¡3 | H2NCO+ | ¡5 | ¡8 |
| HCS+ | ¡8 | ¡1 | HSCO+ | ¡7 | ¡1 |
| SH+ | ¡2 | ¡3 | HOCS+ | ¡4 | ¡7 |
| CS+ | ¡5 | ¡8 | HC3NH+ | ¡4 | ¡7 |
| CH+ | ¡1 | ¡2 | HOCO+ | ¡7 | ¡1 |
| HCNH+ | ¡6 | ¡1 | H2Cl+ | ¡4 | ¡8 |
| NO+ | ¡4 | ¡7 | NeH+ | ¡1 | ¡2 |
| CF+ | ¡8 | ¡1 | H2F+ | ¡2 | ¡3 |
| C3H+ | ¡2 | ¡3 | ArH+ | ¡5 | ¡8 |
| OH- | ¡3 | ¡5 | NCO- | ¡2 | ¡3 |
| C2H- | ¡1 | ¡2 | C4H- | ¡2 | ¡3 |
| CN- | ¡1 | ¡2 | C3N- | ¡1 | ¡2 |
| SH- | ¡3 | ¡5 |
5 Formation of HCO+, SO+, N2H+, and H3O+
5.1 Chemical model
We performed chemical kinetics models to investigate the formation of the observed ions in OH 231.8. Our model is based on that by Agúndez & Cernicharo (2006) and we have used it recently to study the new N-bearing species detected in OH 231.8 by Velilla Prieto et al. (2014). The code has also been employed to model the chemistry in different astrophysical environments, including the prototypical C-rich star IRC+10216 (see, e.g., Agúndez et al., 2007, 2008, 2010b, 2012; Cernicharo et al., 2010, 2013), and the O-rich yellow hypergiant IRC+10420 (Quintana-Lacaci et al., 2013). The chemical network in our code includes gas-phase reactions, cosmic rays, and photoreactions with interstellar UV photons; it does not incorporate reactions involving dust grains, X-rays or shocks. Our code does not explicitly consider the chemistry of isotopologues, that is, does not include isotopic fractionation, such as selective photodissociation or isotope-exchange reactions; as a consequence, predictions for the H13CO+ abundance distribution are not made.
As input we adopt the same physical model for the envelope used in Velilla Prieto et al. (2014), which consists of two main components: ) a dense, spherically symmetric wind expanding at low velocity, which represents the slow, central nebular component of OH 231.8 (clump I3); and ) a rectangular slab of gas (plane-parallel geometry) with characteristics similar to those of the walls of the hollow bipolar lobes. We modeled separately these two components, which are externally illuminated by the interstellar UV field.
The main parameters of the simple physical model for OH 231.8 used as input in our chemical code are summarized in Table 4; additional details justifying the temperature, density, and velocity laws adopted are given in § 6.1 of Velilla Prieto et al. (2014). The region of the envelope modeled in case goes from 1015 cm (20 ) to its end, at 71016 cm (we refer to this region as the intermediate/outer envelope). The outer radius is observationally determined (Sánchez Contreras et al., 1997; Alcolea et al., 2001) and the inner radius has been chosen to be well beyond the dust condensation radius so that the full expansion velocity of the gas has been reached. In these intermediate/outer regions of the envelope, the chemistry is driven by chemical kinetics. Another major input of our chemistry model is the set of initial abundances of the ’parent’ species. These are formed in deeper layers and are injected to the intermediate/outer envelope. The parent species, typical of O-rich environments, and the initial abundances adopted in our model are as in Velilla Prieto et al. (2014) and are reproduced again in Table 5.
As in Velilla Prieto et al. (2014), the sources of ionization and dissociation adopted in our model are cosmic-rays and the interstellar ultraviolet radiation field. The cosmic ray ionization rate adopted is 1.210-17 s-1 (Dalgarno, 2006). The intensity of the UV field assumed is the Draine field or G0=1.7 in units of the Habing field (G0=1.6 erg s-1 cm-2; Habing, 1968; Draine & Salpeter, 1978). We computed the dust optical extinction, , across the envelope layers adopting the standard conversion from H2 column density =9.31020 cm-2, derived by Bohlin et al. (1978). The gas-to-dust mass ratio implicit in this conversion, 100, is comparable within errors to the average value measured in nearby O-rich AGB stars and, in particular, in OH 231.8 (e.g., Knapp, 1985; Kastner & Weintraub, 1995; Sánchez Contreras et al., 1998).
| Parameter | Value | Reference |
|---|---|---|
| Distance () | 1500 pc | b |
| Stellar radius (R∗) | 4.4x1013 cm | g |
| Stellar effective temperature (T∗) | 2300 K | g |
| Stellar luminosity (L∗) | 104 | g |
| Stellar mass (M∗) | 1 | g |
| model : slow, core | ||
| AGB CSE expansion velocity () | 20 km s-1 | a,e,f,g,i |
| AGB mass loss rate () | 10-4 yr-1 | e,a,f |
| Kinetic temperature () | T K | i |
| model : lobe walls | ||
| Wall thickness | 1″ | a |
| H2 number density () | 105 cm-3 | a |
| Kinetic temperature () | 20 K | a |
| Species | Abundance | Reference |
|---|---|---|
| He | 0.17 | a |
| H2O | 3.010-4 | b,TE |
| CO | 3.010-4 | c,TE |
| CO2 | 3.010-7 | d |
| NH3 | 4.010-6 | e |
| N2 | 4.010-5 | TE |
| HCN | 2.010-7 | f,g |
| H2S | 7.010-8 | h |
| SO | 9.310-7 | f |
| SiO | 1.010-6 | i |
| SiS | 2.710-7 | j |
The slow, central component. We used our chemical kinetics model first to investigate the formation of HCO+, SO+, N2H+, and H3O+ in an O-rich AGB CSE similar to the slow, core component of OH 231.8 (model , Table 4). The fractional abundances predicted by the model as a function of the distance to the center are shown in Fig. 8. For HCO+, N2H+, and H3O+, we checked that there is good agreement between our predictions and those obtained from analogous photochemistry simulations by Mamon et al. (1987); these authors modeled the chemistry of these three ions for O-rich CSEs with standard properties and a set of different mass-loss rates, including =10-4 yr-1. We found no previous modeling attempts for SO+ in circumstellar envelopes in the literature.
As the gas in the envelope expands, parent molecules start to be exposed to the interstellar UV radiation and photochemistry drives the formation of new species in the outer layers. Penetration of photons through the envelope is gradually blocked by dust and also by self-shielding of abundant gas species (mainly H2, H2O and CO). At the deepest layers of the intermediate/outer envelope inaccessible to the UV radiation, cosmic rays are major drivers of the chemistry. Cosmic rays ionize molecular hydrogen (H) , which combines with neutral H2 to form H. The latter is a fundamental ion for breaking down parent molecules leading to the formation of new ions in the inner layers of the envelope.
It is well known that the radical OH is an important product of the photodissociation of H2O in the external regions of O-rich CSEs. Our model predicts that OH reaches maximum abundance at 51016 cm, in good agreement with the characteristic radius of the OH maser toroidal shell observed at the center of OH 231.8 (Morris et al., 1982; Zijlstra et al., 2001). Our model indicates that, as the radical OH, molecular ions should be most efficiently formed in the outermost layers of the envelope, showing a shell-like distribution with maximum abundances at typical distances from the star of [5-7]1016 cm. Farther out, there is an abrupt fall of the ions’ abundances due to their destruction by dissociative recombination with electrons () and to photodissociation of their main progenitors.
According to our model, HCO+ forms in the outer layers of O-rich envelopes mainly as a photodissociation product of CO and H2O (in order of importance):
| (5) |
where the C+ ion is predominantly produced in the CO photoionization chain, and the molecular ions HOC+ and CO+ are formed through
| (6) |
An additional, but nondominant pathway to HCO+ production is by proton transfer from N2H+ to CO (N2H+ + CO HCO+ + N2). The model predicts that HCO+ reaches highest abundances in a very thin outer shell with a characteristic radius of 61016 cm. HCO+ has, together with N2H+, the most sharply peaked distribution amongst the ions modeled. The model peak abundance in the shell is (HCO+)10-7, that is larger than the average value derived in OH 231.8 from these observations. Deeper into the envelope, i.e., in the [1015-31016] cm region before the inner rim of the peak abundance shell, HCO+ is formed in much lower amounts ((HCO+)10-11) directly from CO and H, which is a product of cosmic-ray ionization (H + CO HCO+ + H2).
The SO+ shell-like abundance distribution predicted by the model is broader than that of HCO+: for SO+ the inner rim of the shell is located deeper in the envelope than for HCO+. Within the SO+ peak abundance shell, the fractional abundance varies between (SO+)210-12 and [3-4]10-8, the maximum value being reached at a distance of 51016 cm. The SO+ abundance distribution shows a “hump” or secondary peak at 31016 cm where the abundance is (SO+)710-9. The values of the SO+ model abundance inside the shell seem, in principle, compatible with the beam-averaged value deduced in OH 231.8 from our observations. The main formation paths of SO+ in the outer shell are
| (7) |
The reaction of S+ with OH is the dominant formation route near the peak abundance radius; the hump or secondary peak of the SO+ abundance distribution results from direct photoionization of SO by UV photons and the reaction of C+ with SO2 (Eq.LABEL:eq-so+). In regions deeper into the envelope, cosmic rays are the fundamental source of direct ionization of SO leading to the production of SO+ (although in much lower amounts, 10-12, than within the shell) and free electrons.
The spatial distribution of N2H+ predicted by the model is sharply peaked, similar to that of HCO+, but with a very low peak abundance of (N2H+)[0.9-1.0]10-11 that is reached at [5-6]1016 cm. This maximum abundance is more than two orders of magnitude lower than the mean value measured in OH 231.8. Based on our model, N2H+ is formed mainly via
| (8) |
where the first reaction above plays a major role all the way throughout the different layers of the intermediate/outer envelope, whereas the second and third reactions become an important factor in N2H+ production only in the outermost parts near the peak abundance radius. In these outer envelope layers, the ion N is mainly produced by the proton transfer reaction of He+, which is produced by direct ionization of He by UV photons, with N2.
Regarding H3O+, our model predicts efficient formation of this ion in the outer envelope mainly as a product of the photodissociation chain of H2O and CO. The model peak abundance, (H3O+)510-8, which is larger than the observed value, is reached at 51016 cm. Near the peak abundance radius, the distribution of H3O+ is relatively broad and similar in shape and values to that of SO+. In these outer regions, the main reactions involved in the production of H3O+ are
| (9) |
In contrast to the other ions, H3O+ is rather abundant not only within the peak abundance shell but also deeper into the envelope, with a fractional abundance that varies from (H3O+)210-11 at 1015 cm to (H3O+)410-9 at the inner rim of the shell (at 21016 cm). In these inner envelope regions, H3O+ is by far the most abundant of the ions modeled and is produced by protonation of water (H2O+ H H3O+ + H2) after cosmic-ray ionization of H2 leading to H.
In the outer layers of the envelope, dissociative recombination with electrons is the major mode of destruction of all the ions, except for N2H+, which instead is most rapidly destroyed by reactions with H2O and CO. Dissociative recombination with electrons ceases to be the main destruction mechanism for all ions deeper into the envelope, where the electron abundance is low (few10-9). In these inner regions, molecular ions are quickly disassembled primarily by reactions with H2O and NH3 (and, in the case of N2H+, also with CO), i.e.,
| (10) |
The lobes. We have also modeled the chemistry in the walls of the lobes (model ), which are on average more tenuous than the central regions and, thus, enable deep penetration of the ionizing interstellar UV radiation. The main input parameters of the simple physical model adopted for the lobe walls (a rectangular gas slab externally illuminated by one side by the interstellar UV field) are given in Table 4. Our chemical kinetics code computes the evolution with time of the molecular fractional abundances inside a series of individual gas cells at different depths into the lobe walls. An example is given in Fig. 8b for a representative cell midway between the inner and outer edge of the walls (i.e., at 05 through the lobe wall). The depth of the cell into the wall is expressed as a function of the dust optical extinction, . For the cell whose abundances are represented in Fig. 8b, the optical extinction is 1 mag.
The spatial distribution of the model fractional abundances across the lobe walls attained at 800 yr, which is the dynamical age of the outflow (§ 1), is shown in Fig. 8c. As a result of photodissociation, the abundances of all molecular ions rapidly increase inward across the lobe walls, reaching maximum values near 1 mag; at larger depths, the ions’ abundances gently decrease as destruction processes by reactions with H2O, NH3, and CO start prevailing over formation routes. The peak abundances predicted by the model are comparable to the observed beam-averaged values in the case of SO+ , and possibly in the case of H3O+ . In the latter case, the model value is lower than the observational value but the model-data discrepancy, of a factor 2, is probably within the total uncertainties in the abundance calculation. According to the model, these two ions are the only ones that would form in detectable amounts999For the sensitivity limit reached by our observations. in the fast lobes of OH 231.8. In fact, in clear disagreement with the observations, our model predicts H3O+ to be the second most abundant ion (after SO+) in the fast lobes of OH 231.8. For HCO+ and N2H+, the model predicts fractional abundances two orders of magnitude lower than observed. We have checked that the model abundances for these ions never reach values comparable to the observed values for a reasonable range of outflow ages, 500-1000 yr.
For all the ions discussed in this research, the maximum abundances reached within the lobes (model ) are smaller than the maximum abundances reached in the slow, central component (model ). The largest core-to-lobe peak abundance ratio (500) is found for HCO+. The ion N2H+ is predicted to be almost equally deficient in the lobes and in the central, peak abundance shell. SO+ and H3O+ are intermediate cases, with core-to-lobe peak abundance ratios of 4 and 13, respectively.
It may appear a priori somewhat surprising that HCO+, which is predicted by the model to be efficiently produced in the outer regions of the slow, central component (with a peak abundance of (HCO+)10-7), is so scarce across the lobe walls, where the maximum abundance reached is only (HCO+)10-10. This is because the HCO+ formation and destruction processes in the lobes are similar to those prevailing in the deepest regions of the central component, where HCO+ is indeed not very abundant because of the rapid destruction of this ion by reactions with the abundant H2O molecule. In the peak abundance shell of the central component, however, the balance between photochemical formation processes and dissociative recombination with results in an efficient net production of HCO+.
5.1.1 Initial abundance of H2O.
We have investigated how the abundances of the molecular ions under discussion depend on the initial abundance of H2O, which is a prime parent molecule tied up to the chemistry of these and other species. We ran our code using the same input parameters as in the previous section but with a relative abundance of water of (H2O)=310-5 that is ten times lower (Fig. 9). For a given ion, the final role of H2O either as a net builder or a net destroyer, after the balance of formation and destruction reactions with water, varies throughout the envelope and, of course, is different for the different ions considered.
We find that, within the peak abundance shell in model , a decrease of the initial abundance of H2O results in a decrease of the peak abundances for all ions except for N2H+. The peak abundances of HCO+ and SO+ are lowered by a factor 1/3-1/4 and the abundance of H3O+ (and also that of the radical OH) by a factor 1/10. In contrast, the peak abundance of N2H+ increases by a factor 2-3. Moreover, in the low H2O abundance case, N2H+ no longer presents a sharply peaked, shell-like distribution, but rather its abundance progressively increases from the inner layers up to a radius of [4-5]1016 cm; beyond this point, the abundance falls abruptly as for the rest of the species. The markedly different reaction of N2H+ to a decline in the H2O abundance with respect to the other ions is because, in the case of N2H+, H2O provides the main mode of destruction of this ion but is not a required formation ingredient in any of the regions of the envelope (see § 5.1). In contrast, in the outer shell, for HCO+, H3O+, and SO+, water acts only as a main production agent (directly or indirectly via H2O+ and OH).
Deeper into the envelope, HCO+ and N2H+ are the two ions whose abundances are most sensitive to (H2O): our model predicts HCO+ and N2H+ enhancements of one order of magnitude for a similar decrease of the water abundance. In contrast to N2H+, the response of (HCO+) to a change in the water abundance is different in the outer peak abundance shell and in regions deeper into the envelope. This is because, as explained earlier, in the inner envelope regions the formation of HCO+ is principally the result of protonation of CO from H, with H2O acting almost exclusively as a main destroyer. We also find that the model abundances of SO+ and H3O+ vary only marginally in the inner regions when the H2O abundance is lowered. For SO+ this result is readily expected since neither the main formation nor destruction processes in the inner envelope involve water in this case (as discussed in § 5.1). The marginal response of H3O+ to a decrease of (H2O), which a priori seems less predictable than for SO+, is a direct consequence of the enhanced production of HCO+ in the inner envelope when (H2O) is lowered. In the low-water case, because of the (HCO+) increase, the dominant formation route of H3O+ in the inner envelope is by HCO+ + H2O CO + H3O+ (instead of water protonation by H). Therefore, the lower H2O abundance is compensated by the higher abundance of HCO+, which translates to an unaffected H3O+ abundance.
In the lobes (model ), lowering the initial H2O abundance to (H2O)=310-5 produces a different effect at different depths into the lobe walls for HCO+, SO+, and N2H+. In the outer edge of the walls, fully exposed to the ISM UV radiation field (=0 mag), the fractional abundances of these ions remain almost equal or slightly smaller than in the high water abundance case ((H2O)=3), whereas in the shadowed (2.3 mag) inner rim of the lobe walls the predicted abundances are higher, with the largest enhancements (of a factor 20-40) being for HCO+ and N2H+. In the case of H3O+, a lower water abundance results in a lower abundance of this ion in all regions throughout the lobe walls; at the shadowed inner edge of the lobe walls only, both the high and low water abundance models predict a similar value of the H3O+ abundance of (H3O+)210-9.
For all ions modeled, it appears that lowering the water abundance results in the maximum abundance zone moving deeper into the lobe walls. As seen above, another effect is an increase of (HCO+) and (N2H+) in the lobes, however, the model predictions are still significantly lower (2 orders of magnitude) than the abundances observationally deduced. Moreover, the core-to-lobe abundance contrast for HCO+ and SO+ in the low water abundance case (60 and 20, respectively) is still irreconcilable with the broad profiles observed for these species. As in the high water abundance case, N2H+ is equally deficient in the core and in the lobes. In the case of H3O+, the core-to-lobe abundance ratio diminishes to 2-3 for a low H2O abundance.
Finally, by pushing the water abundance to the low end of the range of observed values in O-rich stars, (H2O)10-6, the abundances predicted by our chemistry model in all cases, except maybe for SO+, become much smaller than the observed values both in the slow core component and in the fast lobes.
5.1.2 Enhanced elemental abundance of nitrogen
In this section we examine the behavior of the ions discussed here against an overabundance of the elemental nitrogen (up to a factor 40)101010Elemental N-enrichment can result from hot bottom burning (HBB) processes in the nucleus of 3 stars. and whether such an N-enhancement can explain the large fractional abundance of N2H+ observed in OH 231.8. As in Velilla Prieto et al. (2014), we ran our chemistry code again modifying the initial abundances of those parent species that are most sensitive to the elemental abundance of nitrogen, namely, N2, NH3, and HCN: N2 is increased by a factor 40 and NH3 and HCN by a factor 7 relative to the values in Table 5. We find that the N2H+ peak abundance increases to 210-10 in the slowing expanding shell and to 10-10 in the fast lobes. Therefore, despite the substantial N-enhancement, the model still predicts N2H+ to be underabundant (by one order of magnitude). Moreover, as in the case of a standard N abundance, the model fails to reproduce the enrichment of N2H+ in the fast lobes relative to the slow core deduced from the observations. This was, in fact, expected since changing the elemental abundance of nitrogen comparably affects both the fast and slow outflow components.
The elemental nitrogen enhancement has only a minor effect on the other ions discussed in this research, except for H3O+ and SO+ but only in the deepest layers of the slow central component. In these inner regions, the abundances of H3O+ and SO+ decrease (by a factor 6 and 10, respectively) as these ions are destroyed at larger rates through their interaction with more NH3 molecules (eq. 10).
Given the set of chemical reactions involved in the production and destruction of HCO+ and N2H+, the abundance ratio between these two ions provides an upper limit to the CO to N2 abundance ratio. In OH 231.8, we deduce (HCO+)/(N2H+)6 from the observations and, therefore, one could conclude that [CO]/[N2]6. This value, which is slightly smaller than, but comparable to, the [CO]/[N2]=7.5 ratio in O-rich sources (adopted in our model, Table 5), does not rule out some N enrichment but it also does not clearly point to a significant nitrogen excess. Based on observations and modeling of the [N ii]6548,6584Å emission (and other optical lines) from the shock-excited regions at the tips of the lobes of OH 231.8, Cohen et al. (1985) suggest that N may be overabundant in these regions by a factor 5 relative to the solar value. This factor is much smaller than that used here to test this effect (40), and that has been proven to be unable to bring the model N2H+ abundance close enough to the observed value.
We also recall that an enhancement of the elemental nitrogen is not able to reproduce satisfactorily the observed abundances of HNCO, HNCS, HC3N, and NO recently discovered in OH 231.8 (Velilla Prieto et al., 2014): on the one hand, HNCO, HNCS, and HC3N would be underestimated and, on the other hand, NO (and maybe others, such as NH3) would be significantly overestimated. Moreover, there are other N-bearing molecules that, in contrast to N2H+, are not particularly abundant in OH 231.8. One example is HCN: while the average abundance of this molecule in O-rich CSEs is relatively large (HCN)10-7 (Bujarrabal et al., 1994; Schöier et al., 2013), and actually larger than predicted by standard chemistry models (e.g., Nercessian et al., 1989), the value found in OH 231.8 is (HCN)few10-8 (Sánchez Contreras et al., 1997, 2014).
In any case, an enhancement of the elemental N abundance would at most be able to reduce the model-data discrepancies for N-bearing species, but it is unlikely to help improve the model predictions for all the other molecules that are not chemical daughter products of N2, such as the ions HCO+, SO+, and H3O+ reported in this work.
6 Discussion and conclusions
Based on single-dish observations with the IRAM 30 m and Herschel telescopes, we have detected HCO+, H13CO+, SO+, N2H+, and (tentatively) H3O+ in OH 231.8. The broad line profiles (with FWHM of up to 90 km s-1) and low-excitation temperature (10-20 K) deduced for HCO+, H13CO+, SO+, and N2H+, support the location of these ions preferentially in the base of the cold high-velocity lobes of OH 231.8. The fact that the narrow emission component from the massive central parts of the nebula (clump I3) is minimal in the profiles of these ions, clearly points to an abundance enhancement in the fast lobes relative to the slow core. Although uncertain, the much narrower profile (FWHM14 km s-1) and higher excitation conditions (100 K) suspected for H3O+ suggest a different spatial distribution for this ion, which may be more concentrated toward the central parts of the slow, central core.
Our chemical kinetics model predicts that HCO+, SO+, and H3O+ can form profusely (with peak abundances of 10-8) in the external layers of the slow central regions of OH 231.8 and thus, most generally, in similar O-rich CSEs. A moderate production of H3O+ (with fractional abundances of up to 10-9) is also expected in regions deeper into the envelope. The production of N2H+ is, however, rather inefficient, leading to very low fractional abundances of (N2H+)10-11.
In the fast lobes of OH 231.8, our standard chemistry model predicts relatively high abundances for SO+ and H3O+ (of up to 10-9); however, we predict that HCO+ and N2H+ are very scarce, with abundances of 10-10 and 10-12, respectively.
There are various observational results that our chemistry model fails to reproduce satisfactorily. In particular, the high HCO+ and N2H+ abundances in the fast lobes deduced from the observed profiles. If these ions were present in the lobes in the low amounts predicted by the model, their emission would have remained undetected in our survey. Another model prediction that is inconsistent with the observations is that all ions should be more abundant in the slow core than in the fast lobes, however, the broad profiles of HCO+, N2H+, and SO+, reflect exactly the opposite. One of the most extreme cases is HCO+, for which the model predicts a core-to-lobe abundance ratio of 500 versus the measured value of 1/3-1/4; the latter value is deduced from the broad, flattened profiles we report, and from accurate characterization of the HCO+ spatio-kinematic distribution obtained from previous single-dish and interferometric mapping (§ 1).
Regarding H3O+, the model predicts a spatial distribution analogous to those of the other ions, i.e., peaking at the external layers of the slow central core due to photodissociation processes. This distribution is not easily reconcilable with the suspected origin for the H3O+ emission in the deep (slow and warm) regions of the central core. The model predicts a detectable amount of H3O+, of 10-9, in the fast lobes that is not consistent with our observations. The tentative H3O+ abundance distribution in OH 231.8 deduced from our observations needs, however, to be confirmed by higher quality data.
The large core-to-lobe abundance ratio of HCO+, SO+, and N2H+ predicted by the model can be reduced (but not suppressed) by adopting a lower initial H2O abundance of 310-5 (instead of 310-4 used in our standard model). Also, lowering the water content injected to the intermediate/outer envelope would produce somewhat lower values of the peak abundances of H3O+, which is probably overabundant in the external envelope layers in our standard model.
We also find that an elemental nitrogen overabundance in OH 231.8 (by a factor of up to 40) is not able to produce sufficient N2H+, which remains one order of magnitude less abundant than observed. We believe that the model’s inability to explain the large abundance of N2H+ is not mainly a problem caused by an assumed nitrogen abundance that is too low. A similar problem also resides in NH3 in the majority of O-rich CSEs, which contain ammonia in amounts that exceed predictions from conventional chemical models by many orders of magnitude (e.g., Menten et al., 2010; Menten & Alcolea, 1995).
6.1 Molecule reformation after the passage of fast dissociative shocks?
Taking into consideration the various important model-data discrepancies deduced from our analysis, we must conclude that the standard molecular formation scenario adopted (triggered by ionization by UV photons and cosmic rays of gas whose initial state is predominantly molecular) is too simple and/or does not correctly depict the recent molecular formation history of OH 231.8. The adopted scenario, however, may represent the chemistry of most molecules in the intermediate/outer layers of normal AGB CSEs reasonably well (see, e.g., Nejad & Millar, 1988; Glassgold, 1996; Millar et al., 2000; Agúndez et al., 2008).
The notable chemical differences between OH 231.8 and most O-rich AGB CSEs are widely recognized and are not restricted to the ions discussed here but affect most of the species identified in this object (§ 1). Since the earliest studies on the molecular composition of OH 231.8, the remarkable molecular richness of this source has been related to shocks. Indeed, the main difference between OH 231.8 and ’normal’ O-rich AGB CSEs is the presence of a fast (400 km s-1) outflow in OH 231.8. If the acceleration of the bipolar lobes resulted from the violent collision between underlying fast jets on the pre-existing slow AGB wind, as proposed by many authors, then shocks must have necessarily played a major role in defining the current chemical composition of the outflow.
In particular, given the high velocities observed in the fast outflow of OH 231.8, it is unlikely that molecules survived this kind of acceleration process but rather they were probably dissociated. Molecules are indeed expected to be destroyed by shocks with speeds larger than 50 km s-1 (e.g., Hollenbach & McKee, 1980). After the shocked gas has cooled below 104 K, atoms begin to associate and form molecules again; if the post-shock gas is moderately dense (e.g., 105-106 cm-3), molecule reformation can happen indeed rather quickly, within a few years from the shock (e.g., Glassgold et al., 1989; Neufeld & Dalgarno, 1989). We believe that most molecules observed in the fast outflow of OH 231.8, if shock accelerated, must have dissociated and reformed in the post-shock gas. A similar scenario has been proposed to explain the chemistry in the high-velocity molecular outflow of the C-rich PPN CRL 618 (Neri et al., 1992).
At present, the shocks that accelerated the outflow 800 yr ago are not active, therefore, the bulk of the molecular outflow in OH 231.8 is probably swept-up AGB wind material that has cooled down sufficiently to allow molecule reformation. Note that the lobe axial acceleration took place in less than 150 yr, which may have been the duration of, e.g., a pulsed fast wind.
The physical properties (density and temperature) of the fast post-shock gas, which could have been fully dissociated and fully ionized 800 yr ago, must have evolved as a function of time. In particular, the temperature in the lobes has certainly decreased to its current value of 10-20 K. The assembly of new molecules would have happened progressively while the shock-heated material was cooling down. The ionized, atomic, and molecular fractions in the post-shock gas must have also evolved with time in a way that is not easy to predict, over the course of the cooling and molecular regeneration. [In particular, a transition from an H+-dominated regime to an H2-dominated regime, passing through an intermediate H-dominated phase, has probably happened.] Since these are the basic ingredients for putting together new molecules, their evolution with time must have dictated the set of chemical reactions that were dominant at each precise moment over the course of molecular regeneration leading to the final molecular content observed at present.
We increase the number of observational studies and chemistry modeling of molecular ions, which is needed to make progress in determining the role of ion-molecule reactions in the chemistry scheme of O-rich CSEs. Taking the presence of fast outflows and the probable shock-acceleration history of the envelope of OH 231.8 into account, the observations reported here may contribute to the emergence of an observational picture of the effects of shocks on the molecular chemistry of circumstellar envelopes. In the future, it would be desirable to attempt new chemical kinetics models adopting the molecule reformation scenario proposed here for OH 231.8. This is a difficult task since determining the time dependence of the relevant physical parameters of the cooling gas, where second-generation species have formed, is a challenging theoretical problem. Undoubtedly, it would also be advantageous to enlarge the reaction network used in most standard chemistry models by including additional chemical reactions that may affect the predicted abundances of certain species (e.g., grain-surface reactions, X-rays, etc).
Acknowledgements.
Herschel is an ESA space observatory with science instruments provided by European-led Principal Investigator consortia and with important participation from NASA. HIFI is the Herschel Heterodyne Instrument for the Far Infrared. HIFI has been designed and built by a consortium of institutes and university departments from across Europe, Canada and the United States under the leadership of SRON Netherlands Institute for Space Research, Groningen, The Netherlands and with major contributions from Germany, France and the US. Consortium members are: Canada: CSA, U. Waterloo; France: CESR, LAB, LERMA, IRAM; Germany: KOSMA, MPIfR, MPS; Ireland, NUI Maynooth; Italy: ASI, IFSI-INAF, Osservatorio Astrofisico di Arcetri- INAF; Netherlands: SRON, TUD; Poland: CAMK, CBK; Spain: Observatorio Astronómico Nacional (IGN), Centro de Astrobiología (CSIC-INTA); Sweden: Chalmers University of Technology – MC2, RSS & GARD; Onsala Space Observatory; Swedish National Space Board, Stockholm University – Stockholm Observatory; Switzerland: ETH Zurich, FHNW; USA: Caltech, JPL, NHSC. HCSS / HSpot / HIPE is a joint development by the Herschel Science Ground Segment Consortium, consisting of ESA, the NASA Herschel Science Center, and the HIFI, PACS and SPIRE consortia. This work has been partially supported by the Spanish MINECO through grants CSD2009-00038, AYA2009-07304, and AYA2012-32032. This research has made use of the SIMBAD database, operated at CDS, Strasbourg, France, the NASA’s Astrophysics Data System, and Aladin.References
- Adande et al. (2010) Adande, G. R., Halfen, D. T., Ziurys, L. M., Quan, D., & Herbst, E. 2010, ApJ, 725, 561
- Agúndez & Cernicharo (2006) Agúndez, M., & Cernicharo, J. 2006, ApJ, 650, 374
- Agúndez et al. (2007) Agúndez, M., Cernicharo, J., & Guélin, M. 2007, ApJ, 662, L91
- Agúndez et al. (2008) Agúndez, M., Fonfría, J. P., Cernicharo, J., Pardo, J. R., & Guélin, M. 2008, A&A, 479, 493
- Agúndez et al. (2010a) Agúndez, M., Cernicharo, J., Guélin, M., et al. 2010, A&A, 517, LL2
- Agúndez et al. (2010b) Agúndez, M., Cernicharo, J., & Guélin, M. 2010, ApJ, 724, L133
- Agúndez et al. (2012) Agúndez, M., Fonfría, J. P., Cernicharo, J., et al. 2012, A&A, 543, A48
- Agúndez & Cernicharo (2006) Agúndez, M., & Cernicharo, J. 2006, ApJ, 650, 374
- Alcolea et al. (2001) Alcolea, J., Bujarrabal, V., Sánchez Contreras, C., Neri, R., & Zweigle, J. 2001, A&A, 373, 932
- Aleman et al. (2014) Aleman, I., Ueta, T., Ladjal, D., et al. 2014, A&A, 566, A79
- Amano, Amano, & Warner (1991) Amano, T., Amano, T., & Warner, H.E. 1991, J. Molec. Spectrosc., 146, 519
- Asplund et al. (2009) Asplund, M., Grevesse, N., Sauval, A. J., & Scott, P. 2009, ARA&A, 47, 481
- Balick & Frank (2002) Balick, B., & Frank, A. 2002, ARA&A, 40, 439
- Bohlin et al. (1978) Bohlin, R. C., Savage, B. D., & Drake, J. F. 1978, ApJ, 224, 132
- Bowers & Morris (1984) Bowers, P. F., & Morris, M. 1984, ApJ, 276, 646
- Bujarrabal et al. (1988) Bujarrabal, V., Gomez-Gonzalez, J., Bachiller, R., & Martin-Pintado, J. 1988, A&A, 204, 242
- Bujarrabal et al. (1994) Bujarrabal, V., Fuente, A., & Omont, A. 1994, A&A, 285, 247
- Bujarrabal et al. (2001) Bujarrabal, V., Castro-Carrizo, A., Alcolea, J., & Sánchez Contreras, C. 2001, A&A, 377, 868
- Bujarrabal et al. (2002) Bujarrabal, V., Alcolea, J., Sánchez Contreras, C., & Sahai, R. 2002, A&A, 389, 271
- Carter et al. (2012) Carter, M., Lazareff, B., Maier, D., et al. 2012, A&A, 538, A89
- Castro-Carrizo et al. (2010) Castro-Carrizo, A., et al. 2010, A&A, 523, A59
- Cernicharo et al. (1997) Cernicharo, J., Liu, X.-W., González-Alfonso, E., et al. 1997, ApJ, 483, L65
- Cernicharo et al. (2007) Cernicharo, J., Guélin, M., Agündez, M., et al. 2007, A&A, 467, L37
- Cernicharo et al. (2010) Cernicharo, J., Waters, L. B. F. M., Decin, L., et al. 2010, A&A, 521, L8
- Cernicharo & Bachiller (2011) The Molecular Universe, eds. Cernicharo, J., & Bachiller, R. 2011, (Cambridge Univ. Press), IAU Symposium, 280, 237.
- Cernicharo (2012) Cernicharo, J. 2012, EAS Publications Series, 58, 251
- Cernicharo et al. (2013) Cernicharo, J., Daniel, F., Castro-Carrizo, A., et al. 2013, ApJ, 778, L25
- Choi et al. (2012) Choi, Y. K., Brunthaler, A., Menten, K. M., & Reid, M. J. 2012, IAU Symposium, 287, 407
- Claude et al. (2000) Claude, S. M. X., Avery, L. W., & Matthews, H. E. 2000, ApJ, 545, 379
- Cohen (1981) Cohen, M. 1981, PASP, 93, 288
- Cohen et al. (1985) Cohen, M., Dopita, M. A., Schwartz, R. D., & Tielens, A. G. G. M. 1985, ApJ, 297, 702
- Dalgarno (2006) Dalgarno, A. 2006, Proceedings of the National Academy of Science, 103, 12269
- Daniel et al. (2005) Daniel, F., Dubernet, M.-L., Meuwly, M., Cernicharo, J., & Pagani, L. 2005, MNRAS, 363, 1083
- Desmurs et al. (2007) Desmurs, J.-F., Alcolea, J., Bujarrabal, V., Sánchez Contreras, C., & Colomer, F. 2007, A&A, 468, 189
- Draine & Salpeter (1978) Draine, B. T., & Salpeter, E. E. 1978, Nature, 271, 730
- Etxaluze et al. (2014) Etxaluze, M., Cernicharo, J., Goicoechea, J. R., et al. 2014, A&A, 566, A78
- Feast et al. (1983) Feast, M. W., Catchpole, R. M., Whitelock, P. A., et al. 1983, MNRAS, 203, 1207
- Flower (1999) Flower, D. R. 1999, MNRAS, 305, 651
- Forde & Gledhill (2012) Forde, K. P., & Gledhill, T. M. 2012, MNRAS, 421, L49
- de Graauw et al. (2010) de Graauw, T., Helmich, F. P., Phillips, T. G., et al. 2010, A&A, 518, L6
- Glassgold et al. (1989) Glassgold, A. E., Mamon, G. A., & Huggins, P. J. 1989, ApJ, 336, L29
- Glassgold (1996) Glassgold, A. E. 1996, ARA&A, 34, 241
- Goldsmith & Langer (1999) Goldsmith, P. F., & Langer, W. D. 1999, ApJ, 517, 209
- Goicoechea & Cernicharo (2001) Goicoechea, J. R., & Cernicharo, J. 2001, ApJ, 554, L213
- González Delgado et al. (2003) González Delgado, D., Olofsson, H., Kerschbaum, F., et al. 2003, A&A, 411, 123
- Guilloteau et al. (1986) Guilloteau, S., Lucas, R., Omont, A., & Nguyen-Q-Rieu 1986, A&A, 165, L1
- Habing (1968) Habing, H. J. 1968, Bull. Astron. Inst. Netherlands, 19, 421
- Hasegawa & Kwok (2001) Hasegawa, T. I., & Kwok, S. 2001, ApJ, 562, 824
- Hollenbach & McKee (1980) Hollenbach, D., & McKee, C. F. 1980, ApJ, 241, L47
- Jura & Morris (1985) Jura, M., & Morris, M. 1985, ApJ, 292, 487
- Jura et al. (2002) Jura, M., Chen, C., & Plavchan, P. 2002, ApJ, 574, 963
- Kastner et al. (1992) Kastner, J. H., Weintraub, D. A., Zuckerman, B., et al. 1992, ApJ, 398, 552
- Kastner & Weintraub (1995) Kastner, J. H., & Weintraub, D. A. 1995, AJ, 109, 1211
- Knapp (1985) Knapp, G. R. 1985, ApJ, 293, 273
- Kozlov & Levshakov (2011) Kozlov, M. G., & Levshakov, S. A. 2011, ApJ, 726, 65
- Kramer (1997) Kramer, C. “Calibration of spectral line data at the IRAM 30m radio telescope”, IRAM report.
- Leal-Ferreira et al. (2012) Leal-Ferreira, M. L., Vlemmings, W. H. T., Diamond, P. J., et al. 2012, A&A, 540, A42
- Lindqvist et al. (1992) Lindqvist, M., Olofsson, H., Winnberg, A., & Nyman, L. A. 1992, A&A, 263, 183
- Maercker et al. (2008) Maercker, M., Schöier, F. L., Olofsson, H., Bergman, P., & Ramstedt, S. 2008, A&A, 479, 779
- Mamon et al. (1987) Mamon, G. A., Glassgold, A. E., & Omont, A. 1987, ApJ, 323, 306
- Matsuura et al. (2006) Matsuura, M., Chesneau, O., Zijlstra, A. A., et al. 2006, ApJ, 646, L123
- McCarthy et al. (2006) McCarthy, M. C., Gottlieb, C. A., Gupta, H., & Thaddeus, P. 2006, ApJ, 652, L141
- Menten & Alcolea (1995) Menten, K. M., & Alcolea, J. 1995, ApJ, 448, 416
- Menten et al. (2010) Menten, K. M., Wyrowski, F., Alcolea, J., et al. 2010, A&A, 521, LL7
- Milam et al. (2009) Milam, S. N., Woolf, N. J., & Ziurys, L. M. 2009, ApJ, 690, 837
- Millar et al. (2000) Millar, T. J., Herbst, E., & Bettens, R. P. A. 2000, MNRAS, 316, 195
- Morris et al. (1982) Morris, M., Bowers, P. F., & Turner, B. E. 1982, ApJ, 259, 625
- Morris et al. (1987) Morris, M., Guilloteau, S., Lucas, R., & Omont, A. 1987, ApJ, 321, 888
- Müller et al. (2005) Müller, H. S. P., Schlöder, F., Stutzki, J., & Winnewisser, G. 2005, Journal of Molecular Structure, 742, 215
- Nejad & Millar (1988) Nejad, L. A. M., & Millar, T. J. 1988, MNRAS, 230, 79
- Nercessian et al. (1989) Nercessian, E., Omont, A., Benayoun, J. J., & Guilloteau, S. 1989, A&A, 210, 225
- Neri et al. (1992) Neri, R., Garcia-Burillo, S., Guelin, M., et al. 1992, A&A, 262, 544
- Neri et al. (1998) Neri, R., Kahane, C., Lucas, R., Bujarrabal, V., & Loup, C. 1998, A&AS, 130, 1
- Neufeld & Dalgarno (1989) Neufeld, D. A., & Dalgarno, A. 1989, ApJ, 340, 869
- Neufeld (1990) Neufeld, D. A. 1990, Molecular Astrophysics, 374
- Omont al. (1993) Omont, A., Lucas, R., Morris, M., & Guilloteau, S. 1993, A&A, 267, 490
- Ott (2010) Ott, S. 2010, Astronomical Data Analysis Software and Systems XIX, 434, 139
- Pardo et al. (2007) Pardo, J. R., Cernicharo, J., Goicoechea, J. R., Guélin, M., & Asensio Ramos, A. 2007, ApJ, 661, 250
- Pickett et al. (1998) H. M. Pickett, R. L. Poynter, E. A. Cohen, M. L. Delitsky, J. C. Pearson, and H. S. P. Muller, 1998, Journal of Quantitative Spectroscopy and Radiative Transfer 60, 883-890
- Phillips et al. (1992) Phillips, T. G., van Dishoeck, E. F., & Keene, J. 1992, ApJ, 399, 533
- Pilbratt et al. (2010) Pilbratt, G. L., Riedinger, J. R., Passvogel, T., et al. 2010, A&A, 518, L1
- Pulliam et al. (2011) Pulliam, R. L., Edwards, J. L., & Ziurys, L. M. 2011, ApJ, 743, 36
- Quintana-Lacaci et al. (2013) Quintana-Lacaci, G., Agúndez, M., Cernicharo, J., et al. 2013, A&A, 560, L2
- Ramstedt & Olofsson (2014) Ramstedt, S., & Olofsson, H. 2014, A&A, 566, A145
- Reipurth (1987) Reipurth, B. 1987, Nature, 325, 787
- Roelfsema et al. (2012) Roelfsema, P. R., Helmich, F. P., Teyssier, D., et al. 2012, A&A, 537, A17
- Sabin et al. (2014) Sabin, L., Zhang, Q., Zijlstra, A. A., et al. 2014, MNRAS, 438, 1794
- Sahai & Trauger (1998) Sahai, R., & Trauger, J. T. 1998, AJ, 116, 1357
- Sánchez Contreras et al. (1997) Sánchez Contreras, C., Bujarrabal, V., & Alcolea, J. 1997, A&A, 327, 689
- Sánchez Contreras et al. (1998) Sanchez Contreras, C., Alcolea, J., Bujarrabal, V., & Neri, R. 1998, A&A, 337, 233
- Sánchez Contreras et al. (2000) Sánchez Contreras, C., Bujarrabal, V., Neri, R., & Alcolea, J. 2000, A&A, 357, 651
- Sánchez Contreras et al. (2002) Sánchez Contreras, C., Desmurs, J. F., Bujarrabal, V., Alcolea, J., & Colomer, F. 2002, A&A, 385, L1
- Sánchez Contreras et al. (2004) Sánchez Contreras, C., Gil de Paz, A., & Sahai, R. 2004, ApJ, 616, 519
- Sánchez Contreras et al. (2011) Sánchez Contreras, C., Velilla Prieto, L., Cernicharo, J., et al. 2011, IAU Symposium, 280, 327P
- Sánchez Contreras & Sahai (2012) Sánchez Contreras, C., & Sahai, R. 2012, ApJS, 203, 16
- Sánchez Contreras et al. (2014) Sánchez Contreras, C., Velilla, L., Alcolea, J., et al. 2014, Asymmetrical Planetary Nebulae VI conference, Proceedings of the conference held 4-8 November, 2013. Edited by C. Morisset, G. Delgado-Inglada and S. Torres-Peimbert. Online at http://www.astroscu.unam.mx/apn6/PROCEEDINGS/, id. #88,
- Schöier et al. (2007) Schöier, F. L., Bast, J., Olofsson, H., & Lindqvist, M. 2007, A&A, 473, 871
- Schöier et al. (2013) Schöier, F. L., Ramstedt, S., Olofsson, H., et al. 2013, A&A, 550, A78
- Soker & Kashi (2012) Soker, N., & Kashi, A. 2012, ApJ, 746, 100
- Tenenbaum et al. (2007) Tenenbaum, E. D., Woolf, N. J., & Ziurys, L. M. 2007, ApJ, 666, L29
- Teyssier et al. (2006) Teyssier, D., Hernandez, R., Bujarrabal, V., Yoshida, H., & Phillips, T. G. 2006, A&A, 450, 167
- Turner (1971) Turner, B. E. 1971, ApJ, 163, L35
- Turner (1992) Turner, B. E. 1992, ApJ, 396, L107
- Tsuji et al. (1997) Tsuji, T., Ohnaka, K., Aoki, W., & Yamamura, I. 1997, A&A, 320, L1
- Velilla Prieto et al. (2013) Velilla Prieto, L., Sánchez Contreras, C., Cernicharo, J., et al. 2013, Highlights of Spanish Astrophysics VII, 676
- Velilla Prieto et al. (2014) Velilla Prieto, L., Sánchez Contreras, C., Cernicharo, J., M. Agúndez, G. Quintana-Lacaci, J. Alcolea, V. Bujarrabal, F. Herpin, K. M. Menten, and F. Wyrowsky, 2014, å in press (eprint arXiv:1412.2074)
- Willacy & Millar (1997) Willacy, K., & Millar, T. J. 1997, A&A, 324, 237
- Wootten et al. (1991) Wootten, A., Mangum, J. G., Turner, B. E., et al. 1991, ApJ, 380, L79
- Zhang et al. (2008) Zhang, Y., Kwok, S., & Dinh-V-Trung 2008, ApJ, 678, 328
- Zijlstra et al. (2001) Zijlstra, A. A., Chapman, J. M., te Lintel Hekkert, P., et al. 2001, MNRAS, 322, 280
- Ziurys et al. (2007) Ziurys, L. M., Milam, S. N., Apponi, A. J., & Woolf, N. J. 2007, Nature, 447, 1094
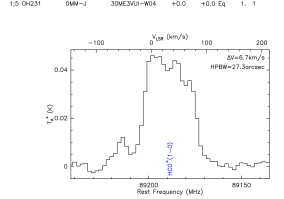
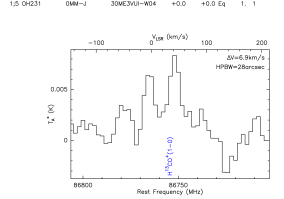
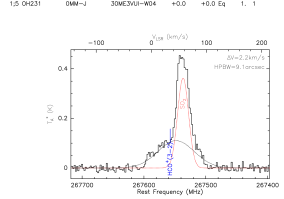
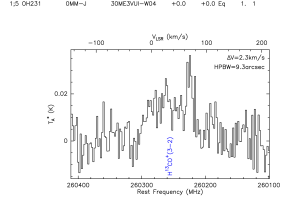
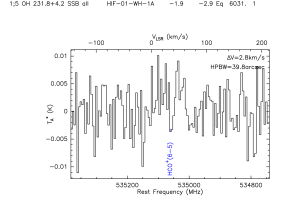
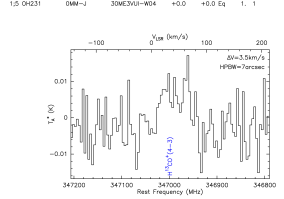
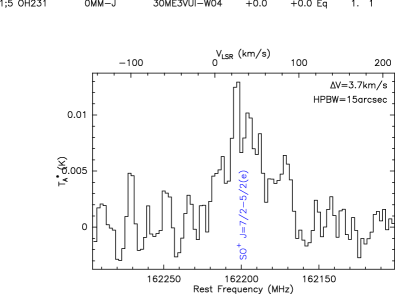
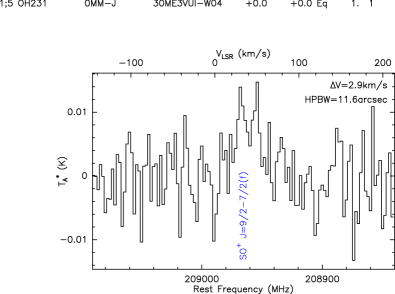
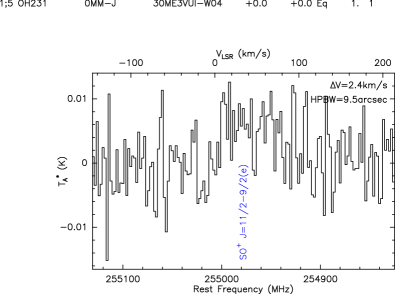
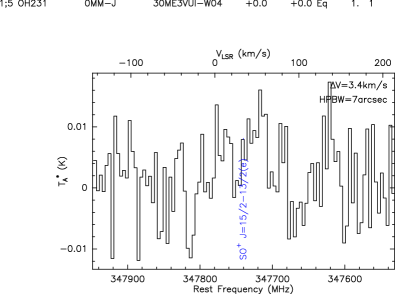
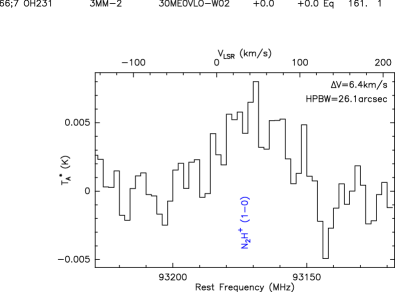
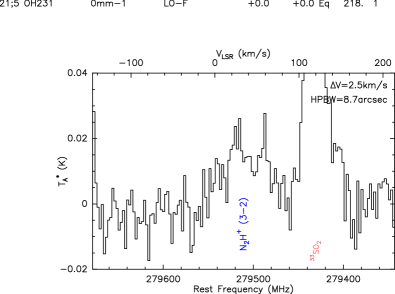
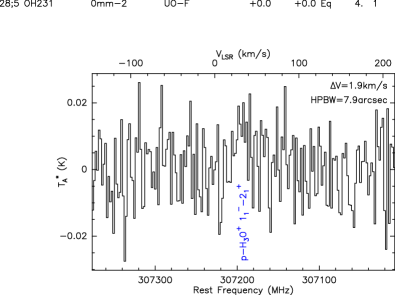
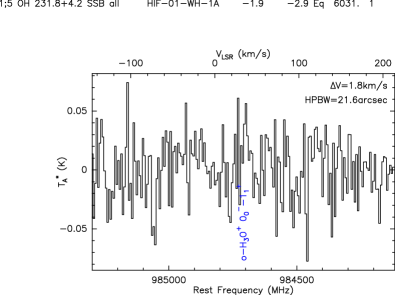
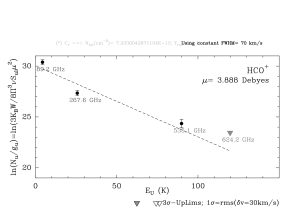
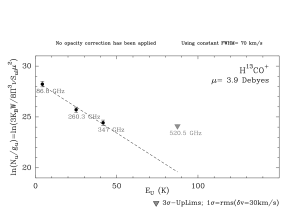
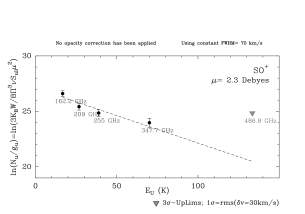
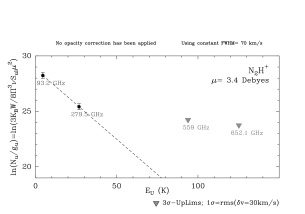
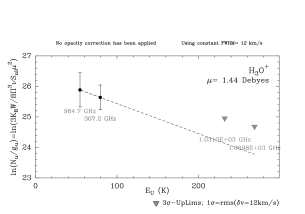
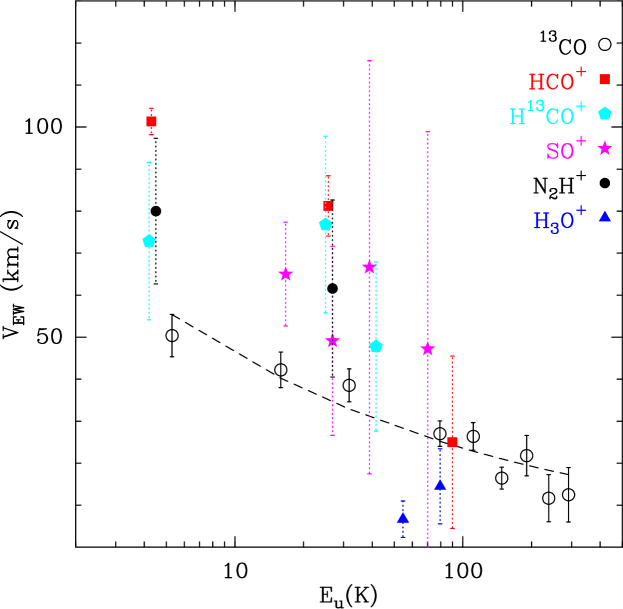
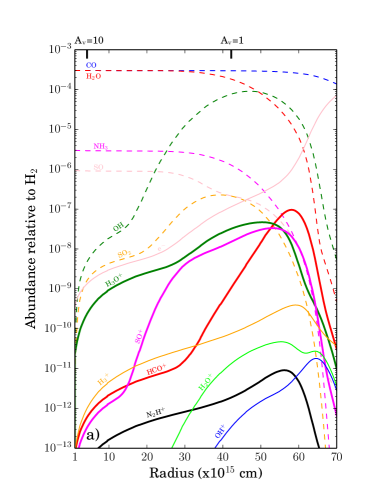
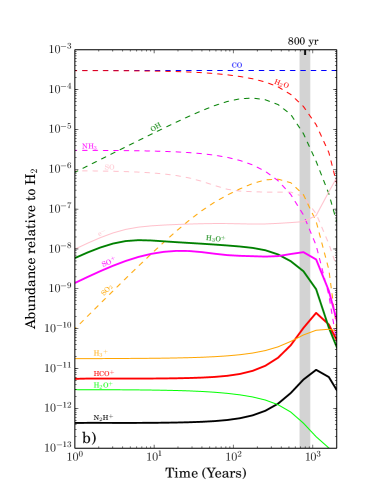
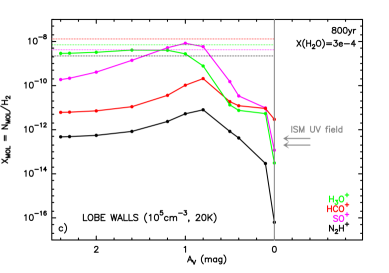
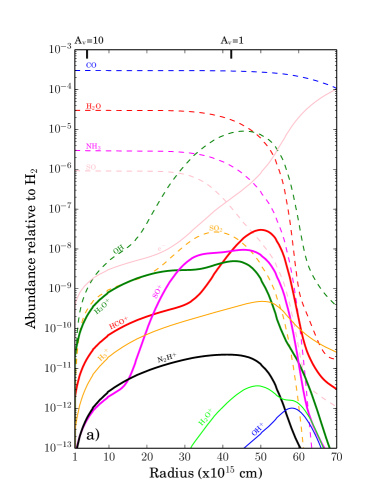
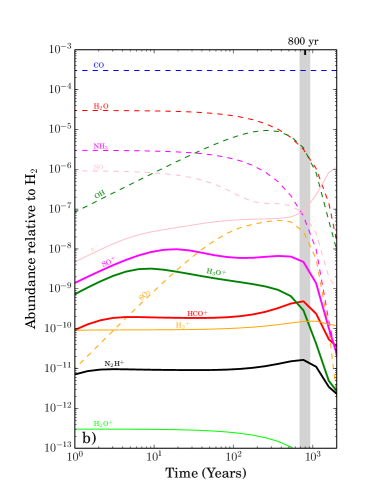
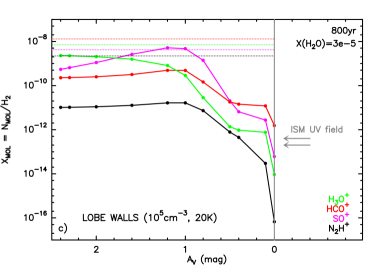
Appendix A The HIFI beam pattern
| Mixer | HPBW | ||||
|---|---|---|---|---|---|
| (GHz) | (″) | (m) | |||
| 1H | 480 | 43.1 | 0.62 | 0.624 0.007 | 2.278 0.004 |
| 1V | 480 | 43.5 | 0.62 | 0.618 0.007 | 2.248 0.004 |
| 2H | 640 | 32.9 | 0.64 | 0.643 0.009 | 2.219 0.003 |
| 2V | 640 | 32.8 | 0.66 | 0.662 0.009 | 2.224 0.002 |
| 3H | 800 | 26.3 | 0.62 | 0.626 0.008 | 2.227 0.004 |
| 3V | 800 | 25.8 | 0.63 | 0.639 0.008 | 2.287 0.010 |
| 4H | 960 | 21.9 | 0.63 | 0.639 0.008 | 2.227 0.004 |
| 4V | 960 | 21.7 | 0.64 | 0.643 0.008 | 2.252 0.006 |
| 5H | 1120 | 19.6 | 0.59 | 0.595 0.006 | 2.068 0.005 |
| 5V | 1120 | 19.4 | 0.59 | 0.597 0.006 | 2.114 0.005 |
The HIFI beam pattern (size, efficiency, etc) is described by Roelfsema et al. (2012). In October 2014, a release note was issued by the HIFI calibration team (Mueller et al. 2014111111The HIFI Beam: Release #1. Release Note for Astronomers – http://herschel.esac.esa.int/twiki/bin/view/Public/HifiCalibrationWeb#HIFI_performance_and_calibration.) reporting improved measures of the half-power beam width (HPBW) and main-beam efficiency () that supersede previous estimates in Roelfsema et al. (2012). The new efficiency estimates are systematically lower than previous values by typically 15–20% for .
For convenience, we reproduce again in this appendix the updated values of the relevant beam-model parameters provided by Mueller et al. (2014) in Tables 2 and 3 of their release note. These values, given in Table 6, are used to obtain the formulae (Eq. 2 in § 2.2) that describe the frequency/wavelength dependence of HPBW and for the HIFI bands (1 through 5) used in this work. Since we average the H and V polarization data to obtain final spectra, we use the average of for H and V at a given frequency in order to convert antenna temperatures () to a main-beam scale () at that frequency. We recall that, as stated in § 2:
Appendix B Additional material
In this Appendix, we include additional material for the ion SO+ and the molecule 13CO in OH 231.8.
In Fig. 10, we show all the SO+ transitions (detected and nondetected) observed within the frequency range covered in our survey with the IRAM 30 m telescope. Some of the SO+ lines are blended with transitions of other molecules and/or are in particularly noisy regions and have not been considered for the rotational diagram analysis presented in Section 4.1.
A total of nine 13CO transitions have been detected in OH 231.8 from our surveys with IRAM 30 m and Herschel (Fig. 11 and Table 7). The 13CO lines, which are good tracers of the density and kinematics of the nebula, show structured profiles with two main components: (1) a prominent, relatively narrow core (centered around the systemic velocity of the source, 33-34 km s-1) plus weaker, broad wings. The line core arises at the slow, dense central (low-latitude) parts of the nebula, which expand at relatively low velocities of 10-35km s-1 (clump I3), whereas the wing emission mainly arises at the fast, bipolar lobes (see § 1 and Fig. 1). (As explained in the Introduction, the spatio-kinematic structure of the molecular outflow of OH 231.8 is well known from previous single-dish and interferemtric maps of 12CO). The large core-to-wing intensity ratio of the 13CO profiles is consistent with most (70%) of the mass in the molecular outflow being in the slow central regions (Sánchez Contreras et al., 1997; Alcolea et al., 2001).
The 13CO wing emission progressively weakens, relative to the core, at higher frequencies. For transitions observed with the same telescope (i.e., for the three 3 lines observed with IRAM 30 m or for the six 5 lines observed with Herschel), this trend is partially explained by the smaller beam and, thus, the smaller fraction of the fast outflow sampled by the observations at higher frequencies. However, this is not the only reason, since at all frequencies the Herschel beam is comparable to, or larger than, the IRAM 30 m beam, with a maximum size of HPBW=221 at 110 GHz for the observations reported here.
Both the full width of the wings and the full width at half maximum of the 13CO profiles decrease as the upper energy level increases. The full width of the wings is largest for the 13CO (=10) transition, which is observed over a velocity range of =[80:140] km s-1 with a beam HPBW=22.1″, and decreases for higher- transitions down to =[15:55] km s-1 for the =7–6 line, observed with a comparable beam of HPBW=27.6″; for transitions with 7, we do not detect wing emission. The FWHM of the 13CO lines ranges between 36 to 14 km s-1 for the =1–0 and the 10–9 transitions, respectively. An analogous behavior is observed in most molecules observed in our surveys with IRAM 30 m and Herschel, including 12CO (Sánchez Contreras et al., 2014, Sánchez Conteras et al., in prep.). The observed trend suggests that the envelope layers with higher excitation conditions (i.e., warmer and, thus, presumably closer to the central star) are characterized by lower expansion velocities.
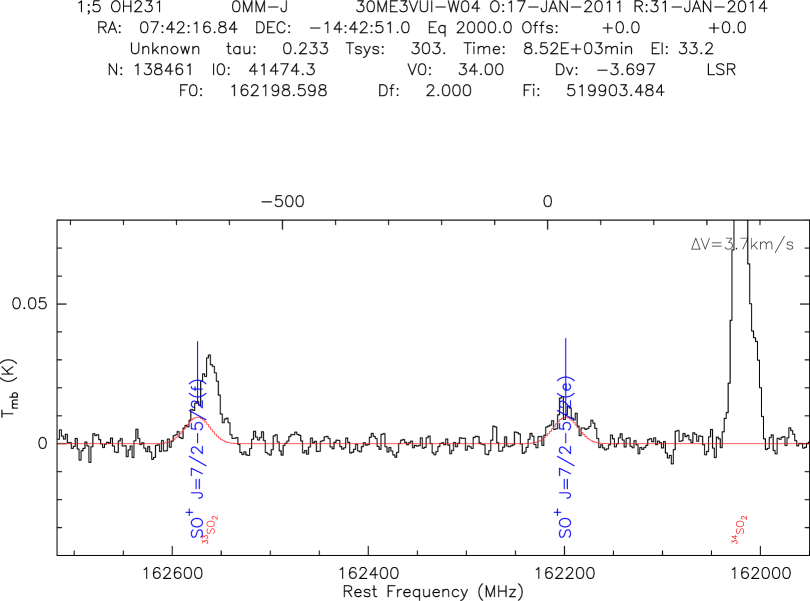
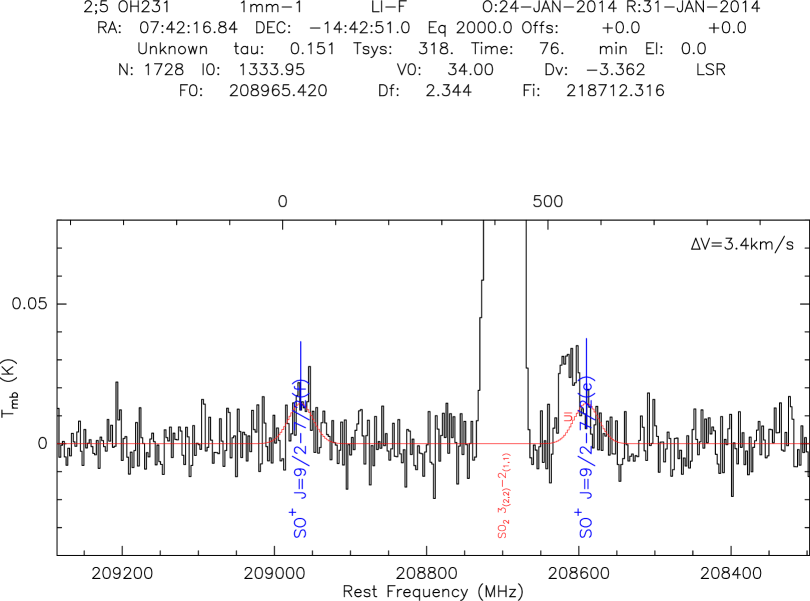
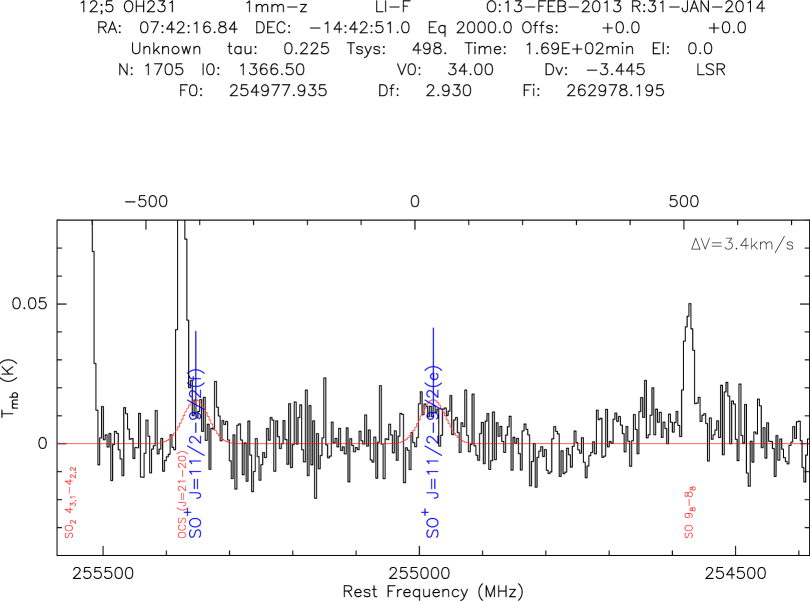
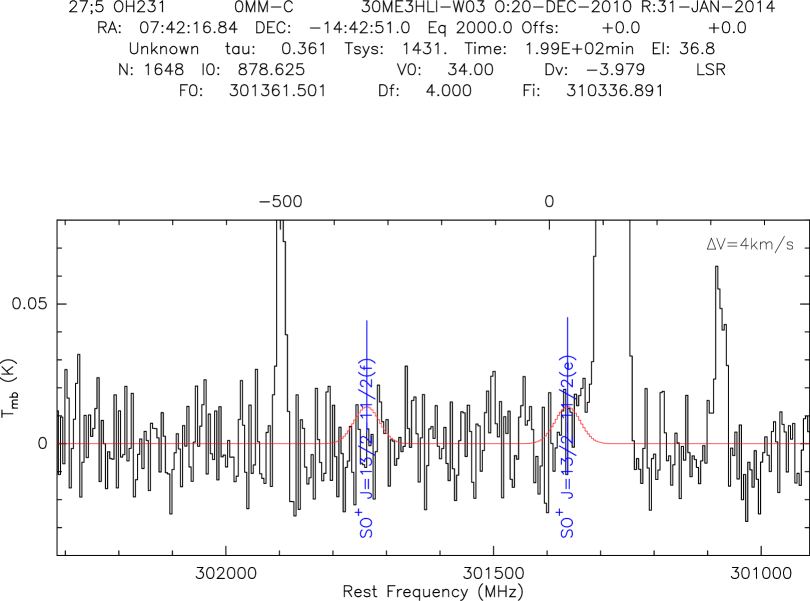
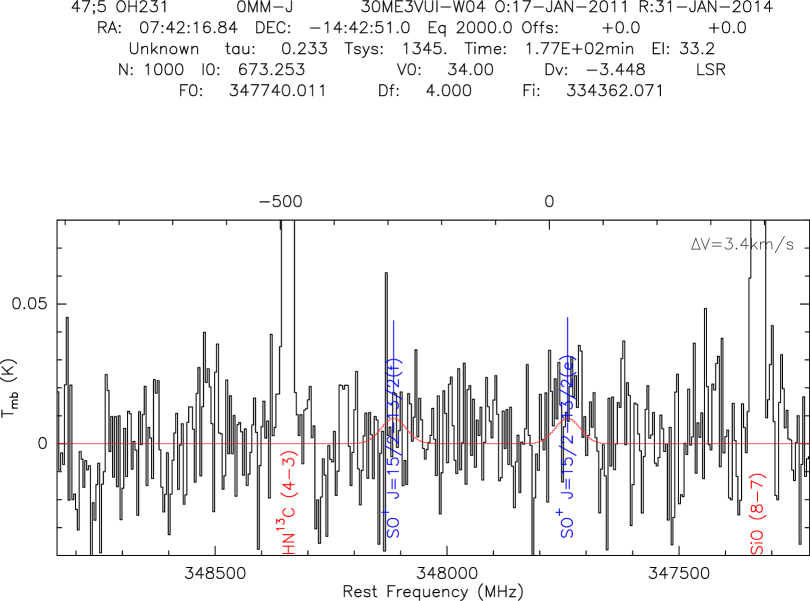
| Rest Freq. | Transition | Eu | Aul | |
|---|---|---|---|---|
| (MHz) | QNs | (K) | (s-1) | (K km s-1) |
| 13CO = 0.11 Debyes | ||||
| 110201.4 | 1 - 0 | 5.3 | 6.336E-08 | 13.45 (0.06) |
| 220398.7 | 2 - 1 | 15.9 | 6.082E-07 | 51.50 (0.13) |
| 330588.0 | 3 - 2 | 31.7 | 2.199E-06 | 42.00 (0.30) |
| 550926.3 | 5 - 4 | 79.3 | 1.079E-05 | 3.33 (0.07) |
| 661067.3 | 6 - 5 | 111.1 | 1.894E-05 | 3.03 (0.09) |
| 771184.1 | 7 - 6 | 148.1 | 3.040E-05 | 2.30 (0.13) |
| 881272.8 | 8 - 7 | 190.4 | 4.574E-05 | 2.00 (0.15) |
| 991329.3 | 9 - 8 | 237.9 | 6.554E-05 | 0.65 (0.15) |
| 1101349.6 | 10 - 9 | 290.8 | 9.034E-05 | 0.70 (0.15) |