2Indian Institute of Astrophysics, Koramangala II Block, Bangalore 560034, India
Far-infrared study of K giants in the solar neighborhood:
Connection between Li enrichment and mass-loss
Abstract
A small group of red giant branch (RGB) stars are known to have anomalous Li enhancement whose origin is still not well understood. Some studies have proposed that the Li enhancement in RGB stars is correlated to their far-IR excess, a result of mass loss. Studies to confirm such a correlation have a significant bearing on our understanding of the Galactic Li enhancement. We searched for a correlation between the two anomalous properties of K giants: Li enhancement and IR excess from an unbiased survey of a large sample of RGB stars. A sample of 2000 low-mass K giants with accurate astrometry from the Hipparcos catalog was chosen for which Li abundances have been determined from low-resolution spectra. Far-infrared data were collected from the and catalogs. To probe the correlation between the two anomalies, we supplemented 15 Li-rich K giants discovered from this sample with 25 known Li-rich K giants from other studies. Dust shell evolutionary models and spectral energy distributions were constructed using the code DUSTY to estimate different dust shell properties, such as dust evolutionary time scales, dust temperatures, and mass-loss rates. Among 2000 K giants, we found about two dozen K giants with detectable far-IR excess, and surprisingly, none of them are Li-rich. Similarly, the 15 new Li-rich K giants that were identified from the same sample show no evidence of IR excess. Of the total 40 Li-rich K giants, only 7 show IR excess. Important is that K giants with Li enhancement and/or IR excess begin to appear only at the bump on the RGB. Results show that K giants with IR excess are very rare, similar to K giants with Li enhancement. This may be due to the rapid differential evolution of dust shell and Li depletion compared to RGB evolutionary time scales. We also infer from the results that during the bump evolution, giants probably undergo some internal changes, which are perhaps the cause of mass-loss and Li-enhancement events. However, the available observational results do not ascertain that these properties are correlated. That a few Li-rich giants have IR excess seems to be pure coincidence.
Key Words.:
Infrared: Stars - Stars : late-type - Stars : circumstellar matter - Stars : massloss - Stars : abundances - Stars: evolution1 Introduction
Standard stellar evolutionary models predict severe depletion of Li in red giant branch (RGB) stars owing to convection (Iben 1967a, b). Contrary to expectations, some RGB stars are found to have enhanced Li in their photosphere. Since the discovery of unexpectedly large Li in HD 112127 in 1982 (Wallerstein & Sneden 1982), a number of Li-rich K giants ( dex) have been found (Hanni 1984; Gratton & D’Antona 1989). However, systematic surveys among RGB stars have shown that the Li-rich K giants are rare, just 1-2 in the Galaxy (Brown et al. 1989; Gonzalez et al. 2009; Kumar et al. 2011; Lebzelter et al. 2012; Monaco et al. 2011; Ruchti et al. 2011) and nearby dwarf spheroidal galaxies (Kirby et al. 2012).
It is important to know whether the Li-rich K giants contribute to the Galactic Li enrichment. Enhancement of the Li abundance from its primordial value, A(Li) 2.27 - 2.72 dex (Lind et al. 2009; Cyburt et al. 2008), to its present level, A(Li) 3.3 dex (Matteucci 2010), in the Galaxy is clear evidence of Li production in the post-big bang nucleosynthesis. Some of the known sources of Li enhancement in the universe are cosmic ray spallation, supernovae, novae, asymptotic giant branch (AGB) stars (Matteucci 2010 and references therein).
Evidence of the RGB contribution to the Galactic Li enhancement comes in the form of a proposed correlation between Li enhancement and far-infrared excess in RGB stars (Gregorio-Hetem et al. 1993; de La Reza et al. 1996, 1997; de la Reza & Drake 2012). However, these studies were based on a small number of Li-rich K giants. Most important is that many of the Li-rich K giants discovered in their studies came from the Pico Dias Survey (or PDS), which was meant for finding T Tauri stars based on far-IR colors that prompted more surveys to look for Li-rich K giants among sources (de La Reza et al. 1997; Castilho et al. 1998; Fekel & Watson 1998; Jasniewicz et al. 1999). Obviously, the number of Li-rich K giants with IR excess among K giants has increased (de La Reza et al. 1997; Reddy et al. 2002; Reddy & Lambert 2005).
Like Li-enhancement, IR excess is also unexpected in RGB stars (Zuckerman et al. 1995; Plets et al. 1997). Based on dust shell evolutionary models, de La Reza et al. (1996) suggested that IR excess and a large amount of Li in RGB stars were transient phenomena that would last for a few tens of thousand years. Palacios et al. (2001) provides a mechanism where rotation-induced mixing could cause both the Li-enhancement, as well as mass loss during their evolution of the RGB luminosity bump. Another interesting study was done by Denissenkov & Herwig (2004) and Carlberg et al. (2010), who suggest that Li enrichment could be due to enhanced extra mixing triggered by external events, such as the plunging of massive planets or by a brown dwarf. According to them, IR excess could be due to a dusty disk orbit around the Li-rich giant (see also, Jura 2003), which might have formed either due to the engulfment of planets or the evaporation of planetesimals (Plets et al. 1997; Jasniewicz et al. 1999). This would mean Li-rich K giants with IR excess could be anywhere on the RGB and not necessarily at the luminosity bump (see Charbonnel & Balachandran 2000; Kumar et al. 2011).
In this paper, we have revisited the problem in light of the increased number of Li-rich K giants that are twice that of the samples involved in the previous studies and the availability of better astrometry and infrared data for a large sample of RGB stars. According to our knowledge this is the first uniform study involving a large sample of 2000 low-mass K giants to search for evidence of a connection between the two anomalous properties: Li-enhancement and IR excess.
2 Sample selection and data
Our sample contains 2000 low-mass (0.8 - 3.0M☉) K giants in the solar neighborhood ( 200 pc), with accurate astrometry (parallaxes and proper motions) taken from the Hipparcos Catalog (van Leeuwen 2007). This is the same sample as was used by Kumar et al. (2011) for their search for Li-rich K giants. The sample covers the RGB evolution from its base to well above the RGB bump, spanning the luminosity range from log(L/L☉) 1.0 to 2.5. In the survey they found 15 new Li-rich K giants (Kumar et al. 2011), 14 of which belong to the thin disk, and one belongs to the thick disk. In addition to 15 new Li-rich K giants, another 25 were included from the literature following the criterion suggested by Charbonnel & Balachandran (2000). The Li abundance data for the entire Li-rich sample was taken from Kumar et al. (2011), Liu et al. (2014), Adamow et al. (2014), and references therein. Of the 25 Li-rich K giants taken from the literature 22 belong to the thin disk component, one to the thick disk component and one to the halo. The status is unknown for the remaining star because kinematic velocities are not available. Li-rich K giants in the sample have solar metallicity within dex.
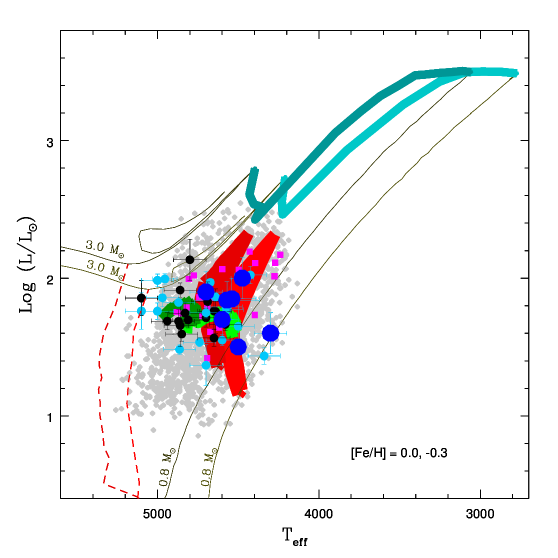
Owing to the unavailability of astrometry and, in some cases, of infrared data, Li-rich K giants from the recent surveys of different populations are not included: Galactic thick disk (Monaco et al. 2011), halo (Ruchti et al. 2011), bulge (Gonzalez et al. 2009; Lebzelter et al. 2012), and dwarf Spheroidal galaxies (Kirby et al. 2012). We did not include Li-rich giants from other studies (Martell & Shetrone 2013; Monaco et al. 2014; Silva Aguirre et al. 2014) for the same reason. The entire survey sample, along with 40 Li-rich K giants, is shown in the Hertzsprung-Russell (HR) diagram (Figure 1). The sample is superposed on the evolutionary tracks (Bertelli et al. 2008) of masses from 0.8 to 3.0M☉ with solar metallicity of [Fe/H] = 0.0. Also, shown in Figure 1 are the base of the RGB (dashed red line) and the region of red clump (black lines) and the luminosity bump (red lines) on each of the mass tracks. Li-rich K giants are shown with symbol size indicating amount of Li abundance.
Infrared data of the entire sample including Li-rich K giants come from the catalogs of the Wide-field Infrared Survey Explorer () (Cutri & et al. 2012, 2013; Wright et al. 2010) and the Infrared Astronomical Satellite() (Helou & Walker 1988; Kleinmann et al. 1986; Moshir & et al. 1990). The catalog contains flux densities at four different bands with central wavelengths of 12m, 25m, 60m, and 100m. The 100m flux densities are upper limits for most of the sample stars. For our study, we used only the first three bands. We divided our sample into three groups: good, moderate, and not good. The group with measured flux densities in all three bands are considered as good, the group with measured flux densities in only two bands are considered as moderate, and the group with measured flux densities only in one band is considered as not good. Of 2000 giants in the sample, we have good data only for 114 stars and moderate data for 1144 stars. We have used only good and moderate data in the analysis.
The data is supplemented by infrared flux densities. has four IR bands known as W1, W2, W3, and W4 with central wavelengths at 3.3, 4.6, 11.6, and 22.1, respectively. We used flux densities measured at the W2, W3, and W4 bands. Of 2000 sample stars, 1880 have measured flux densities in all three bands, and all the sample stars have measured flux densities in W3 and W4. All the 40 Li-rich K giants have measured flux densities in W3 and W4 bands, but one star has upper limit flux density in the W2 band. We did not include stars with WISE upper-limit data, which is a very small number any way. Unfortunately, far-IR (65) data (Yamamura et al. 2010) is only available for three stars in our sample. We do not comment any further on this data.
3 Far-IR color-color diagram
Far-IR (FIR) flux excess indicates the presence of circumstellar dust, which can be traced using the FIR color-color diagram (FIR-CCDm). The FIR colors between the two bands with central wavelengths and were calculated using the following equation:
| (1) |
where and are the flux densities.
3.1 Survey sample
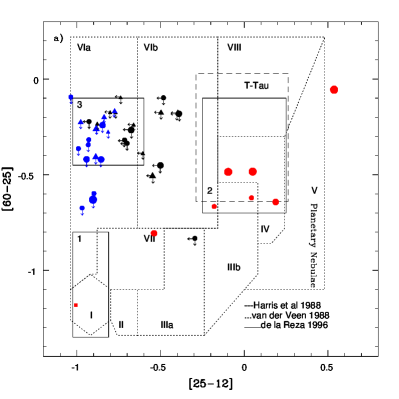
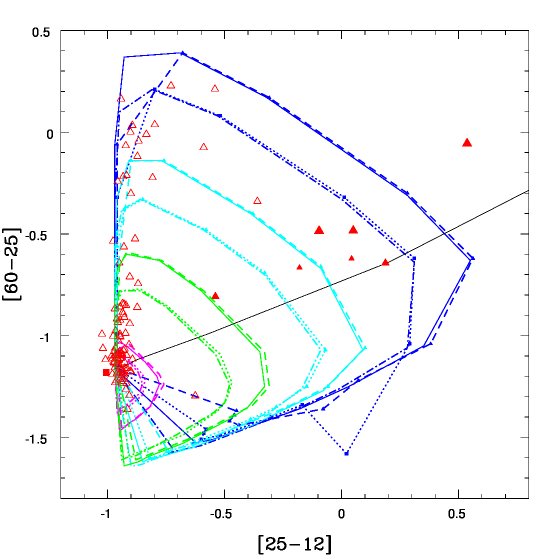
colors of the sample stars of good and moderate groups are shown in Figure 2a, along with Li-rich K giants. Following the study of data of stars with dust envelopes by van der Veen & Habing (1988), we partitioned the CCDm into different boxes and labeled them accordingly. The Vanderveen diagram is found to be useful tool for interpreting the evolution of dust around the star. For example, Region I represents stars with no dust, and Regions II, IIIa, IIIb, IV, VIb, and VIa represent stars with dust going progressively from warm to cool. Photospheric far-IR colors of RGB stars with no IR excess are represented by Region (see Figure 2a). As shown in Figure 2a, most of the stars are in Region and VIa, and a very few are in other regions. Of the stars with good data, the majority are in Region with no excess of dust. A few are in Regions VIa and VIb. However, the vast majority of stars with moderate data are in Region VIa. This could be due to 60m flux density, which is an upper limit. We assume that all of these stars belong to Region with no excess of dust. We note that only a small fraction of stars with good data show detectable far-IR excess, which confirms the earlier estimation of far-IR excess among the giants of luminosity class III (see Zuckerman et al. 1995 & Plets et al. 1997).
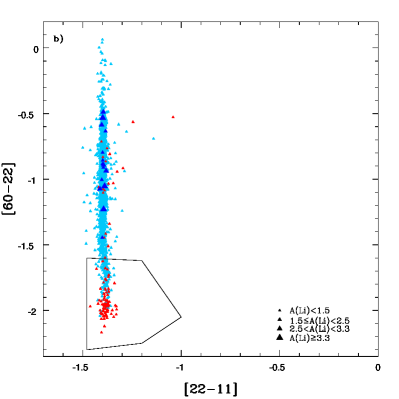
A similar diagram is shown in Figure 2b for two measurements at 11.6 (W3) and 22.1 (W4) and 60 flux density. We have measured flux densities of [22-11] for 1880 sample stars, including all the 15 Li-rich K giants from the sample against measured flux densities of [25-12] for 1144 sample stars. colors [22-11] show much less scatter and show excess for very few stars. Also, none of the 15 Li-rich K giants show excess in [22-11] and fall in the same region as normal K giants, confirming the data based on a relatively small number of measured flux densities.
3.2 Li-rich K giants
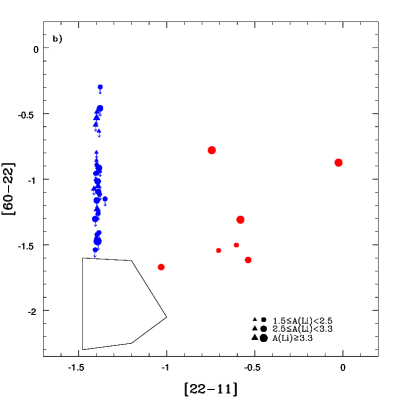
We have a total of 40 Li-rich K giants, 15 of which come from our survey (Kumar et al. 2011), and the rest are from the literature. All of them are shown in Figure 3a of CCD. Arcturus, a typical K giant with very low Li (A(Li)-0.6) and no infrared excess, is shown as a reference. The data and colours of 40 Li-rich K giants are given in Table 1. Of 40 Li-rich K giants, 7 have “good data”, 18 have “moderate data”, and another 15 have “not good data”. Unfortunately, none of the 15 Li-rich K giants found from our survey of 2000 K giants belong to the good data group. However, six of them have measured flux densities in 12 and 25 and fall in the region VIa. From Figure 3a, we note only 7 Li-rich K giants showing IR excess in both 25 and 60 bands, suggesting clear evidence of a dust envelope and of the recent mass loss. For 18 stars with moderate data, flux densities of 12 and 25 bands are normal and show no evidence of excess flux. However, [60-25] color indicates cool dust (region VIa), but this may be entirely due to the upper limit in 60 flux. These candidates most likely show black-body [25-12] color of their photospheres, and at 60 the photospheric flux densities are too faint to be detected. The third group (black symbols) have only upper limit flux densities both in 25 and 60 and would be difficult to say whether they have or do not have IR excess.
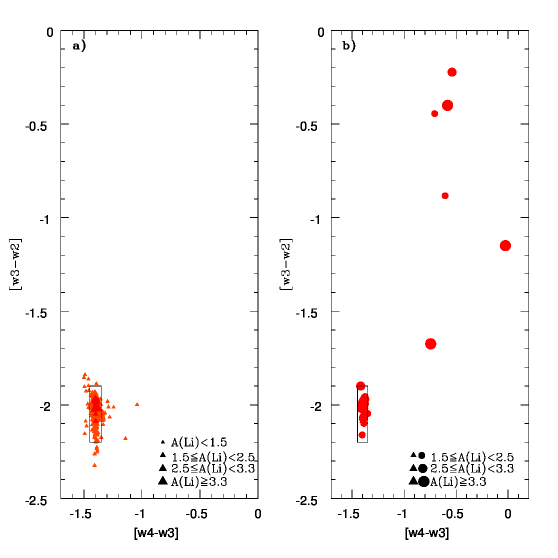
However, measured flux densities at 22.1 & 11.6 are available for all 40 Li-rich K giants. The good quality of 60 flux densities are available for only seven Li-rich K giants, and the rest are with upper limits. In Figure 3b, we showed all the 40 Li-rich K giants in the plot of [22-11] and [60-22] color. It is clear from the figure that stars that have measured flux densities in all three bands are the same seven Li-rich K giants that show IR excess indicating some kind of warm dust. The position of black symbols in Figure 3a moved to the left in Figure 3b, showing no IR excess in [22-11] color. Since 60 flux densities are upper limits, we assume that all the Li-rich K giants represented in blue are similar to normal K giants with expected photospheric fluxes. Also, in Figure 4 we showed colors for the entire sample (1880) and 39 Li-rich K giants excluding stars with upper limits. This too confirms the above findings.
4 Modeling of circumstellar envelope: DUSTY
We used a 1-D radiative transfer code, DUSTY (Ivezic et al. 1999), to model the observed spectral energy distribution (SED) and to reconstruct the color-color diagram with dust evolutionary models. DUSTY solves radiative transport through a dusty region in the circumstellar environment. The solution is obtained through an integral equation for the spectral energy density. DUSTY can handle the geometry of the regions that are plane parallel or spherical density distribution heated by a central source. It has built-in optical constants for most of the astronomical dust grains.
4.1 Spectral energy distribution (SED)
Modeling of SED, constructed from far-UV to the sub-mm data of dust shells around cool giants, is one of the important diagnostic tools for understanding the nature of the dust. To construct the SED, we took optical (BVRI) (Monet et al. 2003), near-infrared (JHKs) magnitudes (Skrutskie et al. 2006), and far-infrared (, ) flux densities (Helou & Walker 1988) from the respective catalogs and SIMBAD. Mid-infrared fluxes observed by MSX (Egan et al. 2003) were taken wherever applicable. Magnitudes are converted to fluxes (see Bessell et al. 1998; Cohen et al. 2003). The model SED is fitted to the observed SED by scaling the K band model flux to the observed value. In the modeling of dust envelope we used only measured fluxes, not the fluxes with upper limits.
DUSTY computes SEDs for a given set of input parameters: dust temperature at the inner shell (Td), optical depth () at 0.55, the relative shell thickness (Rout-Rin)/Rin, and the input SED of the central star. The central star was taken as a point source with a spherically distributed dust. To compute the SED for a central star, we have used appropriate model atmospheres from a Kurucz grid of model atmospheres (Kurucz 1994). Atmospheric parameters (Teff, log , and [Fe/H]) were taken from Kumar et al. (2011). The dust shell was assumed to have astronomical silicate grains because most of the RGB stars are oxygen-rich (C/O 1.0). The dust temperature at the inner shell, optical depth, and relative shell thickness were found by an iterative method until the theoretical SED matched the observed SED well. We found that the excess emission was reproduced well with the warm silicate dust grains (Ossenkopf et al. 1992). Derived dust temperatures (Td) along with the atmospheric parameters for Li-rich giants with good data are given in Table 2.
4.2 Mass-loss rates and envelope kinematic age
Dust parameters derived from modeling SEDs are used to derive mass-loss rates and kinematic age. Assuming a constant velocity (Vs) of 2 km s-1 for the wind, the rate of mass loss and kinematic age () of the dust shell are estimated following de La Reza et al. (1996):
| (2) |
where is the optical depth at visible band, R is inner dust shell radius. The derived values for the seven Li-rich K giants with good data are given in Table 2.
Furthermore, we predicted mass loss rates of RGB stars at different phases in their evolution. In Table 3, we have provided expected mass-loss rates. The mass-loss rates are computed using the modified version of the Reimer’s law (Schröder & Cuntz 2005) ():
| (3) |
where = 8110-14 M☉ yr-1; L⋆, R⋆, M⋆, are luminosity, radius, mass, and surface gravity of a given star, respectively. For solar gravity, log = 4.44 has been adopted. Radii for the stars are calculated from their luminosities and temperatures. Stellar gravities (log g⋆) have been derived using the following standard equation:
4.3 Circumstellar dust shell evolutionary model
In Figure 5, DUSTY-computed far-IR colors are shown for a set of stellar parameters covering RGB evolution. For computation, we assumed that the dust shell is spherically symmetric, thin, and detached from the central star and that it is a uniform mixture of dust and gas. We also assumed that the newly formed dust shell is a result of uniform mass loss, hot with Td = 1500 K (sublimation temperature of silicates) and cooling down to = 15 K ( dust temperature of diffuse interstellar medium) before it dissipates into the interstellar medium. In computing the dust shell evolution, we considered four different mass-loss rates: 110-10, 110-9, 510-9, and 310-8.
5 Discussion
From the survey, we found only 114 K giants with measured flux densities in all three (12, 25, & 60) bands. Of these only 23 show evidence of far-IR excess due to cold dust (regions V1a, VIb), and the rest have no excess of dust (region ) (see Figure 2a). Interestingly, none of these K giants with far-IR excess are Li-rich. Similarly, only 15 out of the 2000 K giants are Li-rich (see Kumar et al. 2011), and none of them show evidence of far-IR excess. For many stars in the sample, only upper limits are available for both 12 and 25 . To improve the situation we supplemented data with data that has measured flux densities for almost all the stars in 11.6 and 22.1. The combined and data results suggest that the far-IR excess among K giants is uncommon, which confirms earlier results by Zuckerman et al. (1995) and Plets et al. (1997). This may be due to the fast depletion of enhanced Li and dust dissipation in an uncorrelated way. Important is that the unbiased survey results do not confirm earlier suggestions (de La Reza et al. 1996, 1997) of a correlation between the two anomalous properties of K giants: Li-enhancement and far-IR excess.
To gain more insight, we included 25 Li-rich K giants from the literature. These are shown in Figure 3a along with 15 (black & blue triangles) Li-rich K giants from the present survey. Of 40, only 7 have measured flux densities in all the three (12, 25, and 60) bands, and show evidence of warm dust. Among seven super Li-rich K giants (log Li 3.3) in the sample only three show IR excess and all the three have been selected based on IR colours. Important is that four other super Li-rich K giants show no evidence of IR excess, certainly no warm dust around giants with such high Li (Figure 3b). This observational result contradicts the hypothesis (de La Reza et al. 1996, 1997) that the evolution of Li abundance and IR excess are correlated wherein the larger the Li abundance in K giants, the hotter the circumstellar dust, the less the Li abundance, and the cooler the circumstellar dust. The large Li abundance in K giants implies recent enhancement of Li accompanied by a mass-loss event (hence the warm dust), suggesting that not much time has elapsed since the events that caused Li enhancement and dust shell ejection.
Results from dust models, shown in Figure 5 and Table 4, suggest that the dust evolutionary time scales are quite small at a few thousand to a few hundred thousand years for typical K giants with the least mass loss rates (1 ) to heavy mass loss rates (5 ), respectively. Also, Li-depletion timescales, according to Li Flash model (Palacios et al. 2001), are on the order of 104 ( 20000) yrs. These time scales are much smaller than stellar evolutionary time scales (Bertelli et al. 2008) and, important, smaller than the evolutionary timescales of different phases along the RGB (see Table 5). K giants spend a few million years () at the bump and take about 10-100 million years to evolve from the bump to the clump via the tip of the RGB. The above arguments suggest that the ejected dust shell due to mass loss and the enriched Li may not even survive the bump evolution. It is still an open question whether it is just a coincidence that seven Li-rich K giants have been found to have far-IR excess (Figure 3a,3b) or that these two properties are somehow related but not observed owing to their fast but different evolutionary scales. To understand the later question, we plotted the entire sample along with the 40 Li-rich K giants in the HR diagram ( Figure 6). Results shown in Figure 6 complicate the situation further. From close examination of the displayed data, one could make a few interesting observations: a) there seem to be two groups of Li-rich K giants: one at the luminosity bump and another at the clump, b) the Li-rich K giants that overlap with the clump region (just below the bump and to the left) do not show far-IR excess, c) some of the Li-rich K giants in the bump region show far-IR excess due to warm dust, d) we note that the K giants with far-IR excess and/or Li-enhancement occur in the narrow luminosity range (log(L/L☉) = 1.4 - 2.2).
The absence of Li-rich K giants below the bump suggests that Li production begins during the bump evolution. Interestingly, the K giants with far-IR excess also begin to appear at or within the bump region. In fact, all seven Li-rich K giants with far-IR excess are in the bump region (Figure 6). However, within the same region, there are also Li-rich giants without far-IR excess and far-IR excess K giants without Li enhancement. Thus, one ought to be cautious about associating Li-enhancement in K giants with the mass-loss events or vice versa. Also, assuming the possibility that planet engulfment enriches host-star Li abundance, hence IR excess ( See Denissenkov & Herwig 2004; Carlberg et al. 2010; Adamow et al. 2014), and that the engulfment may happen anywhere along the RGB, one would expect Li enhancement across the RGB but not necessarily at the narrow bump luminosity. Absence of K giants with Li enhancement below and above the bump region casts shadow on the external origin scenario.
The presence of Li-rich and also super Li-rich K giants without far-IR excess (blue triangles in Figure 3a, box 3) at the clump (see green shade in Figure 6) requires an alternative site for Li enhancement, other than the bump. It is very unlikely that the Li produced at the bump remains at its peak value. As giants evolve to the clump via the tip of the RGB they experience deep convection. The extent of mixing is evidenced by their very low values of 12C/13C ratios (see Kumar & Reddy 2009; Kumar et al. 2011). Thus, in Kumar et al. (2011) study core-He flash at the tip of the RGB has been suggested as the most likely alternative event that could cause Li enhancement that might or might not have been associated with the mass loss. Since the evolution from the tip of the RGB to the clump is rapid, Li produced at the tip is expected to survive. However, in a recent study by Denissenkov (2012), an alternative scenario was proposed in which, as a result of extra-mixing, giants originated in the bump could make extended zigzags that may reach luminosities below the bump luminosity explaining a group of Li-rich K giants that appear to overlap with the red clump in the HR diagram (Figure 6).
6 Conclusion
We performed a search for a correlation between Li-enhancement and far-IR excess among a uniform sample of 2000 K giants. Infrared data for the sample is taken from the and catalogs. Results suggest that IR excess similar to Li enhancement among the K giants is uncommon. Results from the survey show no direct evidence of correlation between the two anomalous properties of K giants. None of the 15 Li-rich K giants show IR excess, and none of the K giants that have measurable IR excess show Li enhancement.
Furthermore, Li-rich K giants from the survey are supplemented by 25 known Li-rich K giants from different studies. Absence of Li-rich and/or IR excess K giants below the bump stresses the fact that K giants undergo some key internal changes during the short span of bump evolution leading to mass loss and Li enhancement. Though the evidence for the two events occurring during the bump are clear from our study, what is not clear is whether one phenomenon triggers another, leading to a correlation, or whether the two events are independent. Results from our observations and from the compilation of Li-rich K giants favor the later suggestion. The presence of both IR excess and Li enhancement in a few K giants seems to be a coincidence.
To get a better perspective on the problem, it is important to search for Li enhancement among red clump stars and RGB bump stars separately. Also, several studies (Gonzalez et al. 2009; Monaco et al. 2011; Lebzelter et al. 2012; Ruchti et al. 2011; Martell & Shetrone 2013; Adamow et al. 2014) report that some giants with large Li enhancement are occupied between the bump and tip of the RGB. It would be a worthwhile exercise to differentiate RGB stars from the early asymptotic giant branch (AGB) stars. It is well known that many AGB stars produce Li through the Cameron-Fowler mechanism (Cameron & Fowler 1971) in their interiors and gets dredged up to the surface (see Sackmann & Boothroyd 1992).
Acknowledgements.
We sincerely thank the referee who made constructive suggestions of using data, which made our interpretations more robust. This study is sponsored by the Chinese Academy of Sciences Visiting Fellowship for Researchers from Developing Countries, Grant No. 2013FFJB0008, and partially supported by the National Natural Science Foundation of China under grants Nos. 11450110404, 11390371, and 11233004. Y.B.K is thankful to T. Medupe for his kind support through NRF grant at NWU. This research made use of the Simbad database and the NASA ADS service.References
- Adamow et al. (2014) Adamow, M., Niedzielski, A., Villaver, E., Wolszczan, A., & Nowak, G. 2014, ArXiv e-prints
- Balachandran et al. (2000) Balachandran, S. C., Fekel, F. C., Henry, G. W., & Uitenbroek, H. 2000, ApJ, 542, 978
- Bertelli et al. (2008) Bertelli, G., Girardi, L., Marigo, P., & Nasi, E. 2008, A&A, 484, 815
- Bessell et al. (1998) Bessell, M. S., Castelli, F., & Plez, B. 1998, A&A, 333, 231
- Brown et al. (1989) Brown, J. A., Sneden, C., Lambert, D. L., & Dutchover, E. J. 1989, ApJS, 71, 293
- Cameron & Fowler (1971) Cameron, A. G. W. & Fowler, W. A. 1971, ApJ, 164, 111
- Carlberg et al. (2010) Carlberg, J. K., Smith, V. V., Cunha, K., Majewski, S. R., & Rood, R. T. 2010, ApJ, 723, L103
- Castilho et al. (1998) Castilho, B. V., Gregorio-Hetem, J., Spite, F., Spite, M., & Barbuy, B. 1998, A&AS, 127, 139
- Charbonnel & Balachandran (2000) Charbonnel, C. & Balachandran, S. C. 2000, A&A, 359, 563
- Cohen et al. (2003) Cohen, M., Wheaton, W. A., & Megeath, S. T. 2003, AJ, 126, 1090
- Cutri & et al. (2012) Cutri, R. M. & et al. 2012, VizieR Online Data Catalog, 2311, 0
- Cutri & et al. (2013) Cutri, R. M. & et al. 2013, VizieR Online Data Catalog, 2328, 0
- Cyburt et al. (2008) Cyburt, R. H., Fields, B. D., & Olive, K. A. 2008, J. Cosmology Astropart. Phys., 11, 12
- de la Reza & Drake (2012) de la Reza, R. & Drake, N. A. 2012, in Astronomical Society of the Pacific Conference Series, Vol. 464, Circumstellar Dynamics at High Resolution, ed. A. C. Carciofi & T. Rivinius, 51
- de La Reza et al. (1996) de La Reza, R., Drake, N. A., & da Silva, L. 1996, ApJ, 456, L115+
- de La Reza et al. (1997) de La Reza, R., Drake, N. A., da Silva, L., Torres, C. A. O., & Martin, E. L. 1997, ApJ, 482, L77+
- Denissenkov (2012) Denissenkov, P. A. 2012, ApJ, 753, L3
- Denissenkov & Herwig (2004) Denissenkov, P. A. & Herwig, F. 2004, ApJ, 612, 1081
- Drake et al. (2002) Drake, N. A., de la Reza, R., da Silva, L., & Lambert, D. L. 2002, AJ, 123, 2703
- Egan et al. (2003) Egan, M. P., Price, S. D., Kraemer, K. E., et al. 2003, VizieR Online Data Catalog, 5114, 0
- Fekel & Watson (1998) Fekel, F. C. & Watson, L. C. 1998, AJ, 116, 2466
- Gonzalez et al. (2009) Gonzalez, O. A., Zoccali, M., Monaco, L., et al. 2009, A&A, 508, 289
- Gratton & D’Antona (1989) Gratton, R. G. & D’Antona, F. 1989, A&A, 215, 66
- Gregorio-Hetem et al. (1993) Gregorio-Hetem, J., Castilho, B. V., & Barbuy, B. 1993, A&A, 268, L25+
- Hanni (1984) Hanni, L. 1984, Soviet Astronomy Letters, 10, 51
- Harris et al. (1988) Harris, M. J., Lambert, D. L., & Smith, V. V. 1988, ApJ, 325, 768
- Helou & Walker (1988) Helou, G. & Walker, D. W., eds. 1988, Infrared astronomical satellite (IRAS) catalogs and atlases. Volume 7: The small scale structure catalog, Vol. 7
- Iben (1967a) Iben, I. J. 1967a, ApJ, 147, 650
- Iben (1967b) Iben, I. J. 1967b, ApJ, 147, 624
- Ivezic et al. (1999) Ivezic, Z., Nenkova, M., & Elitzur, M. 1999, ArXiv Astrophysics e-prints
- Jasniewicz et al. (1999) Jasniewicz, G., Parthasarathy, M., de Laverny, P., & Thévenin, F. 1999, A&A, 342, 831
- Jura (2003) Jura, M. 2003, ApJ, 582, 1032
- Kirby et al. (2012) Kirby, E. N., Fu, X., Guhathakurta, P., & Deng, L. 2012, ApJ, 752, L16
- Kleinmann et al. (1986) Kleinmann, S. G., Cutri, R. M., Young, E. T., Low, F. J., & Gillett, F. C. 1986, in Tucson, Univ. of Arizona (1986), 0
- Kumar & Reddy (2009) Kumar, Y. B. & Reddy, B. E. 2009, ApJ, 703, L46
- Kumar et al. (2011) Kumar, Y. B., Reddy, B. E., & Lambert, D. L. 2011, ApJ, 730, L12
- Kurucz (1994) Kurucz, R. L. 1994
- Lebzelter et al. (2012) Lebzelter, T., Uttenthaler, S., Busso, M., Schultheis, M., & Aringer, B. 2012, A&A, 538, A36
- Lind et al. (2009) Lind, K., Asplund, M., & Barklem, P. S. 2009, A&A, 503, 541
- Liu et al. (2014) Liu, Y. J., Tan, K. F., Wang, L., et al. 2014, ApJ, 785, 94
- Luck & Heiter (2007) Luck, R. E. & Heiter, U. 2007, AJ, 133, 2464
- Martell & Shetrone (2013) Martell, S. L. & Shetrone, M. D. 2013, MNRAS, 430, 611
- Matteucci (2010) Matteucci, F. 2010, in IAU Symposium, Vol. 268, IAU Symposium, ed. C. Charbonnel, M. Tosi, F. Primas, & C. Chiappini, 453–461
- Mishenina et al. (2006) Mishenina, T. V., Bienaymé, O., Gorbaneva, T. I., et al. 2006, A&A, 456, 1109
- Monaco et al. (2014) Monaco, L., Boffin, H. M. J., Bonifacio, P., et al. 2014, A&A, 564, L6
- Monaco et al. (2011) Monaco, L., Villanova, S., Moni Bidin, C., et al. 2011, A&A, 529, A90
- Monet et al. (2003) Monet, D. G., Levine, S. E., Canzian, B., et al. 2003, AJ, 125, 984
- Moshir & et al. (1990) Moshir, M. & et al. 1990, in IRAS Faint Source Catalogue, version 2.0 (1990), 0
- Ossenkopf et al. (1992) Ossenkopf, V., Henning, T., & Mathis, J. S. 1992, A&A, 261, 567
- Palacios et al. (2001) Palacios, A., Charbonnel, C., & Forestini, M. 2001, A&A, 375, L9
- Plets et al. (1997) Plets, H., Waelkens, C., Oudmaijer, R. D., & Waters, L. B. F. M. 1997, A&A, 323, 513
- Reddy & Lambert (2005) Reddy, B. E. & Lambert, D. L. 2005, AJ, 129, 2831
- Reddy et al. (2002) Reddy, B. E., Lambert, D. L., Hrivnak, B. J., & Bakker, E. J. 2002, AJ, 123, 1993
- Ruchti et al. (2011) Ruchti, G. R., Fulbright, J. P., Wyse, R. F. G., et al. 2011, ApJ, 743, 107
- Sackmann & Boothroyd (1992) Sackmann, I.-J. & Boothroyd, A. I. 1992, ApJ, 392, L71
- Schröder & Cuntz (2005) Schröder, K. & Cuntz, M. 2005, ApJ, 630, L73
- Silva Aguirre et al. (2014) Silva Aguirre, V., Ruchti, G. R., Hekker, S., et al. 2014, ApJ, 784, L16
- Skrutskie et al. (2006) Skrutskie, M. F., Cutri, R. M., Stiening, R., et al. 2006, AJ, 131, 1163
- Strassmeier et al. (2000) Strassmeier, K., Washuettl, A., Granzer, T., Scheck, M., & Weber, M. 2000, A&AS, 142, 275
- van der Veen & Habing (1988) van der Veen, W. E. C. J. & Habing, H. J. 1988, A&A, 194, 125
- van Leeuwen (2007) van Leeuwen, F., ed. 2007, Astrophysics and Space Science Library, Vol. 350, Hipparcos, the New Reduction of the Raw Data
- Wallerstein & Sneden (1982) Wallerstein, G. & Sneden, C. 1982, ApJ, 255, 577
- Wright et al. (2010) Wright, E. L., Eisenhardt, P. R. M., Mainzer, A. K., et al. 2010, AJ, 140, 1868
- Yamamura et al. (2010) Yamamura, I., Makiuti, S., Ikeda, N., et al. 2010, VizieR Online Data Catalog, 2298, 0
- Zuckerman et al. (1995) Zuckerman, B., Kim, S. S., & Liu, T. 1995, ApJ, 446, L79+
| Star | [Fe/H] | Teff | log | Log(L/L☉) | R/R☉ | Ṁ | Tdust | t | |
|---|---|---|---|---|---|---|---|---|---|
| (K) | (M☉yr-1) | (K) | (yr) | ||||||
| HD 233517 | 0.37 | 4475 | 2.25 | 2.00 | 16.6655 | 1.88577E-07 | 75 | 1262.99 | |
| HD 219025 | 0.10 | 4570 | 2.30 | 1.88 | 13.9179 | 6.02185E-09 | 275 | 40.3312 | |
| HD 19745 | 0.05 | 4700 | 2.25 | 1.90 | 13.4651 | 3.50690E-09 | 170 | 117.437 | |
| 13539-4153 | 0.13 | 2.25 | 4300 | 1.60 | 11.3885 | 3.27951E-08 | 230 | 47.0666 | |
| 17596-3952 | 0.10 | 2.50 | 4600 | 1.70 | 11.1658 | 2.37905E-08 | 190 | 85.3588 | |
| 13313-5838 | 0.09 | 2.20 | 4540 | 1.85 | 13.6236 | 1.29749E-07 | 260 | 46.553 | |
| PDS 100 | 0.14 | 4500 | 2.50 | 1.70 | 11.6676 | 1.48663E-08 | 250 | 29.87 |
| Bin | Teff | log(L/L☉) | M⋆ | R⋆ | log | ṀR | |
| (K) | (M☉) | (R☉) | (M☉yr-1) | ||||
| Prebump | 4650 | 0.9 | 1.0 | 4.3501 | 3.163 | 4.83757E-12 | |
| 4650 | 1.5 | 1.6 | 8.67958 | 2.76712 | 2.40163E-11 | ||
| 5200 | 1.0 | 1.9 | 3.903 | 3.53596 | 2.87589E-12 | ||
| 5200 | 1.5 | 2.5 | 6.94062 | 3.15514 | 1.2291E-11 | ||
| 4800 | 1.3 | 1.8 | 6.47027 | 3.07343 | 1.0041E-11 | ||
| Bump | 4500 | 1.0 | 0.8 | 5.2117 | 2.90913 | 9.12048E-12 | |
| 4500 | 1.6 | 1.2 | 10.3987 | 2.48522 | 4.82977E-11 | ||
| 4650 | 1.0 | 1.0 | 4.88089 | 3.063 | 6.83324E-12 | ||
| 4650 | 2.0 | 2.5 | 15.4347 | 2.46094 | 8.64344E-11 | ||
| 4200 | 2.0 | 0.8 | 18.9193 | 1.78928 | 3.31089E-10 | ||
| 4600 | 1.75 | 1.8 | 11.8274 | 2.54949 | 5.17303E-11 | ||
| Clump | 4650 | 1.5 | 1.4 | 8.67958 | 2.70913 | 2.74472E-11 | |
| 4650 | 2.0 | 2.2 | 15.4347 | 2.40543 | 9.8221E-11 | ||
| 5000 | 1.5 | 2.5 | 7.50697 | 3.08701 | 1.32939E-11 | ||
| 5000 | 2.0 | 3.5 | 13.3495 | 2.73314 | 5.3398E-11 | ||
| 4750 | 1.75 | 2.3 | 11.0922 | 2.71169 | 3.7968E-11 | ||
| Postbump | 4200 | 2.0 | 1.0 | 18.9193 | 1.88619 | 2.64871E-10 | |
| 4200 | 2.5 | 2.1 | 33.6439 | 1.70841 | 7.09275E-10 | ||
| 5000 | 2.0 | 3.0 | 13.3495 | 2.66619 | 6.22976E-11 | ||
| 4800 | 2.4 | 4.0 | 22.9574 | 2.32022 | 2.01832E-10 | ||
| 4300 | 2.1 | 1.8 | 20.252 | 2.08234 | 1.983E-10 | ||
| 4500 | 2.2 | 2.5 | 20.7482 | 2.20398 | 1.84148E-10 |
| Ṁ | T⋆ | R⋆ | Tdust | Age | |
|---|---|---|---|---|---|
| (M☉yr-1) | (K) | (R☉) | (K) | (yr) | |
| 110-10 | 4000 | 10 | 25 | 16548 | |
| 20 | 28 | 23641 | |||
| 5000 | 10 | 27 | 37802 | ||
| 20 | 31 | 50164 | |||
| 110-9 | 4000 | 10 | 17 | 52163 | |
| 20 | 19 | 74736 | |||
| 5000 | 10 | 19 | 107675 | ||
| 20 | 20.5 | 171636 | |||
| 510-9 | 4000 | 10 | 15 | 75957 | |
| 20 | 16 | 125070 | |||
| 5000 | 10 | 15.5 | 198868 | ||
| 20 | 17 | 300273 | |||
| 310-8 | 4000 | 10 | 13 | 116681 | |
| 20 | 13.5 | 208958 | |||
| 5000 | 10 | 13.5 | 299198 | ||
| 20 | 14 | 537481 |
| M⋆ | tbump | tbump-tip | tclump |
|---|---|---|---|
| (M☉) | (yr) | (yr) | (yr) |
| 1.0 | 1.52E+07 | 1.27E+08 | 9.49E+07 |
| 1.2 | 1.11E+07 | 9.87E+07 | 7.98E+07 |
| 1.4 | 8.12E+06 | 7.50E+07 | 7.61E+07 |
| 1.6 | 6.85E+06 | 5.68E+07 | 8.07E+07 |
| 1.8 | 4.07E+06 | 3.54E+07 | 9.17E+07 |
| 2.0 | 2.45E+06 | 1.95E+07 | 1.03E+08 |