Life after eruption – V. Spectroscopy of eight candidate old novae with Gemini-South
Abstract
We present the analysis of photometric and spectroscopic data on eight candidates for post-nova systems. Five post-novae, V528 Aql, HS Sge, BS Sgr, GR Sgr and V999 Sgr, are successfully recovered. We furthermore identify likely candidates for the fields of V1301 Aql, V1151 Sgr and V3964 Sgr. The spectroscopic properties of the confirmed post-novae are briefly discussed. We find that two of the oldest post-novae in our sample, GR Sgr and V999 Sgr, contain an optically thick accretion disc, and thus can be suspected to have a high mass-transfer rate, contrary to what one would expect from most models. HS Sge and V528 Aql show evidence for a (comparatively) high system inclination, which makes them attractive targets for time series observations. Finally, the presence of particularly strong Heii emission together with a small eruption amplitude suggests that BS Sgr is a good candidate for an intermediate polar.
keywords:
binaries: close – novae, cataclysmic variables1 Introduction
In a cataclysmic variable (CV) a late-type main-sequence (secondary) star transfers mass via Roche lobe overflow to a white dwarf (primary), the latter being the more massive component. Depending on the strength of the magnetic field of the primary, the matter is accreted either via a disc and an inner boundary layer or along the magnetic field lines directly on the magnetic pole(s) of the white dwarf. Intermediate configurations, where only the inner part of the disc is disrupted by the magnetic field, are also known. For comprehensive information on CVs see the books by Warner (1995) and Hellier (2001).
Once a certain critical mass has accumulated on the surface of the white dwarf, a thermonuclear explosion is triggered that ejects the accreted material. This phenomenon is known as a (classical) nova eruption and represents the principal mechanism for mass-loss in CVs. It is not yet clear whether more or less than the accreted material is ejected, i.e. whether the white dwarfs in CVs gain or lose mass in the course of CV evolution. For recent reviews on novae see Bode & Evans (2012) and Woudt & Ribeiro (2014).
The underlying binary system is not destroyed in the nova eruption, but instead recommences mass transfer within a couple of years (Retter, Leibowitz, & Kovo-Kariti, 1998). This has thus to be a recurrent event, with the minimum recurrence time currently being estimated to (Shara et al., 2012). In contrast, the class of ‘recurrent novae’ includes novae with recurrence times 100 yr (and even as short as 1 yr; Tang et al., 2014; Darnley et al., 2014). They form a small and very heterogeneous sample of objects that in many respects are very similar to CVs and in others show significant differences (e.g. Schaefer, 2010; Anupama, 2013). In this study we will thus concentrate on classical novae.
From the above, it follows that CVs can be regarded as novae in-between eruptions (Vogt, 1982; Shara et al., 1986). It is still unclear to which extent the physical parameters of the CV – magnetic field, chemical composition, the mass-transfer rate – affect the nova recurrence time, although surely appears as the most important one (Townsley & Bildsten, 2005). Similarly, the consequence of the nova eruption for the (short– and long-term) evolution of CVs is not yet understood (Prialnik & Shara, 1986; Shara et al., 1986; Zorotovic, Schreiber, & Gänsicke, 2011; Wheeler, 2012).
One possibility to address these questions observationally is to compare the properties of the group of post-novae with those of other CVs. However, to be statistically significant such endeavour needs samples of sufficient size, and the group of post-novae still does not fulfil this condition. To alleviate this situation we have started a project to identify candidate post-novae via colour-colour diagrams and to confirm them spectroscopically (Tappert et al., 2012, 2014, hereafter Paper I and IV, respectively), determine the orbital period for the brighter post-novae (Tappert et al., 2013b, Paper III) and to study particularly interesting systems in more detail (Tappert et al., 2013a, Paper II).
In this fifth instalment of our series, we present data on eight candidate post-novae. The targets were selected from the Downes et al. (2005) catalogue of CVs, where they were marked as potential classical novae. In each case, the reported nova eruption took place more than 30 yr ago, which usually represents sufficient time for the ejected material to disperse and loose its dominance on the optical spectrum, so that the latter can be used to examine the underlying CV. The previous identifications of three objects, HS Sge, BS Sgr and V999 Sgr, were found to be ambiguous, and they were thus defined as targets for photometry to select likely candidates. Subsequently, long-slit spectroscopy data were obtained for the selected objects to confirm or reject the nova hypothesis. Another five suspected novae, V528 Aql, V1301 Aql, GR Sgr, V1151 Sgr and V3964 Sgr, appeared to be sufficiently well identified to include them directly as targets for spectroscopy.
In the following, we describe the observations and the employed techniques for data reduction (Section 2), provide short reviews of the previously available information on the individual targets and present our results (Section 3 and respective subsections), briefly discuss their implications (Section 4), and conclude with a summary of the most important results (Section 5). Finally, finding charts for the targets are collected in an appendix.
This project is still ongoing, and it is planned to further increase the sample of confirmed post-novae before discussing their properties in the context of CV evolution in a concluding paper.
2 Observations and reduction
| Filter | Night | Extinction | Zero pointa | Colour term |
|---|---|---|---|---|
| 2012-06-24 | 0.448(61)b | 0.25(15) | 0.230(51) | |
| 2012-07-18 | 0.448(61)b | 0.208(20) | 0.003(21) | |
| 2012-07-23 | 0.506(77) | 0.16(11) | 0.076(38) | |
| 2012-06-24 | 0.204(33) | 2.768(38) | 0.125(39) | |
| 2012-07-18 | 0.190(30) | 2.746(30) | 0.125(24) | |
| 2012-07-23 | 0.190(49) | 2.765(29) | 0.125(22) | |
| 2012-06-24 | 0.147(13) | 3.035(14) | 0.076(07) | |
| 2012-07-18 | 0.111(25) | 2.986(25) | 0.074(28) | |
| 2012-07-23 | 0.125(30) | 2.996(18) | 0.079(19) | |
| 2012-06-24 | 0.076(19) | 3.086(24) | 0.039(44) | |
| 2012-07-18 | 0.055(16) | 3.017(17) | 0.015(22) | |
| 2012-07-23 | 0.049(25) | 3.047(18) | 0.070(46) |
a With respect to a reference value of 25 mag.
b Tabulated value.
| Object | R.A. (2000.0) | Dec. (2000.0) | rms (arcsec) | Date | Filter/Grism | (s) | mag | Post-nova? |
|---|---|---|---|---|---|---|---|---|
| V528 Aql | 19:19:19.08 | 00:37:53.3 | 0.13 | 2014-04-04 | B600 (1.5 arcsec) | 3000 | 18.7R | Y |
| V1301 Aql | 19:17:55.20 | 04:47:18.3 | – | 2014-05-01 | B600 (1.5 arcsec) | 5391 | 18.9R | N |
| HS Sge | 19:39:22.11 | 18:07:54.6 | 0.37 | 2012-06-24 | /// | 1576 / 420 / 160 / 120 | 20.0V | Y |
| 2014-05-03 | B600 (1.5 arcsec) | 5391 | 19.6R | |||||
| BS Sgr | 18:26:46.39 | 27:08:21.6 | 0.23 | 2012-07-18 | /// | 1576 / 420 / 160 / 120 | 17.9V | Y |
| 2014-04-27 | B600 (1.5 arcsec) | 5392 | 17.4R | |||||
| GR Sgr | 18:22:58.50 | 25:34:47.3 | 0.18 | 2014-04-02 | B600 (1.5 arcsec) | 241 | 15.7R | Y |
| V999 Sgr | 18:00:05.70 | 27:33:13.8 | 0.32 | 2012-07-23 | /// | 1576 / 420 / 160 / 120 | 16.5V | Y |
| 2014-04-22 | B600 (1.5 arcsec) | 450 | 16.3R | |||||
| V1151 Sgr | 18:25:23.75 | 20:11:59.3 | – | 2014-04-02 | B600 (1.5 arcsec) | 4201 | 17.8R | N |
| V3964 Sgr | 17:49:42.60 | 17:23:35.3 | – | 2014-03-31 | B600 (1.5 arcsec) | 892 | 18.0R | N |
| 2014-04-22 | B600 (1.5 arcsec) | 892 | 18.0R |
For the three targets HS Sge, BS Sgr and V999 Sgr, photometric data were taken in 2012 in service mode at the ESO-VLT, Paranal Observatory, Chile, using the FOcal Reducer/low dispersion Spectrograph (FORS2; Appenzeller et al., 1998) system with the high throughput broad-band filters u_High, b_High, v_High, and R_Special. A series of four frames per filter was obtained. FORS2 exposures consist of a mosaic of two 2k4k MIT CCDs that are separated by a gap with a size of 7 pixels, yielding a total field-of-view of 6.86.8 arcmin2. The images from the two CCDs are stored in two different files, and we used the fsmosaic routine from the FORS Instrument Mask Simulator (FIMS) package to combine them into one image prior to reduction. Using this combined image instead of reducing each CCD individually introduces a minor statistical uncertainty due to the slightly different read-out-noise of the two CCDs (2.7 and 3.6 electrons per pixel), which, however, is not relevant to our results. The images were corrected with bias and flat frames using the ccdred package of iraf. The frames were corrected for the individual telescope offsets and combined to an average image using a 3 clipping algorithm to minimize the effect of bad pixels and cosmic rays. Photometric magnitudes for all stars in the fields were extracted using the aperture photometry routines in iraf’s daophot package and the stand-alone daomatch and daomaster routines (Stetson, 1992). These magnitudes were calibrated using observations of standard stars (Landolt, 1983, 1992; Stetson, 2000). The respective calibration coefficients are gathered in Table 1. Most nights, only one standard field for the filter was observed, and thus a standard value for the extinction was used that was taken from the observatory website111http://www.eso.org/sci/facilities/lasilla/instruments/efosc/inst/zp/.html. It is based on measurements taken at La Silla Observatory, about 400 km south of Paranal Observatory. Comparison of the extinction values for the other filters show that the values should be identical within the uncertainties. As we will see in Sections 3 and 3.6, the object that was identified as the post-nova in the field of V999 Sgr proved to be saturated in the photometric data, and thus the photometry of this field bears no further relevance for this paper. However, the respective calibration values are still included in Table 1, since they serve to evaluate the consistency of the photometric calibration.
The spectroscopic data were obtained at Gemini-South on Cerro Pachón, Chile, in queue mode using the Gemini Multi-Object Spectrograph (GMOS; Hook et al., 2004), at that time equipped with a CCD array of three 2048x4608 EEV chips. Grating B600 with a 1.5 arcsec slit yielded a typical wavelength range of 4200 – 7000 Å and a resolving power of 800. A central wavelength at 5600 Å was chosen so that the two 22-pixel-wide gaps between the CCDs affect for our purposes comparatively unimportant parts of the spectrum. These, however, include the Hei lines at 4472 and 5876 Å, respectively. The reduction of the data was performed using the gemini – gmos extension for iraf as contained in the ureka software package222http://ssb.stsci.edu/ureka/. This included the subtraction of an averaged bias frame and division by a flat-field that was previously normalized by fitting a cubic spline of high order to the response function. A two-dimensional wavelength calibration solution was obtained with respect to a CuAr lamp. After extraction, the spectra were corrected for the instrumental function using corresponding data of the spectrophotometric standard LTT 3218 taken on 2014 March 13. This flux calibration can be assumed to be extremely uncertain, because it relies on a single observation that was performed on a different night than the observations of the targets, and the latter were not necessarily undertaken in photometric conditions. In addition to that unknown flux zero-point, we found that also the instrumental response function is not well-determined and shows inconsistencies from one CCD chip to another. This is addressed in more detail in Section 3.
We summarize the details on the observations in Table 2, sorted in order of the variable star name and constellation. The second and third column of the table contain the coordinates. For the confirmed novae, these were newly determined performing astrometry with Starlink’s gaia333http://astro.dur.ac.uk/pdraper/gaia/gaia.html tool (version 4.4.3) using the US Naval Observatory CCD Astrograph Catalog (UCAC) version 3 (Zacharias et al., 2010) and 4 (Zacharias et al., 2013). The fourth column states the associated root mean square (rms). Coordinates for the targets that turned out to not be post-novae were taken from Downes et al. (2005). Column 5 gives the date of the observations corresponding to the start of the night in local time. In column 6 we list the instrument configuration, i.e. filter or grating and slit, and column 7 contains the total exposure time. Column 8 gives the brightness at the time of the observations with the letter at the end identifying the corresponding passband, and the last column presents an overview on which system was confirmed as a post-nova. The values for the spectroscopic data were measured as differential photometry with respect to five comparison stars on the acquisition frames which were taken in the GMOS-S filter. Calibrated values were derived by comparison with our previous photometry or with the Guide Star Catalog, Version 2.2 (Lasker et al., 2008).
3 Results
| Object | Balmer | He i | Bowen | He ii | C iv | ||||||
|---|---|---|---|---|---|---|---|---|---|---|---|
| 4340 | 4861 | 6563 | 4922 | 5016 | 5876 | 6678 | 4645 | 4686 | 5412 | 5812 | |
| V528 Aql | 1.8(3) | 4.0(4) | 13.3(7) | – | – | –1 | 2.5(2) | 4.6(5) | 2.9(6) | – | – |
| HS Sge | 6.0(6) | 7.6(3) | 14.6(3) | 1.4(2) | 0.3(1) | –1 | 2.5(2) | 17.2(5)2 | 17.2(5)2 | 1.5(2) | – |
| BS Sgr | 3.5(2) | 4.7(1)3 | 12.2(1)3 | 0.4(1) | 0.2(1) | –1 | 1.4(1) | 7.1(1) | 15.1(2) | 2.8(1) | 1.2(3) |
| GR Sgr | [0.4(1)] | [1.0(2)] | 2.5(1) | – | – | – | 0.8(1) | 0.6(1) | 1.8(3) | – | – |
| V999 Sgr | [0.6(1)] | [1.7(1)] | 4.7(2) | 0.2(1) | 0.3(1) | –1 | 1.1(1) | 2.7(3) | 3.1(1) | 0.5(1) | 0.8(2) |
1 Present, but too distorted for measurement.
2 Bowen/Heii blend.
3 Blended with Heii emission.
While in the subsequent chapters we present the results on the individual targets, in the following we briefly describe our analysis methods that apply to all objects.
We analyse the spectra of the confirmed post-novae with respect to the spectral energy distribution (SED) and the properties of the principal emission lines. To measure the equivalent widths , three wavelength ranges were specified manually. They consisted of the central range that fully contains that line, and of two small adjacent sections to the blue and the red that served to compute a linear fit to the continuum. For convenience, we use positive values for . This is unambiguous since we exclusively refer to emission lines. The corresponding errors were estimated with a Monte Carlo simulation by adding random noise to the data and repeating the equivalent width measurement a thousand times.
In order to recover the intrinsic SED, we employ the values for interstellar extinction from Schlafly & Finkbeiner (2011), collected on NASA’s Infrared Science Archive (IRSA) web pages, to deredden the spectra. We use the relations derived by Cardelli, Clayton, & Mathis (1989) as implemented in iraf, and a standard value for the ratio of the total to the selective extinction . The corresponding values are available as the average extinction within a 22 deg2 field. This represents a severe limitation as it does not take into account potential small-scale variations in the dust structure, nor the actual amount of absorbing material in the line of sight to the target. Since CVs are intrinsically rather faint (typically, mag; e.g. Patterson, 1984), in general the correction for the interstellar extinction will represent an upper limit. An additional uncertainty regarding the intrinsic SED is introduced by obtaining the flux calibration on the basis of a single standard star that was observed on a different night than the targets. Furthermore, the observations were not conducted at a parallactic angle and thus might be affected by chromatic slit loss due to differential refraction, since Gemini-South is not equipped with an atmospheric dispersion corrector. As a measure for the SED, we derive the exponent of a power law that was fitted to the spectra, restricting the continuum to wavelengths 5000–7000 Å and masking strong emission and absorption lines. During that analysis we found that most of the post-novae required a two-component fit while previously this represented an exception (\al@tappertetal12-1,tappertetal14-1; \al@tappertetal12-1,tappertetal14-1). Furthermore, in every case the two slopes differed in the same direction, with the red part of the spectrum requiring a steeper slope than the blue part, and the points that separated the two slopes were found to be within 5850–5900 Å which marks the region that is affected by the gap between two CCDs (see Section 2). All this suggests a systematic effect in the definition of the instrumental response function, and potentially a difference in the spectral efficiency of these two CCDs. We have thus further divided the fitting range into a blue (5000 Å 5870 Å) and a red (5870 Å 7000 Å) part that are fitted individually. The consequences for the interpretation of the SEDs are further discussed in Section 4.
Finally, to estimate the spectral type of the targets that turned out not to be post-novae, as well as for a few other objects, we used the standard star libraries of Jacoby, Hunter, & Christian (1984), Pickles (1985) and Silva & Cornell (1992).
3.1 V528 Aquilae = Nova Aql 1945
As reported by Duerbeck (1987), this fast nova was discovered on 1945, August 26 by Bertaud and then independently two nights later by Tamm. Strope, Schaefer, & Henden (2010) analysed the decline curve and classify it as ‘smooth’, although it appears to be modulated with small-amplitude oscillations (Bianchini, Friedjung, & Brinkmann, 1992).
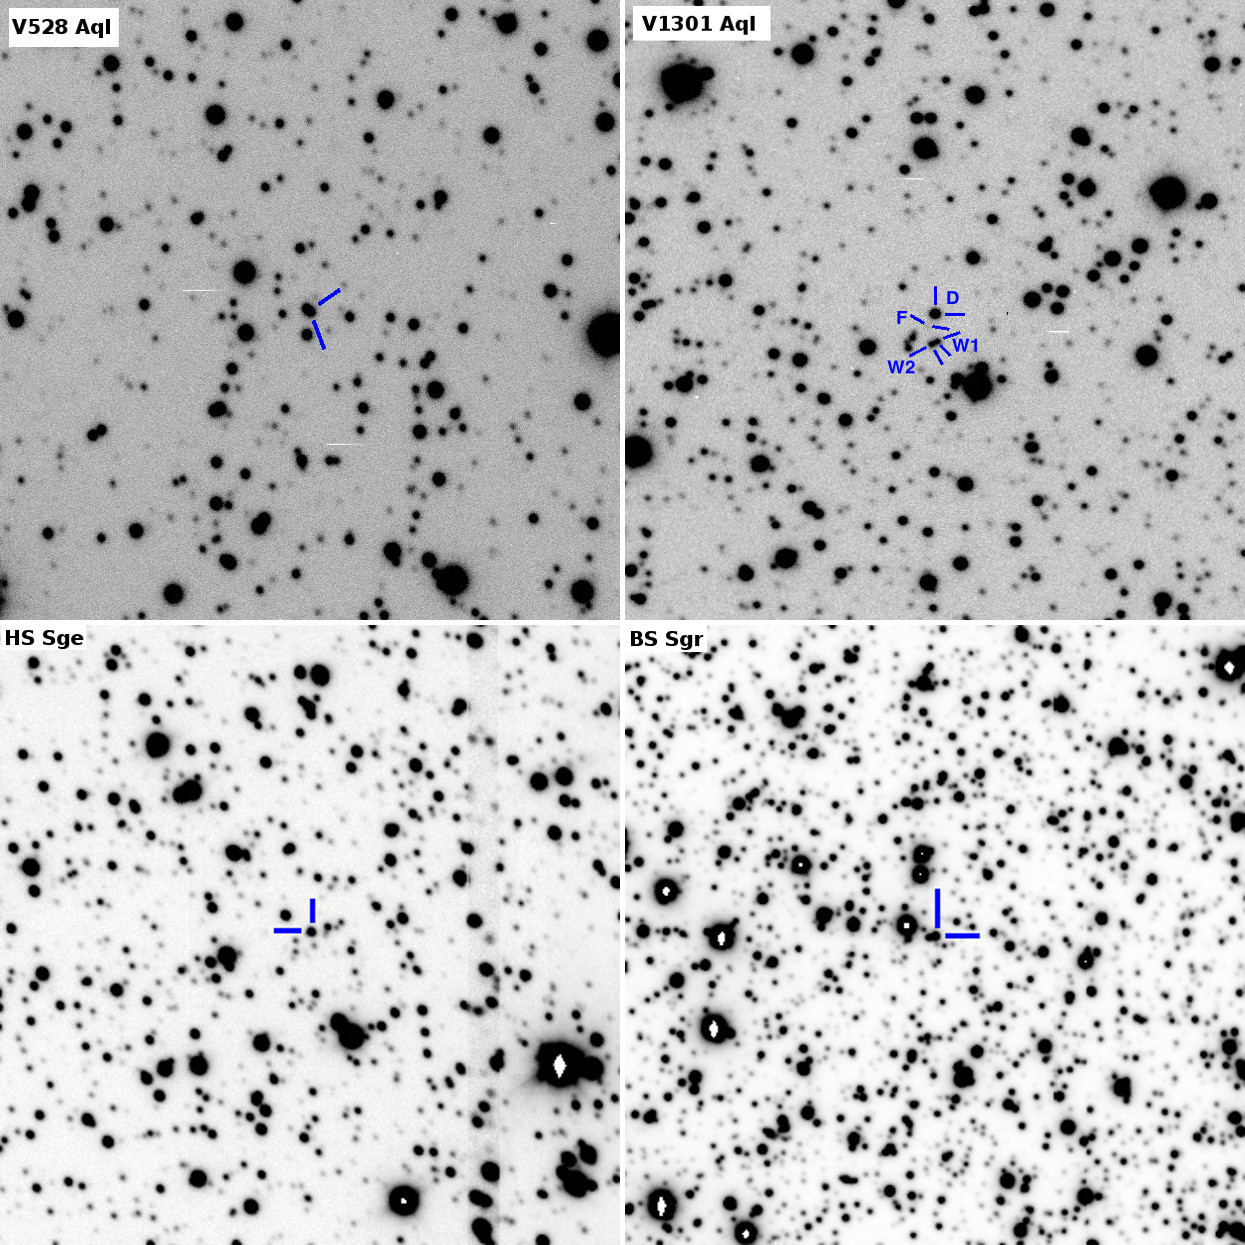
Our observations show that the post-nova is part of a close visual binary. Astrometry gives the position of the neighbour to RA = 19h19m1912, Dec. = +0037538, and thus approximately 0.8 arcsec north-east of the post-nova. The neighbour is also the slightly brighter object. Comparison with the GSC 2.2 catalogue yields for this star, and mag for the post-nova. Note that above errors are dominated by the uncertainty in the zero-point, while the precision for the differential photometry is 0.01 mag. Our comparison of the spectrum of the close neighbour with standard star libraries indicates a spectral class of late G to early K. Previous photometry of V528 Aql, e.g. by Szkody (1994), is likely to have included both components, thus yielding a larger brightness and redder colours. Based on the present photometric data mag and the maximum brightness mag from Strope et al. (2010) we calculate the eruption amplitude mag.
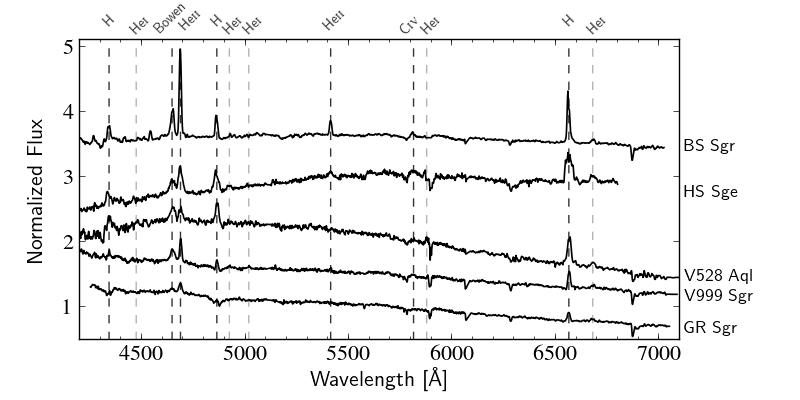
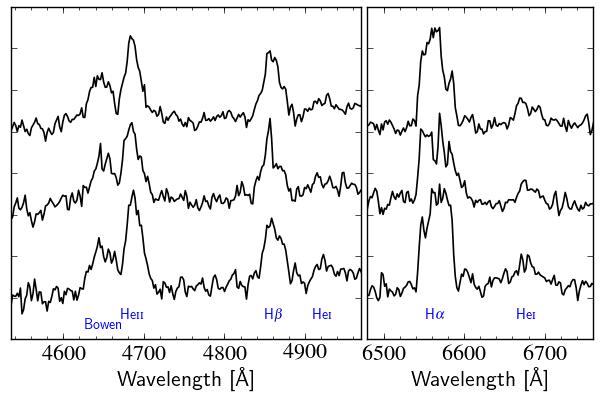
Due to the close apparent proximity, the visual binary is not resolved in our spectroscopic data. This made it necessary to extract the spectra simply as the average of 10 CCD rows containing a part of the point-spread function that was selected to minimize contamination by the neighbour, without the usually performed tracing and fitting the spatial position as a function of wavelength. However, this turned out not to be a severe limitation since the variation in the position resulted to 1 pixel over the whole wavelength range. The extracted spectrum of the post-nova is presented in Fig. 1. It shows moderately strong emission of the Balmer series as well as Hei (Table 3). The Bowen blend and Heii are also present, but not particularly strong. No other Heii or carbon lines can be identified. The difference in the slope parameters is particularly pronounced in this object, amounting to (Table 8). We suspect that this is caused by a certain level of contamination by the close neighbour.
Overall, the spectrum indicates a non-magnetic CV with a, for post-novae, medium high mass-transfer rate. The lines are neither particularly broad nor narrow, pointing to a medium system inclination. In our individual spectra a displacement of the emission lines especially of the first spectrum with respect to the other two is clearly detected. This is thus a suitable target for spectroscopic time series observations to derive the orbital period, with the caveat that such data have to be taken in very good seeing conditions in order to properly separate the two components of the visual binary.
3.2 V1301 Aquilae = Nova Aql 1975
| RA | Dec. | (mag) | Remarks |
|---|---|---|---|
| 19:17:55.24 | +04:47:18.4 | – | Duerbeck (1987) |
| 19:17:55.39 | +04:47:13.4 | – | Wild (1975) |
| 19:17:55.31 | +04:47:17.4 | 18.91(36) | ‘D’ |
| 19:17:55.29 | +04:47:13.3 | 20.02(36) | ‘W1’ |
| 19:17:55.34 | +04:47:12.9 | 19.98(36) | ‘W2’ |
| 19:17:55.37 | +04:47:15.4 | 22.18(41) | ‘F’ |
This is a comparatively recent nova that was discovered by Wild (1975). The date of maximum brightness as well as the eruption magnitude were later corrected by Howarth (1976) to 1975 June 4 and 10.3 mag, respectively. The authors also present the decline light curve. Duerbeck (1987) classifies the object as a fast nova with a time of decline by 3 mag d. Infrared data and a red optical spectrum 45 d after the discovery are included in Vrba et al. (1977), and Pesch, Sanduleak, & Chen (1975) describe the spectrum 95 d after eruption.
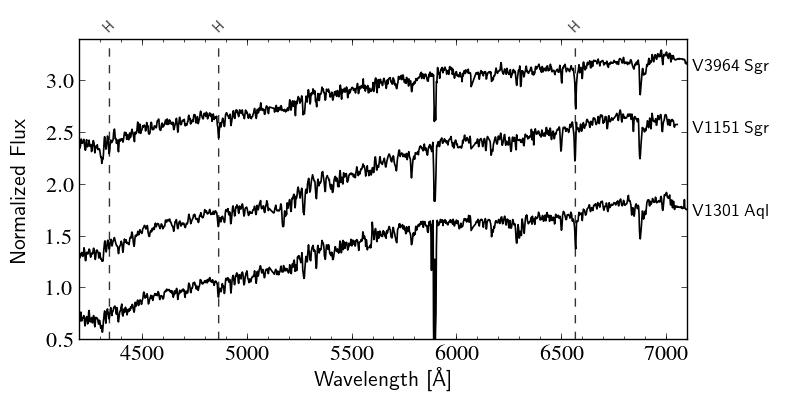
We have observed the object marked in Duerbeck (1987) and Downes et al. (2005). However, the spectrum does not resemble that of a CV (Fig. 2). Instead, after dereddening we find very good agreement with the data of HD 29050 that Jacoby et al. (1984) classify as a G9V–K1V star. Photometry on our acquisition frame gives mag, and thus the target also appears as too bright, because the implied eruption amplitude of 8.6 mag would be unusually small for a fast nova (Warner, 1995), although it is well within the range of recurrent novae (Schaefer, 2010).
The published eruption spectra indicate that V1301 Aql was a nova, and since the decline light curve has been comparatively well covered, we do not expect a very large uncertainty with respect to its position. Comparing the coordinates given in Duerbeck (1987) and Downes et al. (2005) to those of the original discovery by Wild (1975) yields a discrepancy of about 6 arcsec. On our acquisition frame we find a visual binary close to the Wild (1975) coordinates, its components marked with ‘W1’ and ‘W2’ on our finding chart in Fig. 8, where the original candidate is marked as ‘D’. Both components are also about 1 mag fainter than ‘D’ and would thus agree somewhat better with the classification of a fast nova. Another possible candidate is a very faint object situated between ‘D’ and ‘W2’, marked as ‘F’. Its brightness would fit best that expected of a fast nova. The coordinates and derived magnitudes are summarized in Table 4. Further photometric and spectroscopic data will be necessary to recover the nova, but for now the above three objects appear as the best candidates.
3.3 HS Sagittae = Nova Sge 1977
| Object | ||||
|---|---|---|---|---|
| HS Sge | 19.99(03) | 0.06(01) | 0.88(01) | 0.69(01) |
| BS Sgr | 17.90(05) | 0.21(01) | 0.69(01) | 0.62(01) |
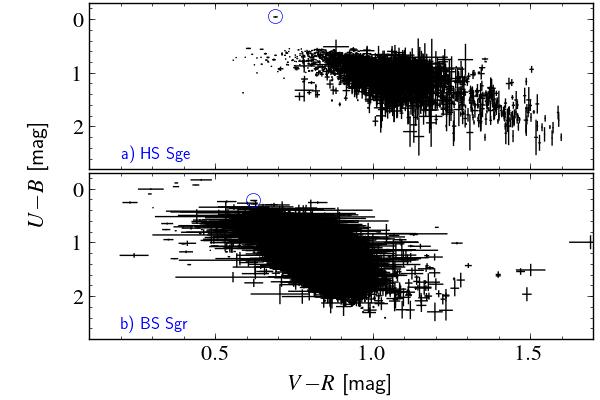
Another recent nova, HS Sge was discovered 1977, January 7 at a visual brightness of 7.2 mag (Milbourn, Hosty, & Hurst, 1977). The decline light curve was analysed by Strope et al. (2010) who classify it as type ‘P’ (plateau) and derive a fast decline time d. Szkody (1994) present photometric data of the post-nova and finds mag. However, the finding chart in Downes et al. (2005) marks a blend of several stars so that the precise position of the post-nova was not sufficiently well known to obtain a spectrum.
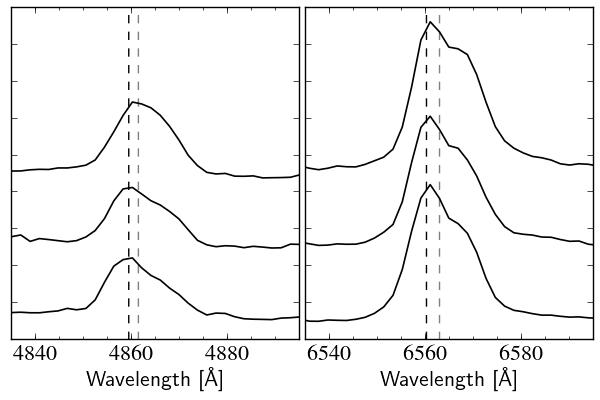
In the colour-colour diagram one object close to the reported coordinates stands out in being positioned far away from the bulk of the field stars (Fig. 3, Table 5). The spectrum confirms the nova, presenting moderately strong Balmer emission lines, Hei, the Bowen blend, and a strong contribution of Heii, which can be detected both at 4686 and 5412. The profile of the H emission line is especially interesting in that it contains unusually steep wings and appears to include several peaks. In Fig. 4 we show a close-up of several lines in the three individual spectra. The presence of an additional narrow emission component that moves within the broader line profile can be clearly identified in the Balmer lines, most prominently in the second spectrum. At least the blue wing of the H line still appears unusually steep. One might thus suspect that this is caused by the presence of another emission component. However, other than in BS Sgr (Section 3.4), the Heii emission lines corresponding to the transition to the third excitation level are weak, and only the line at 5412 can be identified with certainty. This excludes a significant contribution of the 6560 line to the H profile. Furthermore, like the other emission lines, H is found to be centred rather symmetrically on its rest wavelength, which makes a distortion due to other lines rather unlikely. Since a comparatively short time has passed since the nova eruption, one could suspect that the line profile is due to additional emission from the ejected matter. However, on the 2D spectroscopic image we do not find any evidence for the presence of a shell. Clearly, more data are needed to investigate the line profile in more detail. At the very least, the broad and variable line profiles point to a high system inclination, which makes HS Sge an attractive target for time series observations.
Strope et al. (2010) suspect that novae with plateau-type decline light curves are either recurrent novae (see also Pagnotta & Schaefer, 2014) or belong to the V1500 Cyg class, i.e. contain a highly magnetized white dwarf. The large eruption amplitude mag and the strong presence of Heii lets the latter scenario appear as the more likely one. However, the shape and width of especially the Hei 6678 emission line indicates the existence of at least an outer disc, so that the magnetic field of the white dwarf can be assumed to be weaker than in polars.
3.4 BS Sagitarii = Nova Sgr 1917
The nova was discovered by Innes (1917) on a plate from 1916 July 17 at a magnitude of 11.8, reaching 10.5 mag two nights later. An independent and more comprehensive study by Cannon (1923) showed that the object rose slowly to a maximum brightness of 9.2 mag exactly one year after its discovery, followed by a slow decline with d (Duerbeck, 1987). Perhaps due to the scarceness of the data, BS Sgr is not part of the long-term light-curve analysis of Strope et al. (2010), but the observed behaviour suggests that it belongs to the small group of novae with ‘flat-topped’ (F class) light curves. The authors find four such systems within their sample of 93 novae. The physical reason behind the prolonged plateau near maximum brightness is unknown. Duerbeck & Seitter (1987) find , and from spectrophotometric data on the post-nova taken between 1983 and 1985, and describe the spectral range between 3900–7000 Å as featureless apart from the Heii and Bowen blend, and perhaps Cii 4267. However, as we will see below in more detail, neither the brightness and colours, nor the description of the spectrum agrees well with the object that we identify as the likely post-nova (Table 5, Fig. 1). The latter is located about 5 arcsec south-east of the object indicated in the finding chart by Duerbeck (1987). It appears possible that due to the closeness of the objects, the spectrum described by Duerbeck & Seitter (1987) is a result of the slit being centred on the object marked in Duerbeck (1987), but, depending on the orientation of the slit and the seeing conditions, includes some contribution by the post-nova, thus explaining the apparent presence of the blue emission lines. Subsequent studies, e.g. by Ringwald, Naylor, & Mukai (1996) (who remark that the colours are that of a reddened K star), Hoard et al. (2002) and Saito et al. (2013), can be assumed to refer to the object identified in Duerbeck (1987).
The colour-colour diagram, while containing several blue objects, does not immediately indicate the nova (Fig. 3). The broad distribution of colours suggests that the likely reason for this is a certain patchiness of the interstellar extinction in this region. However, we found the bluest object within the central 1 arcmin of the field to be located only 5 arcsec off the reported coordinates of the nova eruption, which made it a promising target for the spectroscopic follow-up observations.
The spectrum confirms the CV. It is remarkable in that it presents an unusually strong contribution from Heii. First, the 4686 line, which originates from the transition to the second excitement level, represents by far the strongest emission line in BS Sgr. Secondly, also all lines that originate from the transition to the third level are detected, at 4542, 4859, 5412 and 6560 Å (Fig. 1). The two lines that are close to the Balmer lines are not resolved, but visibly distort the line profile. In Fig. 5 we show a close up on the two Balmer – Heii blends in the three individual spectra. We notice that from the first to the third spectrum the Balmer components become stronger indicating that the region where that emission originates moves further into the line of sight. Potentially present different radial velocities of the two components could further contribute to the variation of the line profiles.
Prominent Heii emission usually indicates the presence of a highly magnetic white dwarf primary. We can probably exclude the possibility that BS Sgr is a polar, because the absence of an accretion disc should be reflected in a large eruption amplitude (e.g. the best candidate for such a system, V1500 Cyg, has mag; Strope et al., 2010), and with mag BS Sgr is clearly a nova with a rather small eruption amplitude. It is thus more likely to be an intermediate polar. On the other hand, the emission lines are comparatively narrow (Table 8), while at the same time the variation in the line profiles mentioned above – if due to an orbital effect – suggests that the system is seen at a medium to high inclination. This makes it rather unlikely that the emission lines originate in an accretion disc. A likely alternative is that they are located on the potentially irradiated side of the secondary star (see e.g. Paper II, where we find such an emission component in the old nova V728 Sco).
3.5 GR Sagitarii = Nova Sgr 1924
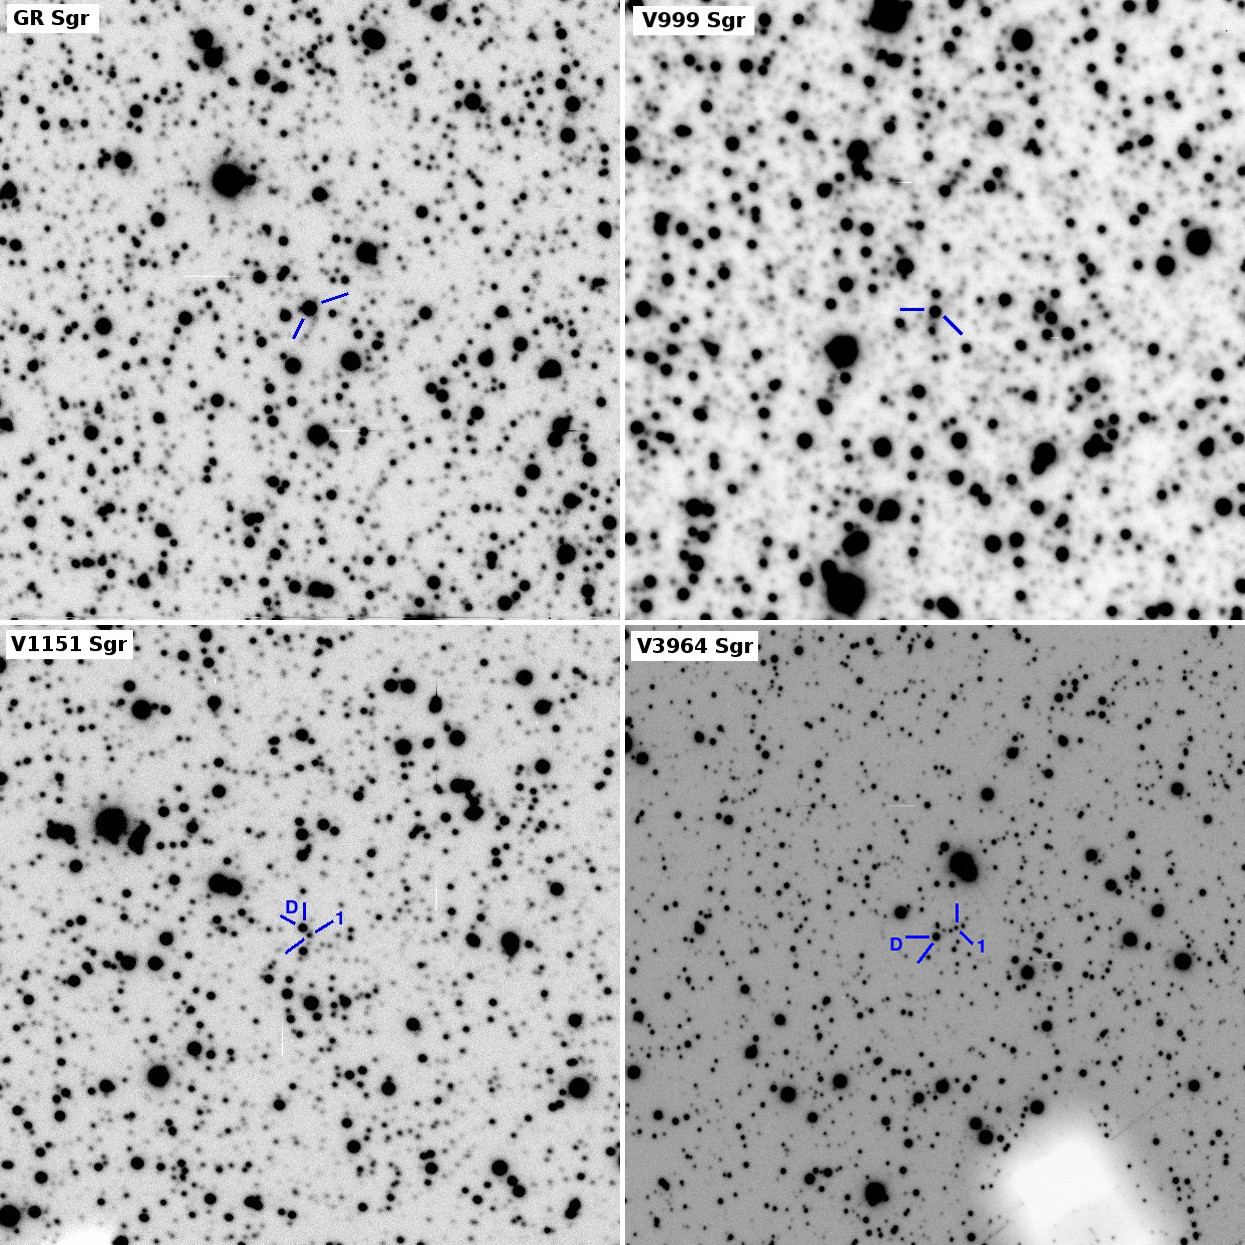
Woods (1927) discovered the nova on a plate from 1924 April 30 at 11.4 mag. Based on subsequent data she suspected that maximum brightness had been missed. Duerbeck (1987) agrees that the nova had erupted several months before its discovery and estimates that the object at maximum was about 4 mag brighter. The quiescent brightness is also reported by Woods as 16.6 mag both before (1923 September) and after (1925 October) the eruption. Further, near-infrared, photometric data are given by Hoard et al. (2002) and Saito et al. (2013). Although the post-nova is comparatively bright, the published spectrum by Ringwald et al. (1996) shows little detail, apart from a few, weak, emission lines, leading the authors to only tentatively confirm the object as a nova. The previous description of a spectrum by Duerbeck & Seitter (1987) is equally unsatisfactory.
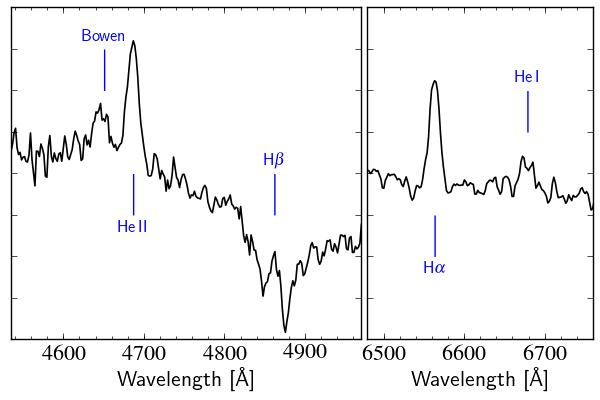
Our own spectroscopic data in Fig. 1 show a blue continuum with the higher Balmer lines being embedded in the absorption troughs of an optically thick disc. There is even a hint of the presence of absorption in H (Fig. 6). In contrast, the Bowen blend, Heii and the only detectable Hei line at 6678, are purely in emission.
Photometry of the acquisition frame yields mag, which within the uncertainties corresponds to the same brightness as the spectrophotometrically derived values by Duerbeck & Seitter (1987) and Ringwald et al. (1996). Clearly, GR Sgr still remains in a state of a very high accretion rate, 90 yr after its eruption.
3.6 V999 Sagitarii = Nova Sgr 1910
Pickering (1910) reports the discovery of this object by W. Fleming on photographic plates from 1910 March 21 to June 10, where it reached a maximum brightness of 7.8 mag. The further photometric behaviour is described e.g. by Swope (1940). Duerbeck (1987) classifies it as a slow nova with d. Duerbeck & Seitter (1987) describe the post-nova spectrum as a blue continuum with weak emission lines. They derive spectrophotometric magnitudes and colours to mag, , . However, in strong contrast to that description, a spectrum presented by Ringwald et al. (1996) showed a featureless red continuum, with corresponding spectrophotometric values mag, , . Saito et al. (2013) do not detect the post-nova in the near-infrared.
Since the identification of the post-nova thus seemed unclear, we took photometry of the field. The respective colour-colour diagram did not present any interesting star near the reported position. However, a visual inspection of the images showed that the object in the centre of the knot of stars marked by Downes et al. (2005), just above the saturation limit of our observations, appeared blue, and was thus selected for follow-up spectroscopy.
The spectrum in Fig. 1 confirms the nova. Its appearance is somewhat similar to that of GR Sgr (Section 3.5) in that the higher Balmer lines are in absorption troughs, indicating a high mass-transfer rate. In contrast to GR Sgr, the troughs are not as profound, the blue lines of the Hei series are clearly detected, and the higher excitation lines of Heii 5412 and Civ 5812 are present. The lines are narrow (Table 8), so that the system inclination can be suspected to be comparatively low. In agreement with this, an examination of the three individual spectra does not show any evidence for radial velocity variations.
The IRSA web page lists a very high extinction value for the region around V999 Sgr of . Correcting for this value permits to fit the SED with an exponent . However, considering the spectral appearance, this value appears exaggerated (see also \al@tappertetal12-1,tappertetal14-1; \al@tappertetal12-1,tappertetal14-1, ), and thus applying the average extinction here very likely results in an overcorrection of the reddening.
Finally, the results from Ringwald et al. (1996) and Saito et al. (2013) raise the possibility that V999 Sgr shows large variability. However, the post-nova is located in a comparatively crowded field, and the previously published finding charts left ample room for ambiguity. Thus, Ringwald et al. (1996) likely observed a different object. Similarly, the coordinates used by Saito et al. (2013) are roughly 1.6 arcsec off the actual position, and thus the post-nova is just outside their identification limit of 1 arcsec, with the large number of stars in the vicinity additionally preventing an unambiguous choice. A closer inspection of the publicly available data from the Vista Variables in the Vía Láctea (VVV) survey (Saito et al., 2012) shows that the post-nova is indeed visible on all images, and that it corresponds to the VVV source 515510491978. For this object, and data tabulated magnitudes are available, with mag and mag for an aperture radius of 1.0 arcsec.
3.7 V1151 Sagitarii = Nova Sgr 1947
| RA | Dec. | (mag) | Remarks |
|---|---|---|---|
| 18:25:23.79 | 20:11:59.3 | – | Duerbeck (1987) |
| 18:25:20 | 20:11:51 | – | Mayall (1949) |
| 18:25:23.86 | 20:11:58.3 | 17.80(61) | ‘D’ |
| 18:25:23.79 | 20:11:59.4 | 18.87(61) | ‘1’ |
According to Duerbeck (1987), this little-studied nova reached a maximum photographic brightness of 11.1 mag on 1947 August 11, while the original discovery note by Mayall (1949) gives mag, without specifying the date. Based on an unpublished light curve by J. Warren, Duerbeck classifies it as a slow nova with d. To our knowledge, there are no further observations of this nova other than the data from the 2 Micron All-Sky Survey provided by Hoard et al. (2002).
We took a spectrum of the object marked and described (‘north object of close pair’) by Downes et al. (2005), but found it to show a red continuum without any emission lines (Fig. 2). A comparison of this spectrum, corrected for interstellar extinction (), with the standard star catalogue of Jacoby et al. (1984) showed it to be in good agreement with a spectral type K3V. However, the acquisition frame shows a 1 mag fainter object close to our target, whose coordinates agree even better with those given by Duerbeck (1987), and which thus appears as a likely candidate for the post-nova. We have marked this object as ‘1’ and the original candidate as ‘D’ on the finding chart in Fig. 9, and summarize the data in Table 6. As a caveat, we remark that the revised coordinates from Duerbeck (1987) disagree considerably (by almost 1 arcmin) with those originally reported by Mayall (1949). It might thus be advisable to first confirm photometrically that ‘1’ is a good candidate before ‘risking’ a spectrum.
3.8 V3964 Sagitarii = Nova Sgr 1975
| RA | Dec. | (mag) | Remarks |
|---|---|---|---|
| 17:49:42.39 | -17:23:35.7 | – | Duerbeck (1987) |
| 17:49:42.0 | -17:23:21 | – | Lundström & Stenholm (1977) |
| 17:49:42.62 | -17:23:36.1 | 17.95(49) | ‘D’ |
| 17:49:42.42 | -17:23:34.8 | 19.99(49) | ‘1’ |
The nova was discovered on an objective prism plate from 1975 June 8, by Lundström & Stenholm (1976, 1977). The authors estimate the brightness to 8.5 mag. Based on the spectral appearance they suggest that the real maximum was missed and that the nova had already declined by 3 mag. A search on Sonneberg plates by Huth (1976) revealed an earlier detection on 1975 June 1, at a brightness of 9.4 mag. If the suspicion by Lundström & Stenholm (1977) is correct, this would make it a pre-maximum detection. The fact that the nova was not detected to a plate limit of 11 mag already on 1975 July 5, in any case classifies it as a fast nova. Duerbeck (1987) estimates d. Patterson et al. (1981) include the object in a list of potential WZ Sge-type dwarf novae, however, without providing a more detailed justification. The near-infrared data listed in Hoard et al. (2002) suggest mag (using typical colour values from Szkody, 1994) and thus – as we will see below – likely correspond to the wrong star.
The object marked by Downes et al. (2005) turned out to be a knot of several stars. Our spectroscopic observations were centred on the brightest of those, marked as ‘D’ in the finding chart (Fig. 9). This, however, is not the post-nova system, but a red main-sequence star. From comparison of the dereddened () data with Jacoby et al. (1984) and Pickles (1985) we estimate a spectral type K1V. The object was observed twice, because during the first time the slit was not well centred on the target. A visual inspection of the two-dimensional spectroscopic data showed that during that first observation weak H emission could be detected north-west of the target. This emission was not spatially resolved, leaving three faint objects as potential sources. However, during the second observation this emission was not detected. Comparison of the respective slit images finally revealed one object that was found to be partially in the slit in the first data set, and out of the slit in the second. This object, which is thus very likely to be the post-nova, is marked as ‘1’ in our finding chart (Fig. 9).
4 Discussion
| Object | 1 | 2 | FWHM(H) | |||||||
|---|---|---|---|---|---|---|---|---|---|---|
| (mag) | (mag) | (mag) | (yr) | (d) | (mag) | (Å) | (Å) | (km s-1) | ||
| V528 Aql | 6.9 | 18.7 | 11.7 | 69 | 37 | 0.39 | 2.96(03)/5.15(04) | 13 | 20 | 915 |
| HS Sge | 7.2 | 20.0 | 12.8 | 35 | 21 | 1.20 | 2.92(03)/3.31(01) | 15 | 35 | 1600 |
| BS Sgr | 9.2 | 17.9 | 8.7 | 95 | 700 | 0.33 | 1.19(02)/1.81(02) | 123 | 143 | 6403 |
| GR Sgr | 11.4 | 15.7 | 5.1 | 90 | – | 0.46 | 2.36(02)/2.97(02) | 3 | 15 | 685 |
| V999 Sgr | 7.8 | 16.3 | 8.5 | 104 | 160 | 1.70 | 6.69(02)/6.61(02) | 5 | 13 | 595 |
1 : photographic, : -band, : blue, : visual.
2 First value for 5000 Å 5870 Å, second for 5870 Å 7000 Å (see text).
3 Blend.
The confirmed post-novae of this work, V528 Aql, HS Sge, BS Sgr, GR Sgr and V999 Sgr, cover a broad range of parameters, which we have summarized in Table 8: the apparent maximum brightness , the brightness during our observations, the resulting eruption amplitude , with (as already used in Section 3.1), the ‘age’ of the post-nova , i.e. the time that has passed between maximum brightness and our observations, the time of decline to three magnitudes below maximum , the interstellar extinction that was used for the dereddening, the exponents of the power laws that were fitted to the dereddened ‘blue’ and ‘red’ SED with the errors representing the standard deviation of the slope of the fit and finally the equivalent width and the full width at half-maximum (FWHM) of the H emission line. Of those, , and represent indicators for the mass-transfer rate . This is based on accretion discs in high- systems being bright, blue and optically thick (e.g. Frank, King, & Raine, 2002), which in turn corresponds to a small , high and small , respectively. It should be noted that in we do ignore that different bandpasses (may) have been used for measuring and . Considering the typical colour space of CVs (e.g. Bruch & Engel, 1994; Szkody, 1994), we estimate the respective uncertainty to 0.5 mag.
However, there are a number of other factors that affect the above parameters. The brightness of the disc, and thus , depends on the system inclination (Warner, 1995). Regarding the line strengths, can potentially sample more than one line, as is the case for BS Sgr, and furthermore is of course only then an indicator of the optical thickness of the disc if (most of) the line actually originates in the disc. Finally, the validity of the parameter that measures the slope of the SED depends strongly on the correction for interstellar extinction and the determination of the instrumental response function. Summarizing the discussion in Section 3, we point out that the extinction correction using the tabulated data does not take into account potential small-scale dust concentrations, nor the actual position of the target with respect to the dust along the line of sight. In general, the correction will represent an upper limit, and at least in the case of V999 Sgr the resulting SED likely suffers from overcorrection. Secondly, the instrumental response function relies on the data of a single standard star that were taken on a different night than the spectroscopy of the targets. Finally, the central CCD chip and the one covering the red part of the spectrum (redwards of 5870 Å) likely have a different spectral efficiency that could not be corrected for with the available standard star data. This causes the SED in the ‘red’ chip to have a somewhat steeper slope than in the central chip. Therefore, while it should be feasible to discuss the values derived here for within the present sample, only a very rough comparison with other works will be possible. Nevertheless, we point out that the parameters derived for the present post-novae (excluding V999 Sgr) lie well within the previously observed distribution (\al@tappertetal12-1,tappertetal14-1; \al@tappertetal12-1,tappertetal14-1). As a consequence of the various respective uncertainties, the parameters above cannot be used as unambiguous indicators for the intrinsic properties of the post-novae on their own, but have to be evaluated together. In this way, and additionally taking into account the FWHM of the emission lines that serves as an indicator of the system inclination, it should be possible to obtain at least a rough picture of the nature of our post-novae.
We first examine the ‘blue’ and ‘red’ parameters. As mentioned in Section 3, the red slope is usually steeper than the blue one. For HS Sge, BS Sgr and GR Sgr that difference amounts to . In the case of V528 Aql the difference is much more pronounced. Since this system is an unresolved visual binary (Section 3.1), it is likely that the spectrum contains a certain level of contamination by the neighbour, so that it cannot be described by a power law. In V999 Sgr, on the other hand, blue and red are identical within . Here we find by far the largest , even in comparison to previous work (\al@tappertetal12-1,tappertetal14-1; \al@tappertetal12-1,tappertetal14-1), which lets it appear likely that this is due to overcorrection of the interstellar extinction. For such a steep slope, apparently the differences in the chip-specific sensitivities become negligible.
For a quantitative comparison we restrict ourselves to the blue values, mainly because in V528 Aql we suspect that the red part is affected by the contribution of the close neighbour (Section 3.1). We find that V528 Aql, HS Sge and GR Sgr have similar values and form the middle part of the distribution, while BS Sgr and V999 Sgr represent the lower and upper end, respectively. The picture in BS Sgr is rather unclear. The slope parameter suggests a comparatively low , which is supported by the strengths of the emission lines, although one has to take into account that there is a significant contribution of Heii to the hydrogen lines. On the other hand, the small eruption amplitude indicates a bright source in the system, and this is usually interpreted as the presence of a bright accretion disc. Both maximum and minimum brightness seem to be known with sufficient precision so that there is no reason to suspect a significantly larger . We will come back to this system below.
As has already been mentioned, the steep slope of the SED in V999 Sgr points to an overcorrection of the interstellar extinction. This is supported by a comparison with GR Sgr, which has otherwise very similar parameters , FWHM, and likely even , since the estimate of (Duerbeck, 1987) for (see Section 3.5) suggests an eruption amplitude for GR Sgr of 9 mag. As evidenced by the small and , with the blue Balmer emission lines being in absorption troughs, GR Sgr and V999 Sgr are clearly still driving a very high , while V528 Aql and HS Sge are operating at a lower . Remarkably, the former two systems are considerably ‘older’ than the latter two, and with respect to the hibernation scenario (Prialnik & Shara, 1986; Shara et al., 1986) one would expect the opposite (Kovetz, Prialnik, & Shara, 1988).
In three of the novae, V999 Sgr, HS Sge and BS Sgr we detect the Heii 5412 emission line, which can be taken as evidence for the presence of a magnetic white dwarf. In BS Sgr additionally all other Heii corresponding to the transition to the third excitement level can also be identified, indicating that the magnetic field in this post-nova is particularly strong. However, the eruption amplitude is comparatively small (e.g. fig.5.4 in Warner, 1995), indicating the presence of an accretion disc, and thus making it a good candidate for an intermediate polar. In fact, the spectral characteristics are similar to systems like DQ Her and BT Mon (Williams, 1983), the latter of which also appears to show the same type of decline light curve as BS Sgr (Strope et al., 2010). The small FWHM indicates a comparatively low system inclination, which also agrees well with the small eruption amplitude.
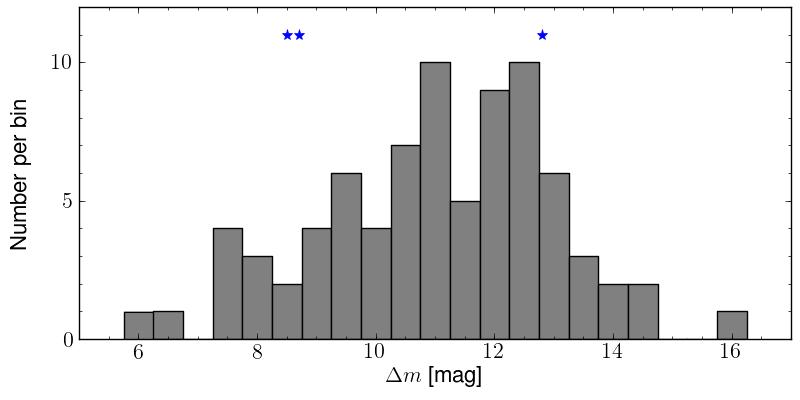
Our discussion above has assumed that the objects recovered by us are indeed post-novae, i.e. that they correspond to the reported nova eruptions. However, in principle they could also be other CVs that are simply close to the position of the nova. This concerns in particular the three objects HS Sge, BS Sgr and V999 Sgr, that were selected via their colour. Still, the space density of CVs is comparatively small. The highest theoretical estimates are based on models of CV birthrates and are of the order of (de Kool, 1992; Kolb, 1993), while observations still show at most a tenth of that value (see the summary by Pretorius, 2014). Furthermore, all three objects appear to belong to the high- CVs, which represent 1% of the intrinsic CV population (Kolb, 1993). It thus appears rather unlikely that such a CV would be found in the immediate (5 arcsec) neighbourhood of a nova eruption and not be the post-nova. A proper calculation of the respective probability would have to include a model of the Galactic disc structure and take into account interstellar extinction (that has already turned out to be problematic even for our rough analysis), and is beyond the scope of this paper. We can, however, estimate the probability to recover the original nova in our data. To this purpose we define the limiting magnitude of our photometry using the 5 criterion, and thus as the faintest star that has been measured with a signal-to-noise ratio S/N = 5, translating to a magnitude uncertainty of 0.198 mag. The resulting limits are 22.4, 23.8 and 22.6 mag, for the photometries of HS Sge, BS Sgr and V999 Sgr, respectively. Taking the reported maximum brightness for those objects we would thus have detected novae with eruption amplitudes of 15.7, 13.8 and 14.4 mag in above sequence. In Fig. 7 we show the distribution of the eruption amplitudes for all novae that erupted before 1986. This limit was chosen to ensure that the contribution of the shell to the optical brightness is negligible. We need to emphasize at this point that is calculated as the difference between the maximum brightness during eruption and the quiescence brightness of the post-nova. This is important since the latter can be considerably different from the brightness of the pre-nova (Schaefer & Collazzi, 2010). The data for Fig. 7 have been taken mainly from Downes et al. (2005) and Strope et al. (2010). In a few cases their quiescent brightnesses differ significantly (0.5 mag) from data published elsewhere and wherever we felt that the latter were more convincing we used those. Specifically, this concerns V446 Her (Honeycutt, Robertson, & Kafka, 2011), V849 Oph (Shafter, Misselt, & Veal, 1993) and CP Pup (Patterson & Warner, 1998). Additionally, we used the data from Paper I–IV for the respective objects. The total number of novae in this distribution amounts to 80. In this way we find that 79 objects, and thus 98.75 per cent, have mag. Consequently, the probability to detect the post-nova HS Sge with the respective photometric data is 99 per cent. The corresponding values for BS Sgr and V999 Sgr are 94 per cent (75 novae with mag) and 97.5 per cent (78 novae with mag), respectively. Note that this does not take into account the possibility that a post-nova could have atypical colours, and thus, while actually being present in the photometric data would not have been recognized as a CV. Still, in each case the photometry would have detected a typical post-nova with a high probability. Taking into account the low space density of CVs, we thus are confident that the CVs detected here indeed represent the post-novae.
5 Summary
-
1.
We have confirmed the five post-nova systems V528 Aql, HS Sge, BS Sgr, GR Sgr and V999 Sgr spectroscopically. For the three fields of V1301 Aql, V1151 Sgr and V3964 Sgr, we have identified likely candidates for the post-novae.
-
2.
V528 Aql has the appearance of a non-magnetic CV with a comparatively medium high mass-transfer rate. The emission lines seem sufficiently strong and broad to suggest follow-up time-resolved spectroscopic data to determine the orbital period. Such observations will have to take into account that the post-nova has a close visual neighbour and thus will need good seeing conditions.
-
3.
For HS Sge, we find that the H emission line likely still includes some contribution from the ejected material. The spectrum furthermore contains comparatively strong Heii emission, which might indicate the presence of a magnetic white dwarf. While the object is faint, the width of the emission line is such that it indicates a medium to high system inclination. This is thus an attractive target for time series photometry since the light curve is likely to show orbital features.
-
4.
The spectrum of BS Sgr presents a large number of Heii emission lines, making it a good candidate for a magnetic CV. Since the small eruption amplitude indicates the presence of a comparatively bright accretion disc, it appears that BS Sgr is an intermediate polar. The emission lines are narrow, but still appear to show radial velocity variations even at our low spectral resolution. This makes them unlikely to originate in a disc, and perhaps points to a location on the potentially irradiated secondary star. Nevertheless, while the lines in BS Sgr are narrow, they are also strong, and with a quiescent brightness of 17.9 mag time series spectroscopy should be feasible with a telescope of the 4 m class.
-
5.
Finally, both GR Sgr and V999 Sgr are very obviously post-novae that still drive a very high . The few discernible emission lines are both weak and narrow, and thus any attempt to derive the orbital period will need high S/N, high spectral resolution data. While both objects are comparatively bright, this still might require one of the larger telescopes.
-
6.
It is curious that two of the ‘oldest’ novae in our sample, GR Sgr and V999 Sgr, appear to have the highest mass-transfer rates, contrary to what one would expect from models of nova evolution. Still, in a sample as small as the present, this easily can be due to individual particularities, and not necessarily reflect a general tendency. A study of a much larger sample will be necessary to properly address this point.
Acknowledgements
We thank the referee for helpful comments.
We are indebted to the Gemini and ESO astronomers who performed the service observations.
This research was supported by FONDECYT Regular grant 1120338 (CT and NV). AE acknowledges support by the Spanish Plan Nacional de Astrononomía y Astrofísica under grant AYA2011-29517-C03-01.
We gratefully acknowledge ample use of the SIMBAD data base, operated at CDS, Strasbourg, France, and of NASA’s Astrophysics Data System Bibliographic Services. iraf is distributed by the National Optical Astronomy Observatories.
The Guide Star Catalogue-II is a joint project of the Space Telescope Science Institute and the Osservatorio Astronomico di Torino. Space Telescope Science Institute is operated by the Association of Universities for Research in Astronomy, for the National Aeronautics and Space Administration under contract NAS5-26555. The participation of the Osservatorio Astronomico di Torino is supported by the Italian Council for Research in Astronomy. Additional support is provided by European Southern Observatory, Space Telescope European Coordinating Facility, the International GEMINI project and the European Space Agency Astrophysics Division.
Gemini Observatory is operated by the Association of Universities for Research in Astronomy, Inc., under a cooperative agreement with the NSF on behalf of the Gemini partnership: the National Science Foundation (United States), the National Research Council (Canada), CONICYT (Chile), the Australian Research Council (Australia), Ministério da Ciência, Tecnologia e Inovação (Brazil) and Ministerio de Ciencia, Tecnología e Innovación Productiva (Argentina).
All data handling and text processing were done on opensuse and ubuntu linux operating systems.
References
- Anupama (2013) Anupama G. C., 2013, in Di Stefano R., Orio M., Moe M., eds., Proc. IAU Symp. 281, Binary Paths to Type Ia Supernovae Explosions, Cambridge Univ. Press, Cambridge, p.154
- Appenzeller et al. (1998) Appenzeller I. et al., 1998, The Messenger, 94, 1
- Bianchini et al. (1992) Bianchini A., Friedjung M., Brinkmann W., 1992, A&A, 257, 599
- Bode & Evans (2012) Bode M. F., Evans A., 2012, Classical Novae, Cambridge Univ. Press, Cambridge
- Bruch & Engel (1994) Bruch A., Engel A., 1994, A&AS, 104, 79
- Cannon (1923) Cannon A. J., 1923, Harv. Coll. Obs. Bull., 782, 1
- Cardelli et al. (1989) Cardelli J. A., Clayton G. C., Mathis J. S., 1989, ApJ, 345, 245
- Darnley et al. (2014) Darnley M. J., Williams S. C., Bode M. F, Henze M., Ness J.-U., Shafter A. W., Hornoch K., Votruba V., 2014, A&A, 563, L9
- de Kool (1992) de Kool, M., 1992, A&A, 261, 188
- Downes et al. (2005) Downes R. A., Webbink R. F., Shara M. M., Ritter H., Kolb U., Duerbeck H. W., 2005, J Astron. Data, 11, 2
- Duerbeck (1987) Duerbeck H. W., 1987, Space Sci. Rev., 45, 1
- Duerbeck & Seitter (1987) Duerbeck H. W., Seitter W. C., 1987, Ap&SS, 131, 467
- Frank et al. (2002) Frank J., King A., Raine D. J., 2002, Accretion Power in Astrophysics, 3rd edn., Cambridge Univ. Press, Cambridge
- Hellier (2001) Hellier C., 2001, Cataclysmic Variable Stars, Springer, Berlin
- Hoard et al. (2002) Hoard D. W., Wachter S., Clark L. L., Bowers T. P., 2002, ApJ, 565, 511
- Honeycutt et al. (2011) Honeycutt R. K., Robertson J. W., Kafka, S., 2011, AJ, 141, 121
- Hook et al. (2004) Hook I. M., Jørgensen I., Allington-Smith J. R., Davies R. L., Metcalfe N., Murowinski R. G., Crampton D., 2004, PASP, 116, 425
- Howarth (1976) Howarth I. D., 1976, Z. Astrophys. Sternwarte Sonneberg Mitt. Veraenderliche Sterne, 7, 110
- Huth (1976) Huth H., 1976, Inf. Bull. Var. Stars, 1205, 1
- Innes (1917) Innes R. T. A., 1917, Circ. Union Obs. Johannesburg, 37, 300
- Jacoby et al. (1984) Jacoby G. H., Hunter D. A., Christian C. A., 1984, ApJS, 56, 257
- Kolb (1993) Kolb, U., 1993, A&A, 271, 149
- Kovetz et al. (1988) Kovetz A., Prialnik D., Shara M. M., 1988, ApJ, 325, 828
- Landolt (1983) Landolt A. U., 1983, AJ, 88, 439
- Landolt (1992) Landolt A. U., 1992, AJ, 104, 340
- Lasker et al. (2008) Lasker B. M. et al., 2008, AJ, 136, 735
- Lundström & Stenholm (1976) Lundström I., Stenholm B., 1976, IAU Circ., 2997, 2
- Lundström & Stenholm (1977) Lundström I., Stenholm B., 1977, Inf. Bull. Var. Stars, 1351, 1
- Mayall (1949) Mayall M. W., 1949, AJ, 54, 191
- Milbourn et al. (1977) Milbourn S. W., Hosty J. G., Hurst G. M., 1977, IAU Circ., 3025, 1
- Pagnotta & Schaefer (2014) Pagnotta A., Schaefer B. E., 2014, ApJ, 788, 164
- Patterson (1984) Patterson J., 1984, ApJS, 54, 443
- Patterson & Warner (1998) Patterson J., Warner B., 1998, PASP, 110, 1132
- Patterson et al. (1981) Patterson J., McGraw J. T., Coleman L., Africano J. L., 1981, ApJ, 248, 1067
- Pesch et al. (1975) Pesch P., Sanduleak N., Chen P., 1975, IAU Circ., 2835, 2
- Pickering (1910) Pickering E. C., 1910, Astron. Nachr., 186, 125
- Pickles (1985) Pickles A. J., 1985, ApJS, 59, 33
- Pretorius (2014) Pretorius M., 2014, in The X-ray Universe 2014, Ness J.-U., ed., id. 164, arxiv 1407.3149
- Prialnik & Shara (1986) Prialnik D., Shara M. M., 1986, ApJ, 311, 172
- Retter et al. (1998) Retter A., Leibowitz E. M., Kovo-Kariti O., 1998, MNRAS, 293, 145
- Ringwald et al. (1996) Ringwald F. A., Naylor T., Mukai K., 1996, MNRAS, 281, 192
- Saito et al. (2012) Saito R. K. et al., 2012, A&A, 537, A107
- Saito et al. (2013) Saito R. K. et al., 2013, A&A, 554, A123
- Schaefer (2010) Schaefer, B. E., 2010, ApJS, 187, 275
- Schaefer & Collazzi (2010) Schaefer, B. E., Collazzi, A. C., 2010, AJ, 139, 1831
- Schlafly & Finkbeiner (2011) Schlafly E. F., Finkbeiner D. P., 2011, ApJ, 737, 103
- Shafter et al. (1993) Shafter A. W., Misselt K. A., Veal J. M., 1993, PASP, 105, 853
- Shara et al. (1986) Shara M. M., Livio M., Moffat A. F. J., Orio M., 1986, ApJ, 311, 163
- Shara et al. (2012) Shara M. M., Mizusawa T., Zurek D., Martin C. D., Neill J. D., Seibert M., 2012, ApJ, 756, 107
- Silva & Cornell (1992) Silva D. R., Cornell M. E., 1992, ApJS, 81, 865
- Stetson (1992) Stetson P. B., 1992, in Astronomical Society of the Pacific Conference Series, Vol. 25, Astronomical Data Analysis Software and Systems I, Worrall D. M., Biemesderfer C., Barnes J., eds., p. 297
- Stetson (2000) Stetson P. B., 2000, PASP, 112, 925
- Strope et al. (2010) Strope R. J., Schaefer B. E., Henden A. A., 2010, AJ, 140, 34
- Swope (1940) Swope H. H., 1940, Harvard College Observatory Bulletin, 913, 11
- Szkody (1994) Szkody P., 1994, AJ, 108, 639
- Tang et al. (2014) Tang S., Bildsten L., Wolf W. M., Li K. L., Kong A. K. H., Cao Y., Cenko S. B., De Cia A., Kasliwal M. M., Kulkarni S. R., Laher R. R., Masci F., Nugent P. E., Perley D. A., Prince T. A., Surace J., 2014, ApJ, 786, 61
- Tappert et al. (2012) Tappert C., Ederoclite A., Mennickent R. E., Schmidtobreick L., Vogt N., 2012, MNRAS, 423, 2476 (Paper I)
- Tappert et al. (2013a) Tappert C., Vogt N., Schmidtobreick L., Ederoclite A., Vanderbeke J., 2013a, MNRAS, 431, 92 (Paper II)
- Tappert et al. (2013b) Tappert C., Schmidtobreick L., Vogt N., Ederoclite A., 2013b, MNRAS, 436, 2412 (Paper III)
- Tappert et al. (2014) Tappert C., Vogt N., Della Valle M., Schmidtobreick L., Ederoclite A., 2014, MNRAS, 442, 565 (Paper IV)
- Townsley & Bildsten (2005) Townsley D. M., Bildsten L., 2005, ApJ, 628, 395
- Vogt (1982) Vogt N., 1982, Mitteilungen der Astronomischen Gesellschaft Hamburg, 57, 79
- Vrba et al. (1977) Vrba F. J., Schmidt G. D., Burke, Jr. E. W., 1977, ApJ, 211, 480
- Warner (1995) Warner B., 1995, Cataclysmic variable stars. Cambridge Astrophysics Series, Cambridge, New York: Cambridge University Press
- Woudt & Ribeiro (2014) Woudt, P. A., Ribeiro, V. A. R. M., 2014, Stella Novae: Past and Future Decades. Astronomical Society of the Pacific Conference Series, Vol. 490
- Wheeler (2012) Wheeler J. C., 2012, ApJ, 758, 123
- Wild (1975) Wild P., 1975, IAU Circ., 2788, 1
- Williams (1983) Williams G., 1983, ApJS, 53, 523
- Woods (1927) Woods I. E., 1927, Harvard College Observatory Bulletin, 851, 2
- Zacharias et al. (2010) Zacharias N. et al., 2010, AJ, 139, 2184
- Zacharias et al. (2013) Zacharias N., Finch C. T., Girard T. M., Henden A., Bartlett J. L., Monet D. G., Zacharias M. I., 2013, AJ, 145, 44
- Zorotovic et al. (2011) Zorotovic M., Schreiber M. R., Gänsicke B. T., 2011, A&A, 536, A42
Appendix A Finding charts
We present the finding charts for the novae with previously ambiguous or unknown positions.