Synchrotron spectral index and interstellar medium densities of star-forming galaxies
Abstract
The spectral index of synchrotron emission is an important parameter in understanding the properties of cosmic ray electrons (CREs) and the interstellar medium (ISM). We determine the synchrotron spectral index () of four nearby star-forming galaxies, namely NGC 4736, NGC 5055, NGC 5236 and NGC 6946 at sub-kpc linear scales. The was determined between 0.33 and 1.4 GHz for all the galaxies. We find the spectral index to be flatter () in regions with total neutral (atomic + molecular) gas surface density, , typically in the arms and inner parts of the galaxies. In regions with , especially in the interarm and outer regions of the galaxies, the spectral index steepens sharply to . The flattening of is unlikely to be caused due to thermal free–free absorption at 0.33 GHz. Our result is consistent with the scenario where the CREs emitting at frequencies below GHz are dominated by bremsstrahlung and/or ionization losses. For denser medium (), having strong magnetic fields (G), is seen to be flatter than , perhaps caused due to ionization losses. We find that, due to the clumpy nature of the ISM, such dense regions cover only a small fraction of the galaxy ( percent). Thus, the galaxy-integrated spectrum may not show indication of such loss mechanisms and remain a power-law over a wide range of radio frequencies (between to 10 GHz).
keywords:
galaxies : ISM – (ISM:) cosmic rays – ISM : magnetic fields – galaxies: ISM – radiation mechanisms : non-thermal – radio continuum : galaxies1 Introduction
The synchrotron spectral index of the cosmic ray electrons (CREs) in normal star-forming galaxies is an important parameter in understanding their energy loss/gain mechanisms in the interstellar medium (ISM). Studying spatially resolved properties of the synchrotron (also referred to as non-thermal) spectral index111Spectral index, , is defined as: , where is the radio continuum flux density at a frequency . () can throw meaningful insights into the properties of the ISM and thereby understand the nature of multi waveband emission from galaxies.
It is believed that the CREs are produced by diffusive shock acceleration (DSA) of thermal electrons up to energies of few PeV in shock fronts of supernova remnants (Bell 2004; Jones 2011; Edmon et al. 2011; Kang, Edmon & Jones 2012). The CREs are injected into the ISM with a power-law energy spectrum , where, is the number density of CREs with energies in the range and . The energy spectral index, , of CREs is related to as and can be measured directly from observations. Depending on the CR acceleration mechanism and efficiency, is estimated to lie in the range and (Biermann & Strom 1993; Bogdan & Völk 1983; Blandford & Eichler 1987; Bell 1978), which corresponds to in the range and .
The CREs that are injected into the ISM are subjected to energy dependent losses and hence is expected to be modified smoothly over a frequency range. The main energy loss mechanisms involving ionization losses, relativistic bremsstrahlung losses, synchrotron and inverse-Compton losses alter the radio frequency spectrum in a specific way. These loss mechanisms have different dependence on CRE energy (see Longair 2011) and thus they are important in different parts of the spectrum. Ionization and relativistic bremsstrahlung losses typically affect CREs having energies GeV while synchrotron and inverse-Compton losses affect CREs having energies GeV. These energies correspond to GHz and GHz, respectively, for typical magnetic fields of G.
At higher radio frequencies, synchrotron and inverse-Compton losses lead to a cut-off in the spectrum. However, the form of this cut-off depends on the pitch angle between the magnetic field and CREs and the process of particle injection. In the case of steady continuous injection (CI) of CREs, the spectrum steepens by 0.5, i.e., () (Pacholczyk 1970). For injection of particles at a single epoch and considering constant pitch angles of individual electrons, according to the Kardashev-Pacholczyk model (KP; Kardashev 1962; Pacholczyk 1970) the spectrum falls off as a power-law with index , i.e., . Here, is the initial power-law index of the particles. The Jaffe-Perola model (JP; Jaffe & Perola 1973) assumes rapid isotropization of the pitch angle distribution leading to an exponential cut-off in the CRE spectrum. Further, energy dependent diffusion losses can also steepen the spectrum by 0.25, i.e., (Condon 1992). However, such losses would affect the CREs having high energies ( GeV).
On the other hand, at low radio frequencies, the ionization losses have the effect of flattening . Under steady continuous injection of electrons, the equilibrium spectra is flatter by 0.5, i.e., . For single injection events, the resulting spectrum will depend on the ratio of timescales of injection and ionization loss. Bremsstrahlung losses mildly affects the CRE spectrum and therefore does not alter significantly () (see Longair 2011), both in the case of continuous and single injection. Thus comparing the value of the observed with respect to the typical injection values of to one can broadly get an idea of the dominant CRE energy loss mechanism. Further, due to thermal free–free absorption, the synchrotron spectrum is expected to turn over at even lower frequencies below GHz. These have a combined effect of modifying the initial power-law spectrum into a curved spectrum with flatter slope at low frequencies ( GHz) and steeper slope at high frequencies ( GHz).
The radio continuum emission from galaxies broadly originates due to two main emission mechanisms – 1) synchrotron emission and 2) thermal bremsstrahlung emission. Synchrotron emission contributes more than percent to the total radio emission at low frequencies ( GHz) (Niklas, Klein & Wielebinski 1997; Basu et al. 2012). Contribution from thermal emission to the total radio emission is significant at higher frequencies. For example, at 10 GHz, percent of the total emission is thermal in origin (Gioia, Gregorini & Klein 1982). The thermal emission is also characterized by a power-law spectrum having thermal spectral index and is significantly flatter than that of the . The composition of these two types of emission gives rise to an overall power-law spectrum () which is flatter than . The presence of thermal emission makes it difficult to interpret energy spectra of the CREs and therefore it is necessary to subtract its contribution from the total emission. Note that, in this paper we distinguish and as the spectral index of the total radio and synchrotron emission, respectively.
A host of radio continuum surveys has been undertaken in the past to study the broadband integrated spectra of galaxies and understand the various energy loss mechanisms. Surprisingly, most of the studies showed a power-law spectrum over broad range of frequencies. The power-law slope is found to be similar, having a value with narrow dispersion, typically less than percent. The power-law index, between 1.4 and 5 GHz was found to be (Sramek 1975); between 0.4 and 10.7 GHz, was found to be (Klein & Emerson 1981) and (Gioia et al. 1982). Based on broadband fitting of the radio continuum spectrum between 0.6 to 10 GHz for 41 spiral galaxies, Duric, Bourneuf & Gregory (1988) found to peak at . In a similar study of 74 Shapely-Ames galaxies between 0.4 and 10.7 GHz, Niklas et al. (1997) found the mean value of to be . In fact, for a much wider range of radio frequencies, between 26.3 MHz and 22.8 GHz, Mulcahy et al. (2014) did not find any evidence of curvature in the radio continuum spectrum for the galaxy M51. The spectrum is consistent with a single power-law with .
Recently, Marvil, Owen & Eilek (2014), in a statistical study of 250 galaxies, found evidence of curved radio continuum spectra between 74 MHz and 4.85 GHz. However, there is no strong evidence of spectral curvature when studied for integrated flux densities of individual galaxies except for a few cases, such as M82 (Condon 1992; Adebahr et al. 2013), NGC 4631 (Pohl & Schlickeiser 1990), NGC 3627 and NGC 7331 (Paladino, Murgia & Orrú 2009), etc. At much lower frequencies of 57.5 MHz, Israel & Mahoney (1990) found evidence of systematically lower flux densities when compared to extrapolated flux densities from higher frequencies assuming a single power-law. They concluded that smoothly distributed diffuse ionized gas throughout the galaxies is unlikely to cause thermal free–free absorption and requires more clumpy medium of well-mixed non-thermal emitting and thermally absorbing gas.
| Name | Type | Angular | Distance | CO | Hi | Radio | |
|---|---|---|---|---|---|---|---|
| size (D25)(′) | (∘) | (Mpc) | (1.4 GHz) | ||||
| (1) | (2) | (3) | (4) | (5) | (6) | (7) | (8) |
| NGC 4736 | SAab | 11.29.1 | 41 | 4.661 | HERACLES | THINGS | Westerborkb SINGS4 |
| NGC 5055 | SAbc | 12.67.2 | 59 | 9.2† | HERACLES | THINGS | Westerbork SINGS4 |
| NGC 5236 | SABc | 11.211 | 24 | 4.512 | NRAO 12 m | THINGS | VLAa CD array5 |
| NGC 6946 | SABcd | 11.59.8 | 33 | 6.83 | HERACLES | THINGS | VLA C+D array6 |
Column 3 lists the optical diameter measured at the 25 magnitude arcsec-2
contour. The inclination angles (; is face-on) are listed in
Column 4. Distances in column 5 are taken from: 1 Karachentsev et al. (2003), 2
Karachentsev et al. (2002), 3 Karachentsev, Sharina & Huchtmeier (2000) and the NED †. Columns 6 and 7
list the data used to trace the molecular and atomic gas, respectively. Column
8 lists the sources of archival data at 1.4 GHz: 4 Braun et al. (2007), 5 VLA
archival data using CD array (project code: AS325), 6 VLA map obtained by
combining archival data from C and D array (Beck 2007).
a The Very
Large Array (VLA) is operated by the NRAO. The NRAO is a facility of the
National Science Foundation operated under cooperative agreement by Associated
Universities, Inc.
b The Westerbork Synthesis Radio Telescope (WSRT) is
operated by the Netherlands Foundation for Research in Astronomy (NFRA) with
financial support from the Netherlands Organization for scientific research
(NWO).
Although the global spectral index, for both total and non-thermal emission, of galaxies does not vary and is consistent with , locally they show large variations. The spectral index is observed to vary significantly radially, being flatter and close to the injection value ( to ) towards the central regions and steepens towards the outer parts ( to ) (Basu et al. 2012; Beck 2007; Tabatabaei et al. 2007; Paladino et al. 2009). The various CR energy loss mechanisms depend on local physical parameters of the ISM such as the magnetic field strength, the number density of neutral gas, energy density of the photon field, shocked regions, etc. Moreover, the magnetic field strengths and gas density are believed to be coupled due to magnetohydrodynamic turbulence in the ISM (Chandrasekhar & Fermi 1953; Cho & Vishniac 2000; Groves et al. 2003). Further, injection rate of CR particles depends on the star formation rate which is related to the gas density through the Kennicutt-Schmidt law (Kennicutt 1998). Local ISM densities can therefore, directly or indirectly shape up the spectral index differently giving rise to large variations. It is therefore imperative to study the spatially resolved non-thermal spectral index and compare it to the local ISM gas densities. In this paper we qualitatively discuss the effects of gas surface densities on the non-thermal spectral index and the most likely scenario of CR energy loss prevalent in spatially resolved galaxies.
The paper is organized as follows: In Section 2 we present the various source of the data used. The galaxies studied are NGC 4736, NGC 5055, NGC 5236 and NGC 6946. We present our results in Section 3 and discuss them in Section 4. The conclusions based on this work are summarized in Section 5.
| Name | 0.33-GHz | 1.4-GHz | Hi | CO | Linear | |
|---|---|---|---|---|---|---|
| maps | scale (kpc) | |||||
| NGC 4736 | 1312 | 1912.5 | 10.29.1 | 13.413.4 | 2020 | 0.45 |
| NGC 5055 | 1710 | 18.512.5 | 10.18.7 | 13.413.4 | 2020 | 0.90 |
| NGC 5236 | 1612 | 2614 | 15.211.4 | 5555 | 2614 | 0.55 |
| NGC 6946 | 1211 | 1515 | 65.6 | 13.413.4 | 1515 | 0.50 |
2 Data and analysis
In this work we study four nearby galaxies, namely, NGC 4736, NGC 5055, NGC 5236 and NGC 6946. The galaxies are chosen from Basu et al. (2012) and were observed using the Giant Metrewave Radio Telescope (GMRT) at 0.33 GHz. To measure the spectral index, we used archival data at a higher radio frequency near 1.4 GHz. Table 1 lists the salient features of the sample and the sources of the archival data. As pointed out earlier, the radio continuum emission originates from both synchrotron emission and thermal free–free emission. Owing to the steep spectral index, , the synchrotron emission is expected to dominate over the thermal emission, especially at lower ( GHz) radio frequencies. However, due to high star-formation activity and/or certain bright Hii regions in galaxies, the contribution of the thermal emission can be significant locally (Basu et al. 2012). The contamination due to the thermal component of the radio emission, which has significantly flatter spectral index of , affects the synchrotron spectral index, making it flatter than actual by more than 30 percent (see Figure 6 of Basu et al. 2012). This necessitates a thorough separation of the thermal emission from the total radio emission for robust determination of .
We used the recent method of estimating the thermal component of the radio emission given in Basu & Roy (2013). The thermal emission is determined by combining H and m emission from galaxies as its tracer. This method allows us to probe the non-thermal emission from galaxies at linear scales of 0.4–1 kpc, depending on the distance of the galaxies. Table 2 lists the angular resolution of the available maps. The overall thermal fraction222Thermal fraction () at a radio frequency is defined as: . Here, and are the estimated thermal emission and the total radio emission, respectively. at 0.33 GHz () was found to be less than 5 percent while at 1.4 GHz () it is found to be percent (Basu & Roy 2013; Basu et al. 2012). However, locally, and are as high as 15 percent and 30 percent, respectively.
 |
 |
 |
 |
To estimate the surface mass density of total neutral gas () in the galaxies, we used Hi and CO line emission as tracers of the neutral atomic and molecular gas components, respectively. We used the natural-weighted Hi moment-0 maps from the Hi Nearby Galaxy Survey (THINGS; Walter et al. 2008) to trace the atomic gas for all our sample galaxies. The galaxies were observed with high angular resolution of arcsec (see Table 2) and velocity resolution km s-1 using the VLA. We used CO(J21) emission from the galaxies, NGC 4736, NGC 5055 and NGC 6946 as a tracer of the molecular gas in the ISM. We used the CO(J21) moment-0 maps from the HERA CO Line Extragalactic Survey (HERACLES; Leroy et al. 2009). The galaxies were observed with an angular resolution of arcsec and velocity resolution of 2.6 km s-1 using the IRAM 30-m telescope. For NGC 5236, we used CO(J10) line emission as the tracer of molecular gas observed with the NRAO 12-m telescope (Crosthwaite et al. 2002). The CO(J10) moment-0 map has an angular resolution of 55 arcsec and velocity resolution of 5.2 km s-1.
We computed total neutral gas surface mass density maps on a pixel-by-pixel basis using the surface mass density maps of atomic () and molecular gas () as, . The 1.36 factor is to account for the presence of Helium. The Hi gas surface mass density was estimated using,
| (1) |
Here, is the inclination of the galaxy, defined such that is face-on and is the line-integrated intensity.
Similarly, the CO(J21) line-integrated intensity, , of the HERACLES maps were converted to the molecular gas surface mass density using,
| (2) |
This assumes a constant CO-to-H2 conversion factor, for the CO(J10) transition and a line ratio, . The line-integrated flux density, , of the CO(J10) moment-0 NRAO 12-m map for the galaxy NGC 5236 was converted to molecular gas mass, (Young et al. 1989),
| (3) |
Here, is the distance to the galaxy in Mpc. The molecular gas mass was converted to by . Here, and are the pixel sizes of the map expressed in pc at the distance of the galaxy.
 |
 |
 |
 |
3 Results
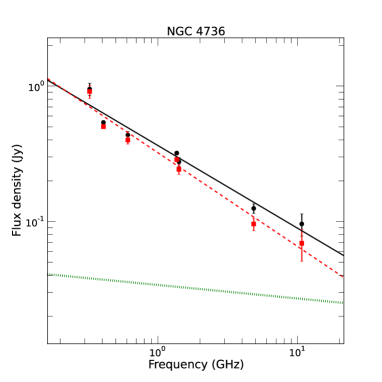
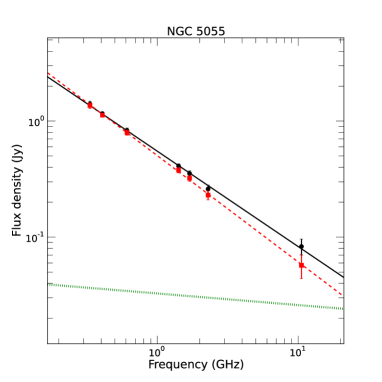
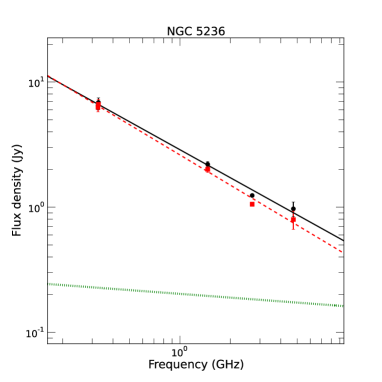
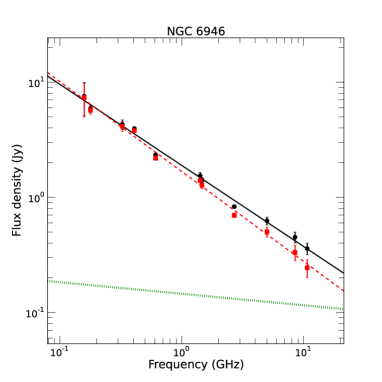
Figure 1 shows the galaxy integrated radio continuum spectrum for the four galaxies between 0.33 and 10.7 GHz. The black dots represent the total observed flux densities obtained from various sources in the literature (see Table 3 of Basu et al. 2012). The higher frequency ( GHz) data points were mostly measured using single dish observations and hence, do not suffer from missing flux issues. The broad-band spectrum was fitted using 2 types of models in space: 1) a single power-law and 2) a second order polynomial that could account for any curvature in the spectrum, if present. The single power-law has the form, . The second order polynomial has the form, . Here, , and are the fitting parameters.
For all the galaxies, the best fit model is well represented by a single power-law shown as the solid black lines in Figure 1. The power-law index, , is found to be , , and for the galaxies NGC 4736, NGC 5055, NGC 5236 and NGC 6946, respectively. The red squares show the non-thermal flux densities estimated by subtracting the thermal emission (shown as the green dotted lines) at the respective frequencies. The non-thermal emission spectrum for all the four galaxies can also be well fitted by a power-law having index steeper than the total emission. The non-thermal power-law index, , is estimated to be , , , for the galaxies NGC 4736, NGC 5055, NGC 5236 and NGC 6946, respectively. Within the uncertainty of the measurements, we do not find any steepening of the overall spectrum towards higher frequencies ( GHz) as expected due to synchrotron and/or inverse-Compton losses. Towards, the lower frequencies ( GHz), we do not observe any flattening due to ionization losses and/or thermal free–free absorption. Our result is similar to what was observed for the galaxy M51 over a much wider range of frequencies (Mulcahy et al. 2014).
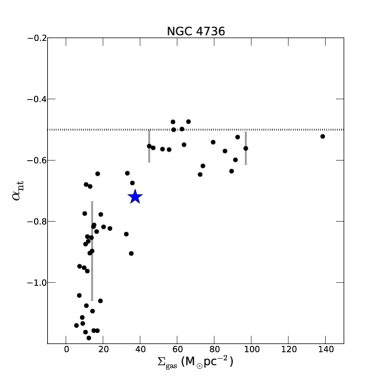
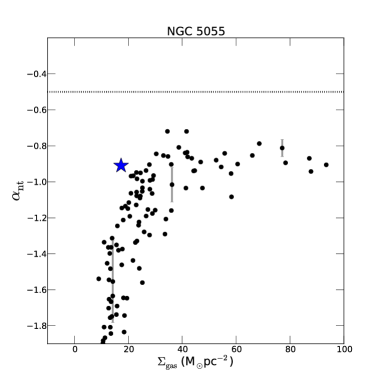
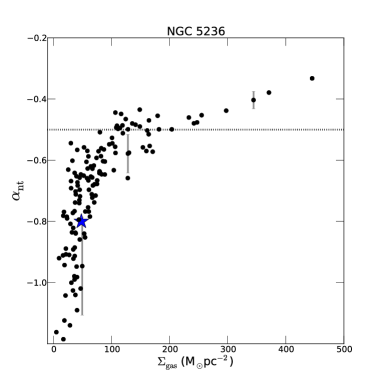
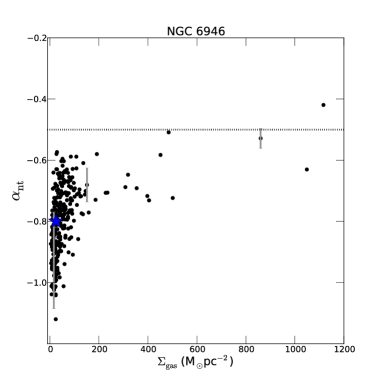
In Figure 2 we plot the variation of the with total surface density of the neutral (atomic+molecular) gas () for all the four galaxies. and is computed within one synthesized beam given in Table 2. To ensure independence, each point is measured, roughly separated by one synthesized beam. The was computed using the non-thermal maps between 0.33 and 1.4 GHz considering pixels having signal-to-noise ratio more than 3 at both the frequencies. Each beam corresponds to kpc in linear size depending on the distance of the galaxies (see Table 2). For the galaxy NGC 5236, due to poor resolution of the available CO map, the linear resolution was limited to kpc.
We find that in the arm regions, is flatter than that in the interarm regions. This was already indicated in Basu et al. (2012) and Tabatabaei et al. (2007). There appears to be a sharp transition of spectral index above and below . We find the spectral index to remain constant or get flatter with increasing above . There is a sharp steepening of the spectral index below , typically in outer parts and interarm regions. We find close to the injection value of for regions having in the range . At even denser regions, we see the to be flatter than for the galaxy NGC 5236.
The error on depends on the signal-to-noise ratio (S/N) of the flux densities within each synthesized beam at each radio frequency. The regions of high gas density () are also typically the regions with strong radio emission with S/N . Such regions have percent error in the . While the low gas density regions () with radio flux density S/N , have up to 20 percent error. Additional error on the estimated value of is incurred due to uncertainties in the estimated thermal emission. This is primarily due to the unknown value of the electron temperate (), assumed to be K, while estimating the thermal emission (see Tabatabaei et al. 2007). As a result, the uncertainty in the thermal fraction () is and percent at 0.33 and 1.4 GHz, respectively (Tabatabaei et al. 2007; Basu et al. 2012). This introduces an error of percent on the . However, note that the uncertainty in affects only towards the inner parts of the galaxies where is high (Basu et al. 2012). The in the outer parts are not affected due to low thermal emission. Overall, the estimated have maximum error of percent towards the inner parts of the galaxies, i.e., regions of higher and up to percent in the outer parts, i.e., regions of lower . We show representative errors on for some of the points covering the span of for each galaxy in Figure 2.
We checked the possibility of free–free absorption of the synchrotron emission by thermal electrons giving rise to the observed flattening at lower frequencies. The observed flux density can be expressed as . is the free–free optical depth at a radio frequency and is given by,
| (4) |
Here, is the temperature of the thermal electrons assumed to be K and is the emission measure. The emission measure for our sample galaxies are in the range of few 100s (in the disk and outer parts of the galaxies) to 10 (towards the center and Hii regions) (Basu et al. 2012). For this range of s, the is expected to become 1, below 0.1 GHz. At 0.33 GHz, for our sample galaxies lies in the range to few times . Moreover, for free–free absorption to affect at 0.33 GHz, is required. Regions with such extreme s are rare in galaxies except perhaps in the galactic centers (Roy & Rao 2004). The flattening of the radio continuum spectra at 0.33 GHz is therefore unlikely to be caused by free–free absorption.
4 Discussion
 |
 |
 |
 |
 |
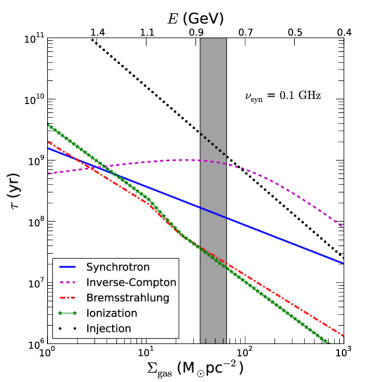
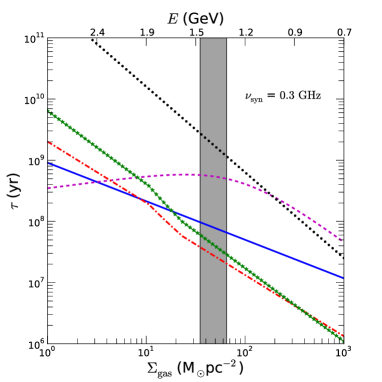
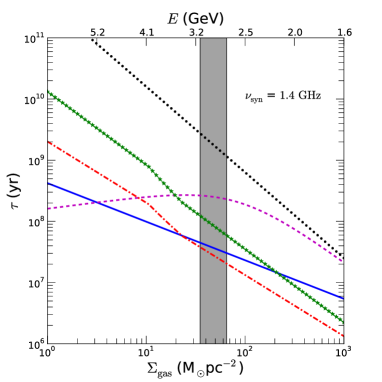
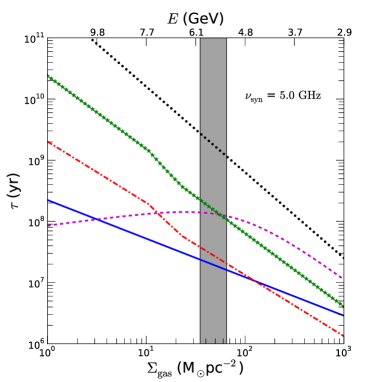
We have studied the variation of the non-thermal spectral index with the surface mass density of neutral gas for four spatially resolved nearby galaxies. Our results indicate that the local ISM gas density plays an important role in shaping up the local radio continuum spectral behavior. It is therefore difficult to interpret the observed galaxy-integrated power-law nature of the spectrum, as it averages the clumpy ISM. As pointed out earlier, after the CREs are injected into the ISM, they are subjected to diffusion and energy loss mechanisms that depend on the in-situ ISM density. Depending on the dominant loss process, the injection spectrum of the CREs changes differently. Synchrotron and inverse-Compton losses have the same effect of steepening the spectrum. The synchrotron timescale () for CREs emitting at a radio frequency and having energy is given by,
| (5) |
Here, is the magnetic field strength in the plane of the sky.
The timescale for inverse-Compton losses () due to scattering of CREs by radiation field in the galaxy with energy density and cosmic microwave background with energy density is given by,
| (6) |
Ionization losses flattens the spectrum towards lower radio frequencies and the timescale () is given by (Murphy 2009),
| (7) |
Here, is the average number density of neutral gas (atomic + molecular) as seen by the CREs.
Bremsstrahlung losses does not significantly change the spectrum and its timescale () is given by (Murphy 2009),
| (8) |
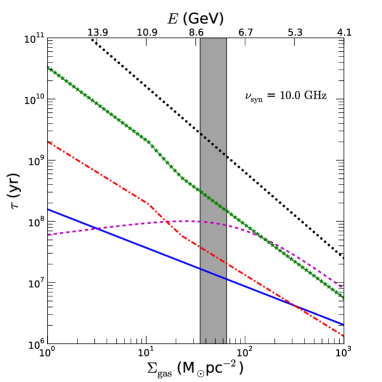
Since the ISM of a galaxy is not smooth in its physical properties, i.e., magnetic field strength and gas density, different losses will dominate in different parts of the galaxy. To compare the various energy loss scenarios we plot these energy loss timescales as a function of in Figure 3. As these loss timescales depend on the energy of the CRE and thereby the radio frequency, we show these timescales at 0.1, 0.3, 1.4, 5 and 10 GHz. Further, at a fixed frequency, the effective CR energy depends on the magnetic field. The top axis in Figure 3 shows the energy of the CREs. The magnetic field strength () can depend on as (Schleicher & Beck 2013). Using the normalization333Note that the normalizations in Schleicher & Beck (2013) are given in terms of the surface star-formation rate (). We converted to following Kennicutt (1998). given by Schleicher & Beck (2013), G. Further, for the inverse-Compton losses, we considered the to depend on as, , normalized in terms of the Milky Way (Schleicher & Beck 2013).
The average number density of total neutral (atomic+molecular) gas () was estimated from surface mass density (). Typically, the surface mass density of atomic gas as traced by Hi emission does not exceed for normal star-forming galaxies (see e.g., Leroy et al. 2008; Kalberla & Dedes 2008). We therefore assumed the regions with to be originating entirely from molecular gas as traced by CO. Such regions are typically found in the inner regions of the galaxies and in spiral arms. The regions with , were assumed to be originating from atomic Hi gas, typically found in interarm regions and outer parts of the galaxies. For regions having , we assumed a mixture of atomic and molecular gas such that Hi/(Hi+H2) varying linearly between 1 and 0.
The surface gas density is converted to mid-plane number density assuming a Milky Way type model for the vertical distribution of the atomic and molecular gas. We used a 3-component vertical distribution for the Hi, following Dickey & Lockman (1990) and a single component for H2, following Sanders, Solomon & Scoville (1984). The three Hi components are as follows: 1) a Gaussian component with FWHM of 212 pc ( pc) having mid-plane density of , 2) a second Gaussian component with FWHM of 530 pc ( pc) having mid-plane density of and 3) an exponential component with scale height () of 403 pc with mid-plane density (Dickey & Lockman 1990). The components have relative ratios, (Dickey & Lockman 1990). Thus, is modeled as,
| (9) |
Similarly, the mid-plane number density of H2 () is computed assuming a FWHM of 110 pc (Sanders et al. 1984) corresponding to pc. Thus, is given by,
| (10) |
The total mid-plane number density () is given by, . We assumed the average number density of neutral gas, , seen by the CREs to be half of .
|
4.1 CR injection
All the CR energy loss mechanisms would be relevant if the CR injection timescales were significantly larger. Otherwise, the loss mechanisms may not affect the radio continuum spectrum and one would observe the spectral index close to the injection value, . Under DSA, depends on the Mach number () as, (Blandford & Eichler 1987). For strong shocks, . We note that the Mach number depends on the sound speed and thereby the gas density () as . Thus, depending on the gas density, could be in the range to .
The black dotted lines in Figure 3 show the injection timescales of freshly generated CR particles estimated from the supernova rates. The stars that are end up in Type II and Type Ib supernova, and are responsible for acceleration of the CREs in normal galaxies (Condon 1992). Using the initial mass function (IMF) given by Kroupa (2001), we estimated the mass fraction () of stars that could form supernovae by integrating the IMF between 8 and 150 M⊙. Thus, for a surface mass star formation rate of , the mass rate of forming supernova stars is given by, . The mean surface supernova rate () is given by, . Here, is the mean supernova mass. In our case, is found to be 0.01. was estimated from using the Kennicutt-Schmidt law (Kennicutt 1998). From Figure 3 we find the local CR injection timescales to be larger than the loss timescales and hence, the freshly generated CREs do not contribute significantly to the observed synchrotron spectrum. Except for regions of high star-formation or recent starburst activity, an observed flatter spectral index of , close to the injection value, is unlikely to be caused by the fresh CREs.
4.2 Gas density and energy losses
From Figure 3 it is clear that ionization and bremsstrahlung losses dominate in regions of high gas density at lower radio frequencies ( GHz) where the synchrotron emitting CREs have less energy ( GeV). Inverse-Compton losses are mostly un-important within galaxies, except for very low density regions with magnetic field strength G. For regions with , and are lower than that of below GHz. Hence, such regions are expected to have flatter spectral index as is observed in Figure 2 (shown as shaded area in Figure 3). The regions with are perhaps contributed by dense molecular clouds having high densities and magnetic field strengths. In such regions, ionization losses can become significant at GHz, if the magnetic field strengths are high, giving rise to spectral index flatter than their injection value of . This is seen for the galaxy NGC 5236, where regions with are observed to have in the range to . Such regions have been observed to have relatively high magnetic field strengths (G; Basu & Roy 2013). Bremsstrahlung losses may, however, dominate significantly in moderately dense regions with at 1.4 GHz. Such regions do not affect and hence, we do not expect to observe flatter than when measured between radio frequencies above 1.4 GHz. For ionization losses to dominate over synchrotron losses at higher radio frequencies (between GHz), an extremely high surface gas density of is required. However, in such regions, the injection timescale of CREs is comparable to the loss timescales within a factor of .
Regions with , are observed to have steep (see Figure 2). From Figure 3, we find that such regions are dominated by synchrotron and/or inverse-Compton losses at 1.4 GHz and hence perhaps causes steepening of . However, note that the CRE injection timescale approaches few times yr in regions of even lower (), typically found in the interarm regions and outer parts of the galaxies. The CRE population in such regions are dominated by propagation from star-forming regions in adjacent arms. Depending on the propagation mechanism, i.e., simple diffusion or streaming instability at Alfvén velocity, the CREs at 0.33 GHz propagate 1.4 to 2 times longer distances than those at 1.4 GHz (see Basu & Roy 2013). This could also give rise to the observed steepening of between the two frequencies in such regions.
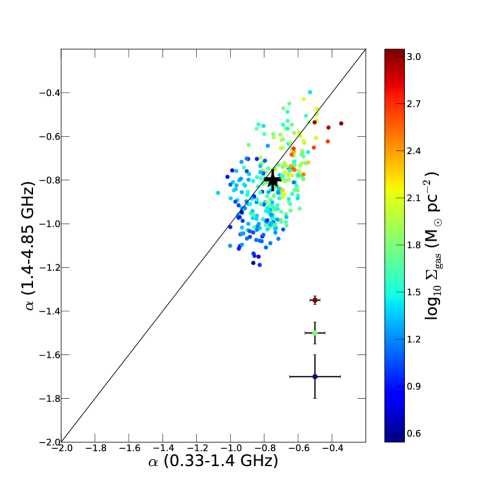
To test the scenario of the expected differences in spatially resolved , we studied between a low frequency pair (0.3 and 1.4 GHz) and between a high frequency pair (1.4 and 4.85 GHz). The galaxy NGC 6946 has the best resolution spectral index map in our sample. NGC 6946 was observed at 4.85 GHz using the VLA in D-array configuration and a combination with a single dish Effelsberg observation was done to ensure no missing flux density (Beck 2007). In Figure 4 (left-hand panel) we plot the total radio emission spectral index between 1.4 and 4.85 GHz [(1.4–4.85 GHz)] versus the spectral index between 0.33 and 1.4 GHz [(0.33–1.4 GHz)]. The total emission spectral index estimated between the two sets of well separated radio frequencies follow the 1:1 line closely. The symbols are colour coded based on . In the high gas density regions, typically in the arms and inner regions of the galaxy, the spectral indices are flatter. However, these values could be affected due to the presence of high thermal emission.
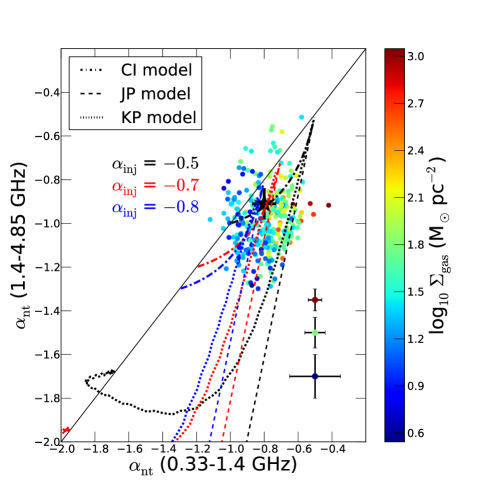
In Figure 4 (right-hand panel), we plot the non-thermal spectral index estimated between 1.4 and 4.85 GHz [(1.4–4.85 GHz)] and between 0.33 and 1.4 GHz [(0.33–1.4 GHz)] (see Section 2). In general, (1.4–4.85 GHz) is found to be steeper than (0.33–1.4 GHz). It is steeper by up to in regions of lower gas surface density (bluer points), i.e., the interarm regions and outer parts of the galaxy. This is consistent with the scenario that such regions are dominated by synchrotron and/or inverse-Compton losses resulting in steeper spectral indices at higher frequencies.
We compare the expected variation of measured between the two pairs of radio frequencies using the different models of energy loss, i.e., the continuous injection (CI), Jaffe-Perola (JP) and Kardashev-Pacholczyk (KP) models. We generated synthetic radio spectra for each of the models with varying break frequencies. In Figure 4 (right-hand panel) we plot the trajectory of for a constant injection spectral index of . The CI model is indicated by the dashed-dot lines, the JP model is indicated by dashed lines and the KP model is shown as the dotted lines. It is clear that the CI model cannot give rise to the observed steepening of the spectrum between the two pairs of radio frequencies of our study. This is also indicated in Figure 3, which shows that the injection timescales are larger than the loss timescales. The JP and KP models reproduce the observed steepening at higher frequency better. The maximum steeping observed in our case corresponds to a break frequency of GHz for the JP model and GHz for the KP model. Detailed modelling of the spatially resolved radio continuum spectra would require high quality maps at several frequencies covering a wide range.
Moreover, we note that the regions of high gas density are also the regions with dominant ionization and/or bremsstrahlung losses. Such losses have the effect of flattening at lower frequencies as seen in Figure 2. As is also evident from Figure 3, at regions of high surface gas density (), ionization losses should start dominating at GHz. Such regions are observed in the galaxy NGC 5236 and are likely to be giant molecular clouds. We observe to be flatter than the typical injection values of . However, these losses will not affect at higher radio frequencies. We therefore observe the values of (1.4–4.85 GHz) to be well mixed in all regions with no clear trend444Note the systematic trend of density variation (red to orange to yellow to blue points) as one moves from right to left along axis. No such trend is observed while moving from top to bottom along axis. with gas density.
Due to the smooth transition of the values of at lower and higher frequencies in the spatially resolved case, the galaxy integrated case does not capture this scenario well, i.e., no significant change in spectral index should be expected. The stars in both the panels in Figure 4 shows the galaxy integrated spectral index. The spectral index for total radio emission is observed to be close to the 1:1 line. For the non-thermal emission (right-hand panel), the integrated spectrum is still observed to remain close to the 1:1 line. Within errors, we observe both total and non-thermal spectral index to remain close to for both pairs of frequencies. Hence, we do not see any significant change of the slope for the galaxy integrated spectrum. Moreover, the dense regions that shows evidence of ionization losses, cover only a small fraction ( percent) of the galaxy. Thus, the galaxy integrated spectrum may not show such a behavior. Our study comprehensively shows that different loss mechanisms are dominant in different parts of the galaxies. It is difficult to single out any one of the energy loss mechanisms while interpreting the galaxy integrated spectrum. Such studies, hence do not often show significant deviation from a power-law behavior for a wide range of radio frequencies.
Data on more galaxies are required to see such clear trends. LOFAR and EVLA are ideal instruments to do such studies robustly at lower ( MHz) and higher ( GHz) radio frequencies, respectively. Complementary data from the GMRT covering the intermediate frequency range ( MHz) could help us model the spatially resolved spectral behavior of continuum emission in detail. High resolution CO observations from the ALMA could facilitate measuring the distribution of the molecular gas at unprecedented detail.
5 Conclusions
We have studied the variation of spatially resolved non-thermal spectral index () as a function of the total neutral gas surface mass density () for four nearby galaxies. The galaxies in our sample are, NGC 4736, NGC 5055, NGC 5236 and NGC 6946. In this study, we have measured the and at sub-kpc linear scales except for the galaxy NGC 5236. The spectral index were measured between 0.33 and 1.4 GHz. We present our conclusions here.
-
(i)
The local ISM gas density plays an important role in shaping up the radio continuum spectrum. We find the to remain comparatively flat () in the regions of high gas density () and steepens sharply () in regions of low gas density ().
-
(ii)
The observed flattening is unlikely to be caused by free–free absorption at low frequency such as 0.33 GHz. We find that in the regions of high gas density (), bremsstrahlung and ionization losses could flatten the at radio frequencies below GHz.
-
(iii)
Synchrotron losses dominates at higher radio frequencies ( GHz) in regions having moderate densities (). In denser regions, bremsstrahlung losses are expected to dominate. Inverse-Compton losses are mostly unimportant in galaxies except for regions of very low gas densities having magnetic field strengths G.
-
(iv)
For the galaxy NGC 6946, we study the variation of measured between 0.33 and 1.4 GHz and between 1.4 and 4.85 GHz. We find that between the higher frequency pair is steeper than that between the lower frequency pair indicating synchrotron or inverse-Compton losses at 4.85 GHz. The observed steepening cannot be caused by continuous injection of CR particles and requires single shot particle injection.
-
(v)
Due to the clumpy nature of the ISM, these local CRE energy losses may not show indications in the overall galaxy-integrated spectrum. Thus, the galaxy-integrated spectrum may remain a power-law for a wide range of radio frequencies.
Acknowledgments
We thank the referee, Joshua Marvil, for the helpful comments and suggestions that improved the presentation of the paper. We thank Nirupam Roy for extensive discussions and critically going through the manuscript that considerably improved the presentation of the paper. This work has made use of HERACLES, ‘The HERA CO-Line Extragalactic Survey’ (Leroy et al. 2009). This work has made use of THINGS, ‘The Hi Nearby Galaxy Survey’ (Walter et al. 2008).
References
- [Adebahr, Krause, Klein, Weżgowiec, Bomans, & Dettmar 2013] Adebahr B., Krause M., Klein U., Weżgowiec M., Bomans D. J., Dettmar R.-J., 2013, A&A, 555, A23
- [Basu, Mitra, Wadadekar, & Ishwara-Chandra 2012] Basu A., Mitra D., Wadadekar Y., Ishwara-Chandra C. H., 2012, MNRAS, 419, 1136
- [Basu & Roy 2013] Basu A., Roy S., 2013, MNRAS, 433, 1675
- [Beck 2007] Beck R., 2007, A&A, 470, 539
- [Bell 1978] Bell A. R., 1978, MNRAS, 182, 443
- [Bell 2004] —, 2004, MNRAS, 353, 550
- [Biermann & Strom 1993] Biermann P. L., Strom R. G., 1993, A&A, 275, 659
- [Blandford & Eichler 1987] Blandford R., Eichler D., 1987, Phys. Rep., 154, 1
- [Bogdan & Völk 1983] Bogdan T. J., Völk H. J., 1983, A&A, 122, 129
- [Braun, Oosterloo, Morganti, Klein, & Beck 2007] Braun R., Oosterloo T. A., Morganti R., Klein U., Beck R., 2007, A&A, 461, 455
- [Chandrasekhar & Fermi 1953] Chandrasekhar S., Fermi E., 1953, ApJ, 118, 113
- [Cho & Vishniac 2000] Cho J., Vishniac E. T., 2000, ApJ, 539, 273
- [Condon 1992] Condon J. J., 1992, ARA&A, 30, 575
- [Crosthwaite, Turner, Buchholz, Ho, & Martin 2002] Crosthwaite L. P., Turner J. L., Buchholz L., Ho P. T. P., Martin R. N., 2002, AJ, 123, 1892
- [Dickey & Lockman 1990] Dickey J. M., Lockman F. J., 1990, ARA&A, 28, 215
- [Duric, Bourneuf, & Gregory 1988] Duric N., Bourneuf E., Gregory P. C., 1988, AJ, 96, 81
- [Edmon, Kang, Jones, & Ma 2011] Edmon P. P., Kang H., Jones T. W., Ma R., 2011, MNRAS, 414, 3521
- [Gioia, Gregorini, & Klein 1982] Gioia I. M., Gregorini L., Klein U., 1982, A&A, 116, 164
- [Groves, Cho, Dopita, & Lazarian 2003] Groves B. A., Cho J., Dopita M., Lazarian A., 2003, PASA, 20, 252
- [Israel & Mahoney 1990] Israel F. P., Mahoney M. J., 1990, ApJ, 352, 30
- [Jaffe & Perola 1973] Jaffe W. J., Perola G. C., 1973, A&A, 26, 423
- [Jones 2011] Jones T. W., 2011, Journal of Astrophysics and Astronomy, 32, 427
- [Kalberla & Dedes 2008] Kalberla P. M. W., Dedes L., 2008, A&A, 487, 951
- [Kang, Edmon, & Jones 2012] Kang H., Edmon P. P., Jones T. W., 2012, ApJ, 745, 146
- [Karachentsev, Sharina, Dolphin, Grebel, Geisler, Guhathakurta, Hodge, Karachentseva, Sarajedini, & Seitzer 2002] Karachentsev I. D., Sharina M. E., Dolphin A. E., Grebel E. K., Geisler D., Guhathakurta P., Hodge P. W., Karachentseva V. E., et al., 2002, A&A, 385, 21
- [Karachentsev, Sharina, Dolphin, Grebel, Geisler, Guhathakurta, Hodge, Karachentseva, Sarajedini, & Seitzer 2003] —, 2003, A&A, 398, 467
- [Karachentsev, Sharina, & Huchtmeier 2000] Karachentsev I. D., Sharina M. E., Huchtmeier W. K., 2000, A&A, 362, 544
- [Kardashev 1962] Kardashev N. S., 1962, SvA, 6, 317
- [Kennicutt 1998] Kennicutt Jr. R. C., 1998, ARA&A, 36, 189
- [Klein & Emerson 1981] Klein U., Emerson D. T., 1981, A&A, 94, 29
- [Kroupa 2001] Kroupa P., 2001, MNRAS, 322, 231
- [Leroy, Walter, Bigiel, Usero, Weiss, Brinks, de Blok, Kennicutt, Schuster, Kramer, Wiesemeyer, & Roussel 2009] Leroy A. K., Walter F., Bigiel F., Usero A., Weiss A., Brinks E., de Blok W. J. G., Kennicutt R. C., et al., 2009, AJ, 137, 4670
- [Leroy, Walter, Brinks, Bigiel, de Blok, Madore, & Thornley 2008] Leroy A. K., Walter F., Brinks E., Bigiel F., de Blok W. J. G., Madore B., Thornley M. D., 2008, AJ, 136, 2782
- [Longair 2011] Longair M. S., 2011, High energy astrophysics, 3rd ed. Cambridge: Cambridge University Press
- [Marvil, Owen, & Eilek 2014] Marvil J., Owen F., Eilek J., 2014, ArXiv e-prints:1408.6296
- [Mulcahy, Horneffer, Beck, Heald, Fletcher, Scaife, Adebahr, Anderson, Bonafede, Brüggen, Brunetti, Chyży, Conway, Dettmar, Enßlin, Haverkorn, Horellou, Iacobelli, Israel, Junklewitz, Jurusik, Köhler, Kuniyoshi, Orrú, Paladino, Pizzo, Reich, & Röttgering 2014] Mulcahy D. D., Horneffer A., Beck R., Heald G., Fletcher A., Scaife A., Adebahr B., Anderson J. M., et al., 2014, A&A, 568, A74
- [Murphy 2009] Murphy E. J., 2009, ApJ, 706, 482
- [Niklas, Klein, & Wielebinski 1997] Niklas S., Klein U., Wielebinski R., 1997, A&A, 322, 19
- [Pacholczyk 1970] Pacholczyk A. G., 1970, Radio astrophysics. Nonthermal processes in galactic and extragalactic sources
- [Paladino, Murgia, & Orrú 2009] Paladino R., Murgia M., Orrú E., 2009, A&A, 503, 747
- [Pohl & Schlickeiser 1990] Pohl M., Schlickeiser R., 1990, A&A, 239, 424
- [Roy & Rao 2004] Roy S., Rao A. P., 2004, MNRAS, 349, L25
- [Sanders, Solomon, & Scoville 1984] Sanders D. B., Solomon P. M., Scoville N. Z., 1984, ApJ, 276, 182
- [Schleicher & Beck 2013] Schleicher D. R. G., Beck R., 2013, A&A, 556, A142
- [Sramek 1975] Sramek R., 1975, AJ, 80, 771
- [Tabatabaei, Beck, Krügel, Krause, Berkhuijsen, Gordon, & Menten 2007] Tabatabaei F. S., Beck R., Krügel E., Krause M., Berkhuijsen E. M., Gordon K. D., Menten K. M., 2007, A&A, 475, 133
- [Walter, Brinks, de Blok, Bigiel, Kennicutt, Thornley, & Leroy 2008] Walter F., Brinks E., de Blok W. J. G., Bigiel F., Kennicutt Jr. R. C., Thornley M. D., Leroy A., 2008, AJ, 136, 2563
- [Young, Xie, Kenney, & Rice 1989] Young J. S., Xie S., Kenney J. D. P., Rice W. L., 1989, ApJS, 70, 699