Two particle correlations from the energy scan with p+p interactions
for the NA61/SHINE collaboration
Warsaw University of Technology
E-mail
A footnote may follow.
Abstract:
The NA61/SHINE experiment aims to discover the critical point of strongly interacting matter and study the properties of the onset of deconfinement. These goals are to be achieved by performing a two dimensional phase diagram (-) scan by measurements of hadron production properties in proton-proton, proton-nucleus and nucleus-nucleus interactions as a function of collision energy and system size. Close to the phase transition and/or close to the critical point large fluctuations are predicted. In this contribution preliminary results on two-particle correlations in pseudorapidity and azimuthal angle will be presented for p+p interactions at beam momenta: 20, 31, 40, 80 and 158 . The NA61/SHINE results will be compared with the corresponding data of other experiments and model predictions. A striking evolution with collision energy is observed.
1 Introduction
Two-particle correlations in , were studied extensively at RHIC and LHC. They allow to disentangle different sources of correlations: jets, flow, resonance decays, quantum statistics effects, conservation laws, etc. Here we report preliminary results on two-particle correlations in inelastic p+p interactions at SPS beam momenta (20, 31, 40, 80, and 158 ).
2 correlations
Correlations are calculated as a function of the difference in pseudo-rapidity
() and azimuthal angle () between two particles in the same event.
The uncorrected () correlation function is calculated as:
(1)
where
;
are the distributions for pairs from data and mixed events, respectively.
The range is folded, i.e. for larger than its value is recalculated as . In order to allow for a comparison with the RHIC and LHC results the pseudo-rapidity was calculated in the centre-of-mass (CMS) system. The transformation from the laboratory system to the CMS was performed assuming the pion mass for all produced particles. Electrons and positrons were removed by a cut on , the energy loss of the particle tracks in the TPC detectors.
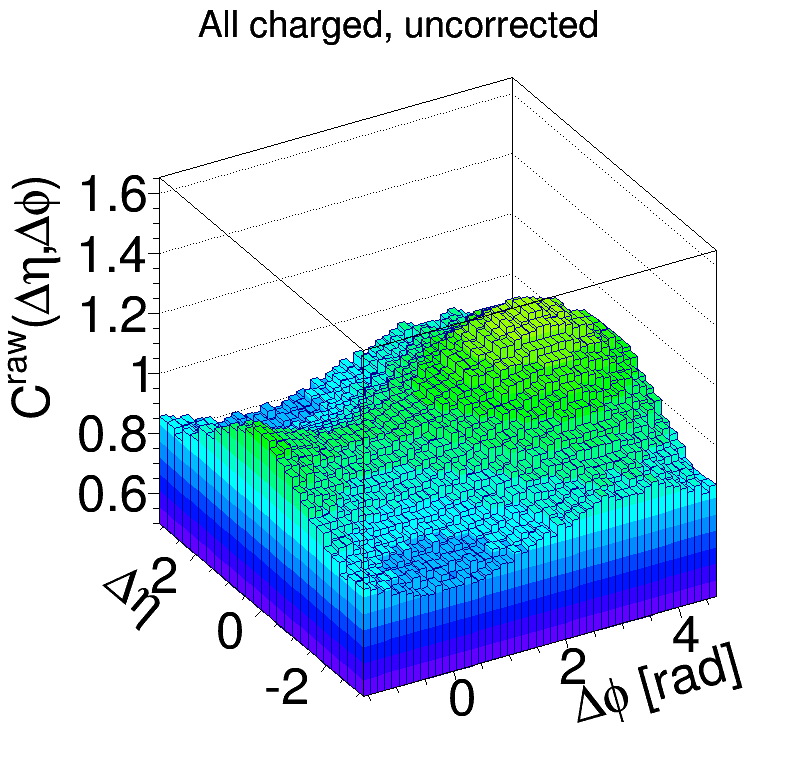
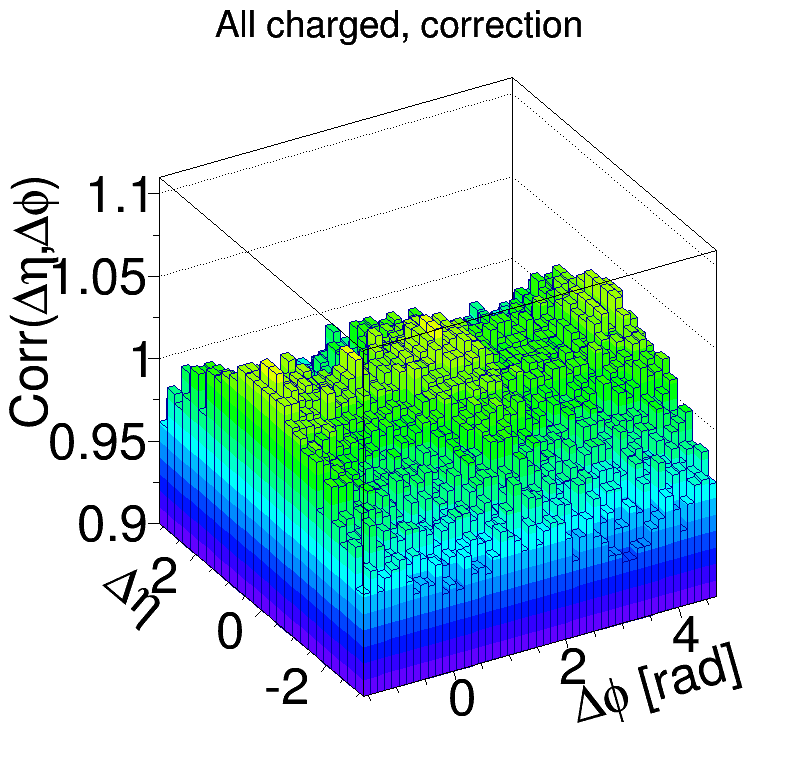
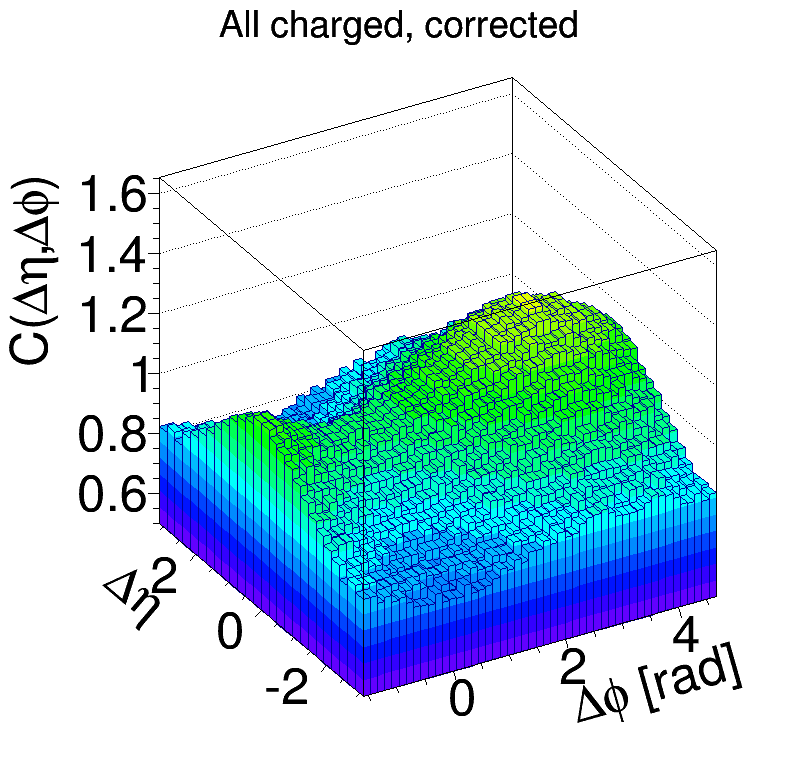
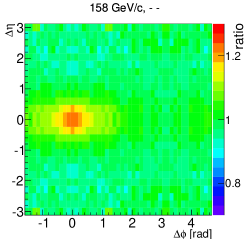
Figure 1: Example of the correction procedure for the correlation function of p+p interactions at 80 beam momentum. Left plot shows correlation function for uncorrected data, middle plot shows the binwise correction factors, right plot presents the corrected correlation function. For all plots the cut was applied.
3 Corrections
In order to correct the measured raw correlation function for possible biases due to trigger and off-line
event selection, track selection, etc. the same analysis was also performed on simulated data. The bin-by-bin correction was calculated as the ratio of the correlation functions for generated events from the Epos [1] model (“pure”) and the same events after processing through Geant detector simulation and reconstruction (“rec”):
(2)
where is the correlation function obtained for generated events and is the correlation function for these events after detector simulation and reconstruction. For both “pure” and “rec” events the NA61/SHINE acceptance was applied.
Corrected correlation functions (example in Fig. 1, right) were obtained by multiplying the uncorrected correlation function (Fig. 1, left) by the corresponding corrections (Fig. 1, middle), namely:
(3)
4 Results
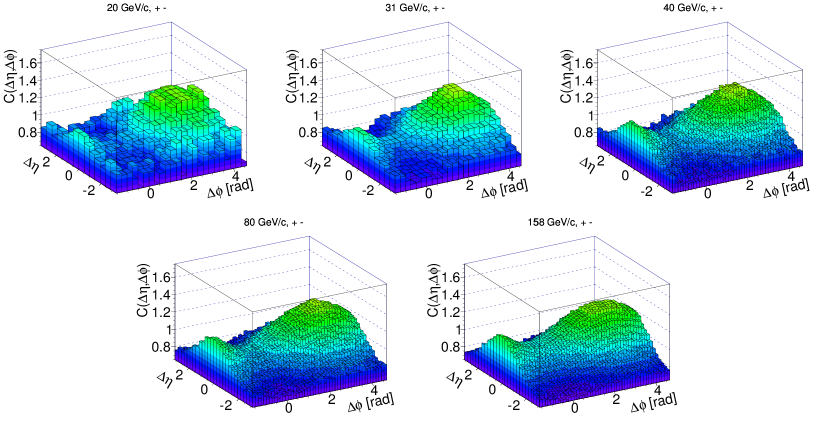
The corrected correlation functions for all charged pair combinations
(unlike-sign pairs, positively and negatively charged pairs)
are presented in Figs. 2, 3,
4 and 5, respectively.
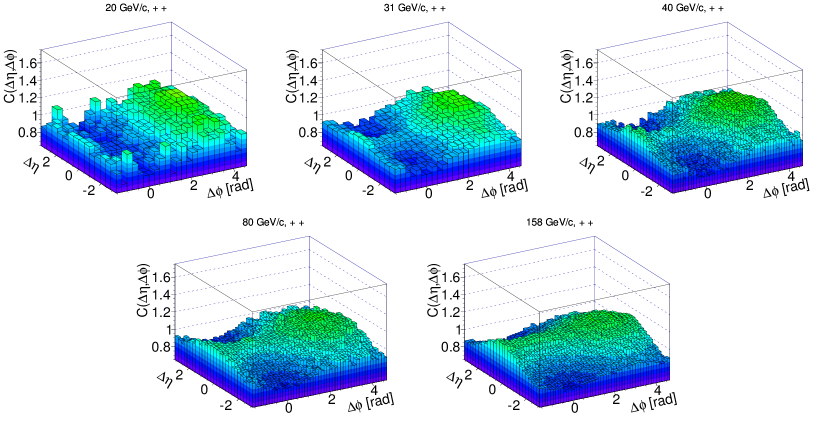
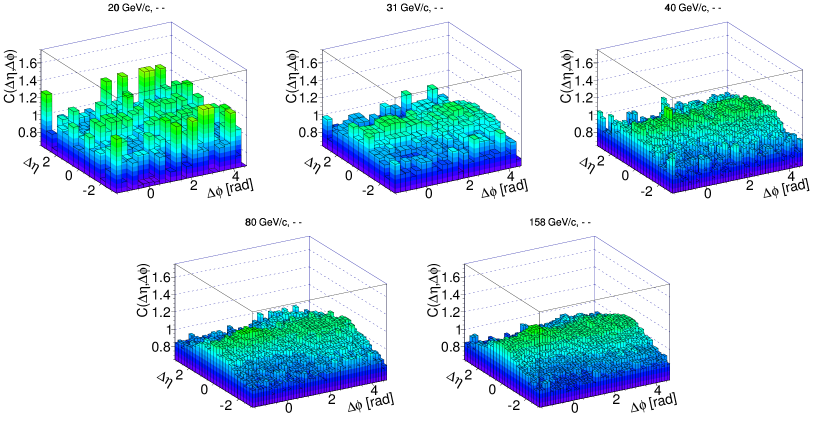
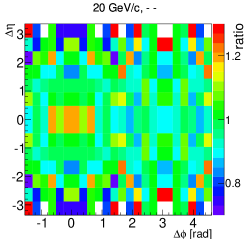
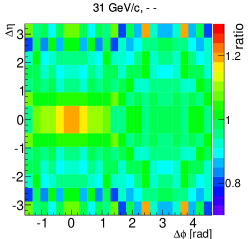
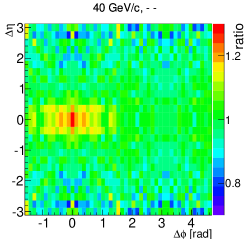
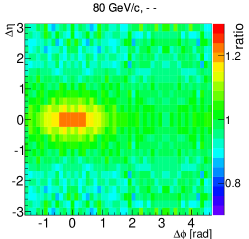
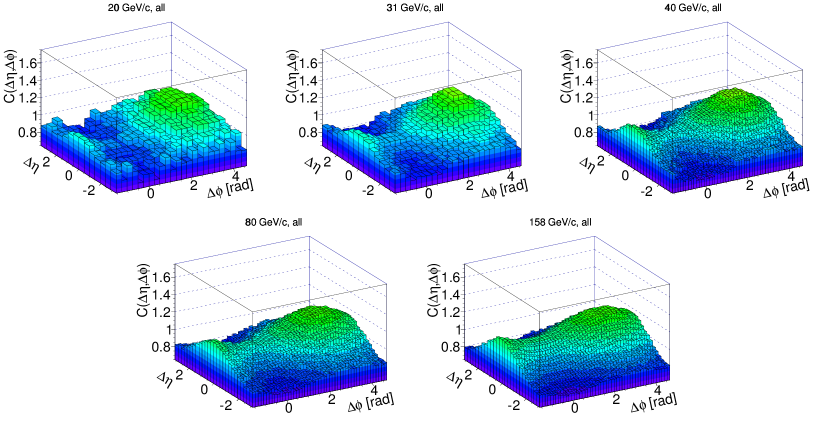
Figure 2: Results on correlations for inelastic p+p interactions. Results for all charged particle pairs. The correlation function is mirrored around .Figure 3: Results on correlations for inelastic p+p interactions. Results for unlike-sign pairs. The correlation function is mirrored around .Figure 4: Results on correlations for inelastic p+p interactions. Results for positively charged pairs. The correlation function is mirrored around .Figure 5: Results on correlations for inelastic p+p interactions. Results for negatively charged pairs. The correlation function is mirrored around .
Several structures can be seen in the plots:
•
A maximum at , probably a result of resonance decays and momentum conservation. It is strongest for unlike-sign pairs and significantly weaker for same charge pairs.
•
Weak enhancement at , likely due to Coulomb interactions (unlike-sign pairs) and quantum statistics (same charge pairs).
4.1 Comparison with the EPOS model
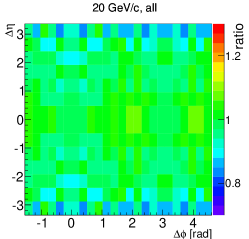
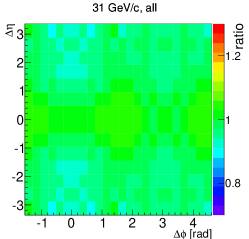
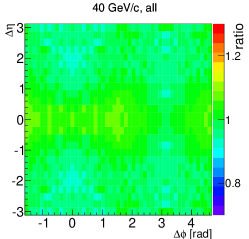
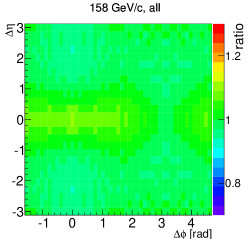
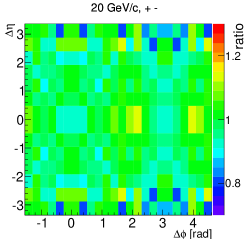
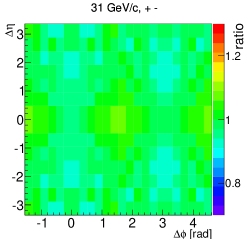
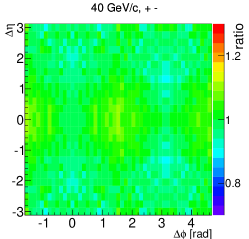
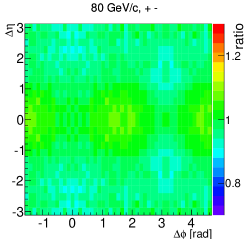
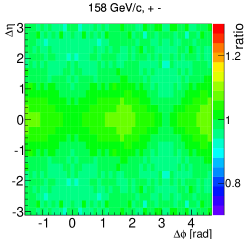
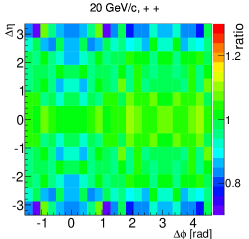
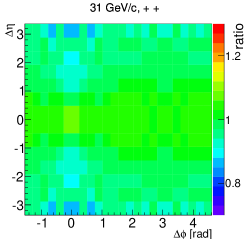
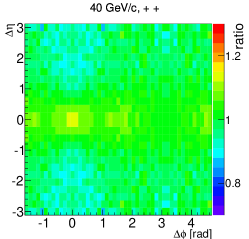
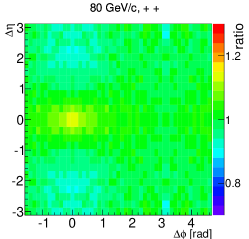
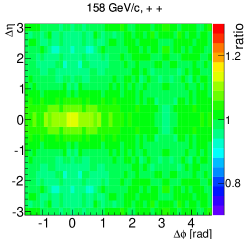
The ratio of the experimental results and predictions of the Epos model is shown in Figs. 6, 7, 8 and 9. In general Epos reproduces results from p+p interactions well.
However, the model does not reproduce the peak. This can be seen for positively and negatively charged pairs (Figs. 8 and 9 respectively). Note, that Epos does not include Bose-Einstein correlations and Coulomb interactions.
Figure 6: The ratio of for data and Epos.
All charged particle pairs.
The correlation function is mirrored around .
Figure 7: The ratio of for data and Epos.
Unlike-sign pairs. The correlation function is mirrored around .
Figure 8: The ratio of for data and Epos.
Positively charged pairs. The correlation function is mirrored around .
Figure 9: The ratio of for data and Epos.
Negatively charged pairs. The correlation function is mirrored around .
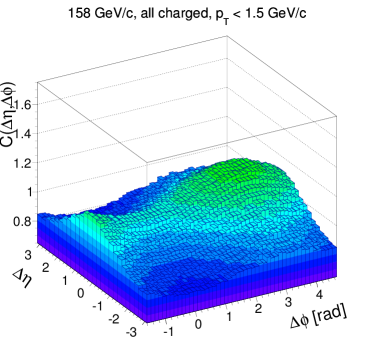
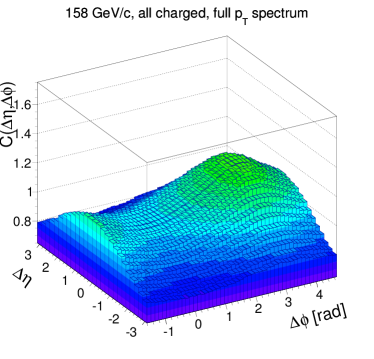
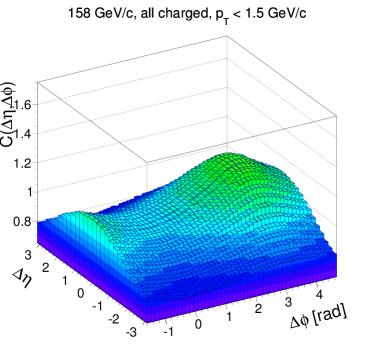
4.2 Influence of cut at 158
Originally, NA61/SHINE meant to study the effects of conservation laws, resonance decays, etc. on the correlation function . The effects of jets, though expected to be negligible, were reduced by the transverse momentum cut . An additional analysis was performed to check the effect of this cut. A comparison of the left and right plots in Figs. 10 and 11 demonstrates that the influence of the upper cut on the correlation functions for data and the Epos model, respectively, are indeed negligible.
Figure 10: The effect of a transverse momentum cut on the measured correlation function.
Figure 11: The effect of a transverse momentum cut on the correlation function obtained from the Epos model.
4.3 Comparison with the ALICE experiment
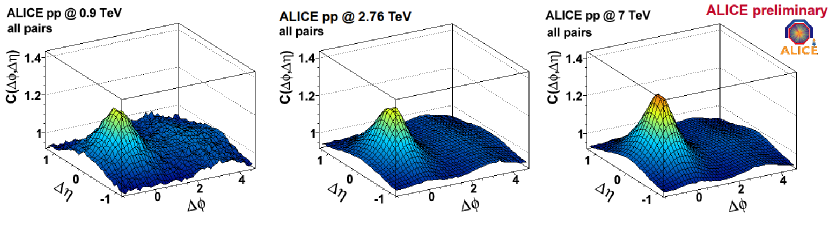
The NA61/SHINE results are compared to the results from the ALICE experiment in Fig. 12. NA61/SHINE results show a stronger enhancement at and a significantly weaker maximum at (“jet peak”).
Figure 12: Correlation functions for all charged particle pairs from NA61/SHINE (five upper plots, same as in Fig. 2) compared with the ALICE results (three lower plots) taken from Ref. [2].
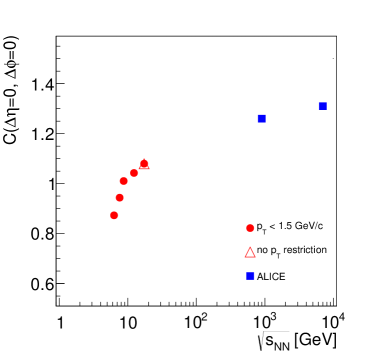
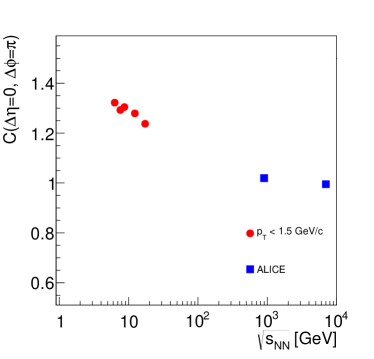
Figure 13 presents the energy dependence of (“jet peak”) and (“resonance hill”) from the NA61/SHINE and ALICE experiments. Monotonical behaviour is observed for both and . rises with collision energy suggesting that the contribution from jets gets stronger with energy. On the other hand, decreases with collision energy. This can be explained by a decreasing contribution coming from resonance decays.
Figure 13: Correlation value for “jet peak” and “resonance hill” as a function of energy in CMS frame. Left plot shows height of (“jet peak”). Right plot is a height of (“resonance hill”).
Acknowledgements: This work was supported by the the National Science Centre, Poland grant 2012/04/M/ST2/00816.
References
[1]
K. Werner, F. M. Liu and T. Pierog,
Phys. Rev. C 74 (2006) 044902
[hep-ph/0506232].
[2]
M. Janik,
PoS WPCF 2011 (2011) 026
[arXiv:1203.2844 [hep-ex]].