A Quantum Gas Microscope for Fermionic Atoms
Abstract
Strongly interacting fermions define the properties of complex matter throughout nature, from atomic nuclei and modern solid state materials to neutron stars. Ultracold atomic Fermi gases have emerged as a pristine platform for the study of many-fermion systems. Here we realize a quantum gas microscope for fermionic 40K atoms trapped in an optical lattice, which allows one to probe strongly correlated fermions at the single atom level. We combine 3D Raman sideband cooling with high-resolution optics to simultaneously cool and image individual atoms with single lattice site resolution at a detection fidelity above . The imaging process leaves the atoms predominantly in the 3D motional ground state of their respective lattice sites, inviting the implementation of a Maxwell’s demon to assemble low-entropy many-body states. Single-site resolved imaging of fermions enables the direct observation of magnetic order, time resolved measurements of the spread of particle correlations, and the detection of many-fermion entanglement.
The collective behavior of fermionic particles governs the structure of the elements, the workings of high-temperature superconductors and colossal magneto-resistance materials, and the properties of nuclear matter. Yet our understanding of strongly interacting Fermi systems is limited, due in part to the antisymmetry requirement on the many-fermion wavefunction and the resulting “fermion sign problem”. In recent years, ultracold atomic quantum gases have enabled quantitative experimental tests of theories of strongly interacting fermions Inguscio et al. (2008); Bloch et al. (2008); Zwerger (2011); Zwierlein (2014). In particular, fermions trapped in optical lattices can directly simulate the physics of electrons in a crystalline solid, shedding light on novel physical phenomena in materials with strong electron correlations. A major effort is devoted to the realization of the Fermi-Hubbard model at low entropies, believed to capture the essential aspects of high- superconductivity Esslinger (2010); Chin et al. (2006); Jördens et al. (2008); Schneider et al. (2008); Greif et al. (2013); Imriška et al. (2014); Hart et al. (2014). For bosonic atoms, a new set of experimental probes ideally suited for the observation of magnetic order and correlations has become available with the advent of quantum gas microscopes Bakr et al. (2009); Sherson et al. (2010); Miranda et al. (2014), enabling high-resolution imaging of Hubbard-type lattice systems at the single atom level. They allowed the direct observation of spatial structures and ordering in the Bose-Hubbard model Bakr et al. (2010); Sherson et al. (2010) and of the intricate correlations and dynamics in these systems Endres et al. (2011); Cheneau et al. (2012). A longstanding goal has been to realize such a quantum gas microscope for fermionic atoms. This would enable the direct probing and control at the single lattice site level of strongly correlated fermion systems, in particular the Fermi-Hubbard model, in regimes that cannot be described by current theories. These prospects have sparked significant experimental effort to realize site-resolved, high-fidelity imaging of ultracold fermions, but this goal has so far remained elusive.
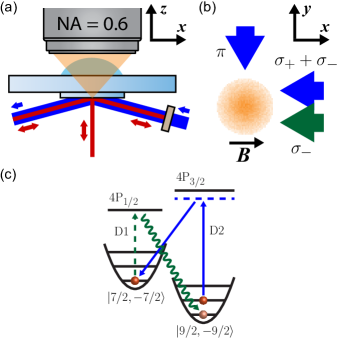
In the present work, we realize a quantum gas microscope for fermionic 40K atoms by combining 3D Raman sideband cooling with a high resolution imaging system. The imaging setup incorporates a hemispherical solid immersion lens optically contacted to the vacuum window (Fig. 1(a)). In combination with a microscope objective with numerical aperture (NA) of 0.60, the system achieves an enhanced NA of 0.87 while eliminating aberrations that would arise from a planar vacuum window. In order to keep the atoms localized while performing fluorescence imaging, one must simultaneously cool them in order to mitigate the heating from spontaneously emitted imaging photons. Previous microscope experiments in Hubbard-type lattices Bakr et al. (2009); Sherson et al. (2010); Miranda et al. (2014) cool via optical molasses. In contrast, we employ 3D Raman sideband cooling Monroe et al. (1995); Hamann et al. (1998); Vuletić et al. (1998); Kerman et al. (2000); Han et al. (2000); Nelson et al. (2007); Kaufman et al. (2012); Patil et al. (2014); Thompson et al. (2013), in which Raman transitions on vibration-lowering sidebands are combined with optical pumping to provide cooling. Our method therefore not only achieves site-resolved imaging, but also leaves a large fraction of the atoms () in the 3D motional ground state of each lattice site. This opens up prospects for the preparation of low entropy many-body states, by measuring the atoms’ initial positions and rearranging them into the desired configuration Weiss et al. (2004).
Raman sideband cooling has previously been used to cool 87Rb and 133Cs atoms in lattices and in optical tweezers to large ground state populations Hamann et al. (1998); Vuletić et al. (1998); Kerman et al. (2000); Han et al. (2000); Nelson et al. (2007); Kaufman et al. (2012); Patil et al. (2014); Thompson et al. (2013). Here, we realize continuous Raman sideband cooling of 40K using two states from the ground hyperfine manifolds, and , which form an approximate two-level system. To make and non-degenerate with other hyperfine states, and to provide a quantization axis for optical pumping, we apply a bias field of along the direction (Fig. 1(b)). A pair of Raman beams collinear with and lattice beams, but not retro-reflected, drives vibration-lowering Raman transitions from to (Fig. 1(c)). The Raman lasers are detuned from the D2 transition. The optical pumping is performed on the D1 transition, away from the D2 line, allowing us to filter out stray Raman light while transmitting atomic fluorescence. By collecting the photons that are spontaneously scattered during this optical pumping process, we can image the atoms without using additional resonant light.
To prepare a cold cloud of fermionic atoms under the microscope, 40K is first sympathetically cooled with 23Na in a plugged magnetic quadrupole trap Park et al. (2012), centered below a super-polished substrate that forms the bottom of the solid immersion lens. After removal of 23Na, the cloud of million 40K atoms is magnetically transported to the substrate and trapped in a vertical lattice formed by a laser beam reflected off the substrate at an angle of . A single layer m from the surface is selected using a radiofrequency sweep in a vertical magnetic gradient followed by a resonant light pulse that removes atoms in the remaining layers. Next, we prepare a 50/50 mixture of and to allow thermalization, and transfer the atoms to a vertical ( direction) beam, forming a lattice along with a spacing of (Fig. 1(a)). After evaporating by lowering the power of the -lattice, the -depth is increased to . We simultaneously ramp up two additional beams (Fig. 1(a)) reflected off the substrate at and retro-reflected. These form a lattice in the horizontal plane with a spacing of .
During imaging, the atoms are trapped in a deep lattice, where the potential at each lattice site can be approximated by a harmonic well with vibrational frequency . At our imaging depth, the vibrational frequencies for the three axes are , corresponding to lattice depths of , and respectively. The Rabi coupling for transitions that change the vibrational number by one is proportional to the Lamb-Dicke parameter, , where is the harmonic oscillator length and is the momentum transfer due to the Raman beams. Along our lattice directions, , and , yielding Lamb-Dicke parameters of 0.17 for and , and 0.068 for . The polarizations of both Raman beams are linear and parallel to the substrate (Fig. 1(b)), in order to avoid differential effective magnetic fields between and that would arise for circularly polarized light. The Raman beam along the -axis contains a single frequency, whereas the Raman beam along the -axis contains three frequencies, allowing us to address the cooling sidebands of the three directions simultaneously. The resulting two-photon detunings from the bare transition are , and for cooling along , and respectively. These frequencies compensate for differential Stark shifts that arise in the presence of optical pumping light. The -Raman beam intensities of the three frequency components are , and respectively; the intensity of the -Raman beam is .
In addition to these Raman beams, optical pumping light is present to complete the cooling cycle. During optical pumping, atoms enter electronically excited states, and preferentially decay into the desired state. Typically, the excited states experience an anti-trapping potential when the ground state experiences a trapping potential. For our lattice, the anti-trapping potential for the atoms in the states is times stronger than the trapping potential for atoms in the states, due to the transition at . This strong anti-trapping would lead to heating and diffusion of atoms through the lattice during imaging.
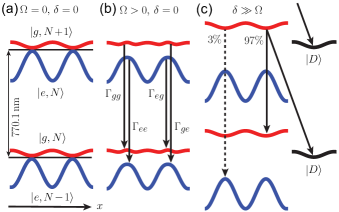
A solution to this problem is to detune the optical pumping light away from resonance. This reduces the population in the anti-trapping states and favors transitions into trapping states. One can understand this by considering the dressed states of a driven two-level system. At zero intensity, the dressed states, and , correspond to the bare trapping and anti-trapping states with photons respectively (Fig. 2(a)). In the presence of resonant pumping light, neither of the dressed states is trapping (Fig. 2(b)), which leads to heating.
However, at large detunings , where is the Rabi frequency, one dressed state becomes trapping. Furthermore, spontaneous decay among the dressed states favors population in the trapping states. Specifically, the decay rates , , and , defined in Fig. 2(b), are proportional to , , and respectively, where . The ratio of the anti-trapped population to the trapped population is suppressed, because in steady state, it is given by which scales as . Another benefit of large detunings involves the state into which atoms are optically pumped (Fig. 2(c)). This state is dark to the optical pumping light, and hence has no excited state admixture; consequently, it experiences a trapping potential. Atoms in trapping states decay preferentially into , since the ratio of anti-trapping transitions to dark state transitions scales as , which is small at large .
In light of these considerations, we detune the hyperfine-changing () pumping light from the Stark-shifted transition and the Zeeman-level () pumping light from the Stark-shifted transition. The optical pumping beam co-propagates with the -Raman beam, and has its polarization optimized for minimal admixture. The and components have intensities of and respectively; the Lamb-Dicke parameters for optical pumping are for and , and 0.18 for .
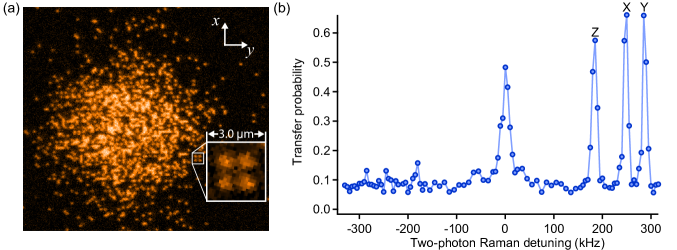
This Raman cooling scheme allows us to collect fluorescence while keeping the atoms confined to their lattice sites (Fig. 3(a)). Furthermore, we find that atoms are cooled predominantly into their motional ground state. Indeed, Raman spectroscopy reveals a 3D ground state population of after cooling (Fig. 3(b)). Note that parameters are optimized for imaging fidelity rather than for a large ground state population. We measure a fluorescence rate of with a lifetime of seconds. With a photon collection and detection efficiency of , about photons per atom can be collected in an exposure time of one second, which is sufficient to detect single atoms with high fidelity. Using the number of scattered photons and the Lamb-Dicke parameters for spontaneous emission, we estimate the cooling rate to be .
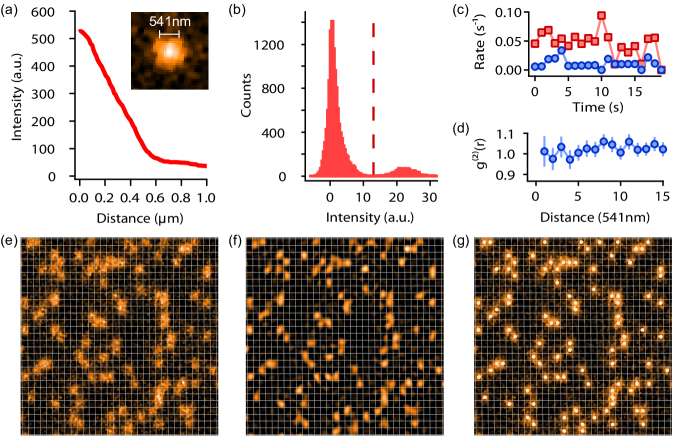
To verify that we can resolve individual lattice sites, we measure the point spread function (PSF) of our imaging system using isolated atoms from sparsely populated images. The measured PSF has a full-width-half-max (FWHM) of (Fig. 4(a)). Images are deconvolved with the PSF to achieve sub-lattice-site resolution. From such images, we also extract the lattice axes and spacings necessary to reconstruct the atomic distribution. Binning the intensity of the deconvolved image by lattice site reveals a clear bimodal distribution (Fig. 4(b)), which is used to determine whether a site is filled (Fig. 4(e,f,g)). This bimodality gives a reconstruction error of .
An important aspect of quantum gas microscopy is the fidelity of the imaging process, which can be characterized by hopping and loss rates. To this end, we take a series of images of the same atomic cloud and observe changes in the site occupations between images. Sites that are empty but become occupied in a subsequent image are counted as hopping events; sites that become empty are counted as loss events. The Raman cooling parameters are optimized for low hopping and loss rates while maintaining a fixed level of fluorescence. For optimized parameters, we achieve loss rates of and hopping rates of for one-second exposures of clouds with fillings between 0.10 and 0.20 (Fig. 4(c)). These rates, which include reconstruction errors, give an detection fidelity of for sparse clouds. At higher fillings, hopping events lead to loss of additional atoms in doubly-occupied sites due to light-assisted collisions. However, even for unity filling, we estimate the imaging fidelity to still be , because of the low hopping rate.
To ensure that the imaging does not cause additional losses for neighboring atoms, one can measure the 2-point correlation function of thermal clouds, since distance-dependent loss will produce anti-correlations at short distances. For a dilute thermal cloud with a filling of 0.19, one site image gives for distances from to 10 lattice spacings, indicating that the imaging does not cause significant distance-dependent loss (Fig. 4(d)).
In conclusion, we have realized high-fidelity site-resolved imaging of 40K fermionic atoms in a Hubbard-type optical lattice by combining 3D Raman sideband cooling with high resolution photon collection. In contrast to existing boson microscopes, the technique leaves atoms predominantly in the absolute 3D ground state of a given lattice site. This opens up new ways to assemble low-entropy Fermi-Hubbard systems atom by atom Weiss et al. (2004); Murmann et al. (2015); Kaufman et al. (2014). Combining site-resolved imaging with on-site manipulation would allow one to deterministically create localized excitations and follow their time evolution Cheneau et al. (2012). Finally, the presence of 23Na in our system invites the realization of a quantum gas microscope for ultracold fermionic NaK molecules Wu et al. (2012), which have been proposed as a new resource for quantum information processing and quantum simulation of lattice models with long-range dipolar interactions.
We would like to thank Katherine Lawrence for experimental assistance and critical readings of the manuscript. This work was supported by the NSF, AFOSR-PECASE, AFOSR-MURI on Exotic Phases of Matter, ARO-MURI on Atomtronics, ONR, a grant from the Army Research Office with funding from the DARPA OLE program, and the David and Lucile Packard Foundation.
References
- Inguscio et al. (2008) M. Inguscio, W. Ketterle, and C. Salomon, eds., Ultracold Fermi Gases, Proceedings of the International School of Physics ”Enrico Fermi”, Course CLXIV, Varenna, 20 - 30 June 2006 (IOS Press, Amsterdam, 2008).
- Bloch et al. (2008) I. Bloch, J. Dalibard, and W. Zwerger, Rev. Mod. Phys. 80, 885 (2008).
- Zwerger (2011) W. Zwerger, ed., The BCS-BEC crossover and the unitary Fermi gas, Vol. 836 (Springer, 2011).
- Zwierlein (2014) M. W. Zwierlein, in Novel Superfluids, Vol. 2, edited by K.-H. Bennemann and J. B. Ketterson (Oxford University Press, Oxford, 2014).
- Esslinger (2010) T. Esslinger, Annual Review of Condensed Matter Physics 1, 129 (2010).
- Chin et al. (2006) J. Chin, D. Miller, Y. Liu, C. Stan, W. Setiawan, C. Sanner, K. Xu, and W. Ketterle, Nature 443, 961 (2006).
- Jördens et al. (2008) R. Jördens, N. Strohmaier, K. Günter, H. Moritz, and T. Esslinger, Nature 455, 204 (2008).
- Schneider et al. (2008) U. Schneider, L. Hackermüller, S. Will, T. Best, I. Bloch, T. A. Costi, R. W. Helmes, D. Rasch, and A. Rosch, Science 322, 1520 (2008).
- Greif et al. (2013) D. Greif, T. Uehlinger, G. Jotzu, L. Tarruell, and T. Esslinger, Science 340, 1307 (2013).
- Imriška et al. (2014) J. Imriška, M. Iazzi, L. Wang, E. Gull, D. Greif, T. Uehlinger, G. Jotzu, L. Tarruell, T. Esslinger, and M. Troyer, Phys. Rev. Lett. 112, 115301 (2014).
- Hart et al. (2014) R. A. Hart, P. M. Duarte, T. L. Yang, X. X. Liu, T. Paiva, E. Khatami, R. Scalettar, N. Trivedi, D. A. Huse, and R. G. Hulet, Preprint arXiv:1407.5932 (2014).
- Bakr et al. (2009) W. S. Bakr, J. I. Gillen, A. Peng, S. Fölling, and M. Greiner, Nature 462, 74 (2009).
- Sherson et al. (2010) J. F. Sherson, C. Weitenberg, M. Endres, M. Cheneau, I. Bloch, and S. Kuhr, Nature 467, 68 (2010).
- Miranda et al. (2014) M. Miranda, R. Inoue, Y. Okuyama, A. Nakamoto, and M. Kozuma, arXiv:1410.5189 (2014).
- Bakr et al. (2010) W. S. Bakr, A. Peng, M. E. Tai, R. Ma, J. Simon, J. I. Gillen, S. Fölling, L. Pollet, and M. Greiner, Science 329, 547 (2010).
- Endres et al. (2011) M. Endres, M. Cheneau, T. Fukuhara, C. Weitenberg, P. Schauß, C. Gross, L. Mazza, M. C. Banuls, L. Pollet, I. Bloch, and S. Kuhr, Science 334, 200 (2011).
- Cheneau et al. (2012) M. Cheneau, P. Barmettler, D. Poletti, M. Endres, P. Schauß, T. Fukuhara, C. Gross, I. Bloch, C. Kollath, and S. Kuhr, Nature 481, 484 (2012).
- Monroe et al. (1995) C. Monroe, D. M. Meekhof, B. E. King, S. R. Jefferts, W. M. Itano, D. J. Wineland, and P. Gould, Phys. Rev. Lett. 75, 4011 (1995).
- Hamann et al. (1998) S. E. Hamann, D. L. Haycock, G. Klose, P. H. Pax, I. H. Deutsch, and P. S. Jessen, Phys. Rev. Lett. 80, 4149 (1998).
- Vuletić et al. (1998) V. Vuletić, C. Chin, A. J. Kerman, and S. Chu, Phys. Rev. Lett. 81, 5768 (1998).
- Kerman et al. (2000) A. J. Kerman, V. Vuletić, C. Chin, and S. Chu, Phys. Rev. Lett. 84, 439 (2000).
- Han et al. (2000) D.-J. Han, S. Wolf, S. Oliver, C. McCormick, M. T. DePue, and D. S. Weiss, Phys. Rev. Lett. 85, 724 (2000).
- Nelson et al. (2007) K. D. Nelson, X. Li, and D. S. Weiss, Nat. Phys. 3, 556 (2007).
- Kaufman et al. (2012) A. M. Kaufman, B. J. Lester, and C. A. Regal, Phys. Rev. X 2, 041014 (2012).
- Patil et al. (2014) Y. S. Patil, S. Chakram, L. M. Aycock, and M. Vengalattore, Phys. Rev. A 90, 033422 (2014).
- Thompson et al. (2013) J. D. Thompson, T. G. Tiecke, A. S. Zibrov, V. Vuletić, and M. D. Lukin, Phys. Rev. Lett. 110, 133001 (2013).
- Weiss et al. (2004) D. S. Weiss, J. Vala, A. V. Thapliyal, S. Myrgren, U. Vazirani, and K. B. Whaley, Phys. Rev. A 70, 040302 (2004).
- Park et al. (2012) J. W. Park, C.-H. Wu, I. Santiago, T. G. Tiecke, S. Will, P. Ahmadi, and M. W. Zwierlein, Phys. Rev. A 85, 051602 (2012).
- Murmann et al. (2015) S. Murmann, A. Bergschneider, V. Klinkhamer, G. Zürn, T. Lompe, and S. Jochim, Phys. Rev. Lett. 114, 080402 (2015).
- Kaufman et al. (2014) A. M. Kaufman, B. J. Lester, C. M. Reynolds, M. L. Wall, M. Foss-Feig, K. R. A. Hazzard, A. M. Rey, and C. A. Regal, Science 345, 306 (2014).
- Wu et al. (2012) C.-H. Wu, J. W. Park, P. Ahmadi, S. Will, and M. W. Zwierlein, Phys. Rev. Lett. 109, 085301 (2012).