Evidence for DCO+ as a probe of ionization in the warm disk surface
Abstract
In this Letter we model the chemistry of DCO+ in protoplanetary disks. We find that the overall distribution of the DCO+ abundance is qualitatively similar to that of CO but is dominated by thin layer located at the inner disk surface. To understand its distribution, we investigate the different key gas-phase deuteration pathways that can lead to the formation of DCO+. Our analysis shows that the recent update in the exothermicity of the reaction involving CH2D+ as a parent molecule of DCO+ favors deuterium fractionation in warmer conditions. As a result the formation of DCO+ is enhanced in the inner warm surface layers of the disk where X–ray ionization occurs. Our analysis points out that DCO+ is not a reliable tracer of the CO snow line as previously suggested. We thus predict that DCO+ is a tracer of active deuterium and in particular X–ray ionization of the inner disk.
1 Introduction
The D/H ratio is a key tracer of history and origin of chemical and physical processes that occurred in the early phases of protoplanetary disks, in which planets may form. In that light, van Dishoeck et al. (2003) have suggested that deuterated chemistry pathways are active during the early phase of planet formation which may alter the deuterium enrichment supplied by the earlier, pre-stellar stages. These deuterium enhancements may be provided to ice-rich planetesimals during formation. Thus understanding deuterium fractionation is key to unravelling the clues of the D/H ratios in the various bodies found in our solar system (e.g. Mumma & Charnley, 2011).
In the physical conditions (temperature, density, ionization) prevailing in circumstellar disks surrounding T Tauri stars, deuterium fractionation is expected to be dominated by ion-molecule reactions (see e.g. Aikawa & Herbst, 1999). Among deuterated ions, DCO+ has been detected in various disk environment such as toward the protoplanetary disk of DM Tau (Guilloteau et al., 2006; Öberg et al., 2010, 2011a; Teague et al., 2015), the disk around the classical T Tauri star TW Hya (van Dishoeck et al., 2003; Qi et al., 2008; Öberg et al., 2012) as well as in the disk surrounding HD 163296 (Mathews et al., 2013) but also in the following other disks, LkCa 15, IM Lup, AS 09, and V4046 Sgr (SMA DISCS project, see Öberg et al., 2010, 2011b).
The key gas-phase deuterium pathways that are active at cold temperature (typically T50K) are the following reactions (Watson, 1976; Wootten, 1987):
| (1) |
and then,
| (2) |
Reaction 1 results in H2D+ enhancement as it is driven mainly forward (i.e. left-to-right) at low temperature (Pagani et al., 1992). Then by reacting with CO, more specifically by transferring a D-atom to CO, the H2D+ ion can lead to the formation of DCO+ (reaction. 2). Due to the low temperature condition that is favorable to reactions 1 and 2, Mathews et al. (2013) have suggested that DCO+ is a good tracer of the disk midplane near the CO snow–line. The latter represents a line dividing regions where the disk is warm enough for CO to be in the gas phase and regions where the temperatures are low enough for CO to be depleted on the grains.
However, modeling the chemical structure of a protoplanetary disk is not trivial as the chemistry depends of the physical environment (e.g. Dutrey et al., 2014; Aikawa et al., 2002) ; and DCO+ may form independently of H2D+ though reactions with CH2D+ under warmer conditions (typically T 50K, see e.g. Wootten, 1987). In particular, in warm conditions the CH2D+ ion is mainly formed by
| (3) |
Reactions involving CH2D+ or one of its products, such as reaction
| (4) |
and
| (5) |
can significantly contribute to the formation of DCO+.
Until now, the zero point vibrational energy difference between the products and reactions, E, of reaction 3 was estimated to be 370 K (Smith et al., 1982). However, Roueff et al. (2013) have recently revised the energy budget of reaction 3 and estimate an exothermicity E of 654 K, which is about a factor 2 larger than the previous estimate. This finding implies that CH2D+ can become enhanced even at temperatures as high as 300 K. As a consequence, the DCO+ formation rate could also be increased. Incidentally, using Plateau de Bure Interferometer observations of the DM Tau disk, Teague et al. (2015) have recently pointed out that DCO+ can be used as a potential tool to diagnostic ionization in disks. This leads one to ask how the change of exothermicity affects the deuterium chemistry and hence, whether DCO+ is a reliable tracer of ionization in disk or, of the CO snow line as previously suggested by Mathews et al. (2013).
2 Modeling
We use the (1+1)–dimensional disk model of Fogel et al. (2011) to investigate the main formation pathways of DCO+. The physical structure and reaction network are described below.
2.1 Disk Structure
In this study, a two–dimensional and azimuthally symmetric disk physical structure that represents a T-Tauri disk has been adopted (i.e. structure of the TW Hya T-Tauri system see Cleeves et al., 2013; Schwarz & Bergin, 2014, and references therein). Being the same settled disk structure as the one adopted by Schwarz & Bergin (2014), we simply refer to this paper for a complete description of the density/temperature structure and grain distribution.
2.2 Chemical reaction network
We use the same deuterated chemical network as in Aikawa et al. (2012), who worked on star forming cores, except for the following updates and modifications needed for disk chemistry: i) the energy barriers of the endothermic reactions involving the CH2D+ ion are updated following Roueff et al. (2013). ii) The X-ray ionization of H2 and He along with UV photolysis induced by X-rays are included (Fogel et al., 2011). iii) Ly photodesorption radiation on dust grain is taken into account (see Fogel et al., 2011; Bethell & Bergin, 2011, for further details). iv) CO, H2, HD and D2 self-shielding are included in a time-dependent way (see Fogel et al., 2011). v) Finally, grain surface reactions are limited to the formation of H2, OH and H2O since gas-phase chemistry prevails in the DCO+ formation.
The network contains in total 1565 species and 43353 reactions111To process faster the data GNU parallel (Tange, 2011) was used along with our code.. Among the reactions listed above, the model also includes grain surface recombination reactions, adsorption, photodesorption, two body reactions (including ion, molecule, negative ion, neutral), cosmic–ray ionization (=1.310-17 s-1), cosmic-ray induced photo-dissociation of ice, photolysis, thermal desorption, non-thermal desorption (i.e cosmic-ray evaporation), gas phase and grain surface photodissociation (see Hasegawa & Herbst, 1993; Garrod et al., 2008; Fogel et al., 2011; Aikawa et al., 2012, for further details). Incidentally, in our analysis, following Garrod & Herbst (2006), we assume a CO binding energy set to 1150 K (which corresponds to a desorption temperature of about 21–25K, see Supplementary Materials of Cleeves et al., 2014). Therefore, the CO snow-line from our model is shifted by several AU in comparison with Schwarz & Bergin (2014). Although, the chemical evolution of the disk is run independently (i.e. 1–D vertical model), the code was run for a given range of radii resulting in a pseudo two-dimensional result as described by Schwarz & Bergin (2014) and Fogel et al. (2011). The gas-grain chemical model is run for 3106 years (typical disk age) with 45 vertical zones and 22 radial zones.
3 Results
3.1 Disk chemical abundances
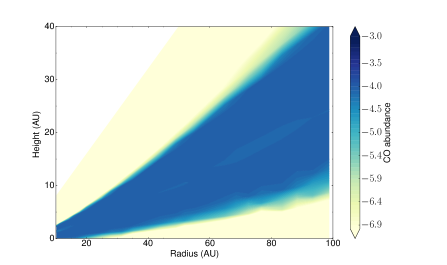
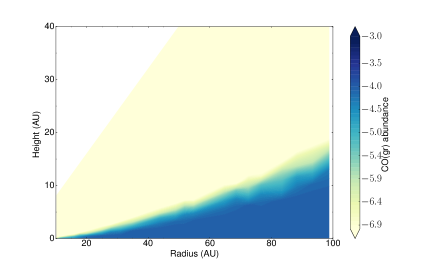
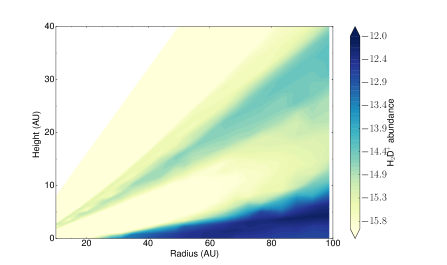
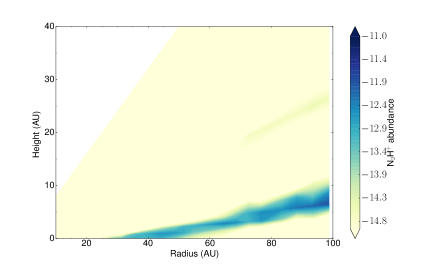
In Figure 1, we illustrate where the CO snow line is in our model by showing the relative abundance to molecular hydrogen for CO, COice and N2H+. The latter ion has been reported to be a good tracer of the CO snow line since it is destroyed by gas phase CO through reaction 6 (i.e. Hersant et al., 2009; Qi et al., 2013; Schwarz & Bergin, 2014).
| (6) |
Our model is consistent with this interpretation.
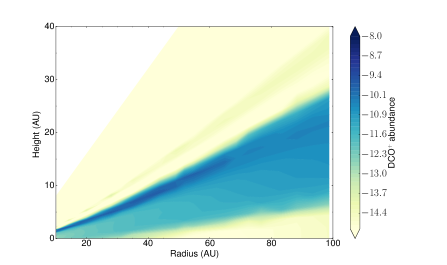
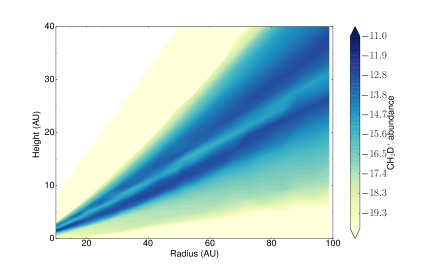
In Figure 1, we also show the relative abundance to molecular hydrogen for DCO+ along with the one of its 2 potential key precursors, CH2D+ and H2D+ (see Reactions 2 and 3). It is immediately apparent that H2D+ probes the CO snow line as expected from reaction 2. Indeed, the H2D+ distribution is clearly anticorrelated with the one of CO since H2D+ is located beyond the CO snow line (i.e where CO is adsorbed on ice grain mantles) and in the upper disk layers where the CO is photodissociated. As for CH2D+, it is more abundant in the upper disk layers where ionization supplied by X-rays is higher. Regarding the overall distribution of the DCO+ abundance, it is more or less correlated with that of CO, with one important exception: there is a greater concentration in the surface of the inner disk. More specifically, the DCO+ distribution is not restricted to the CO snow line but rather spreads up to the disk surface with a maximal abundance reached in the inner warmer (T 50-100K) surface layers (see Fig. 1).
3.2 On the DCO+ formation pathways
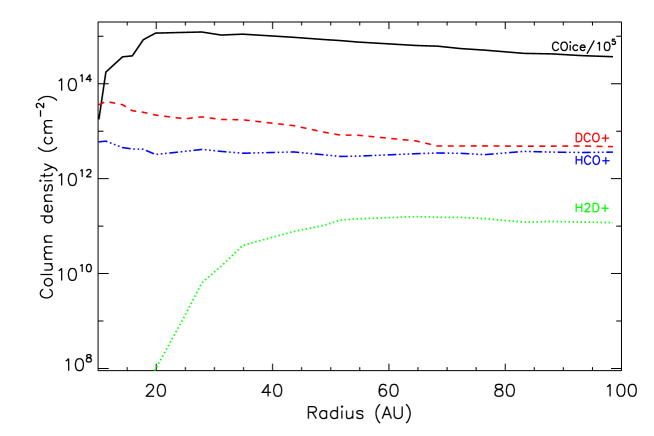
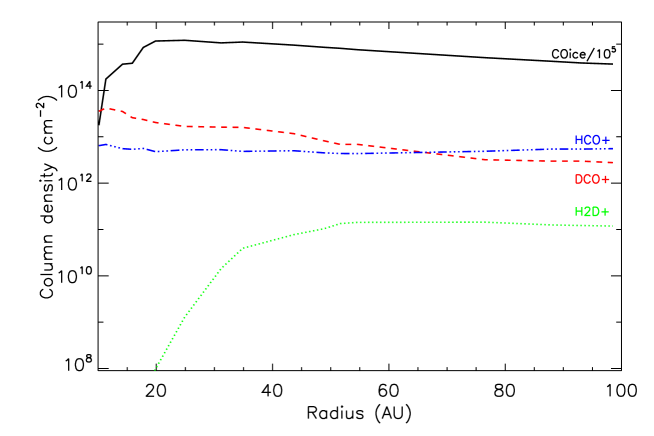
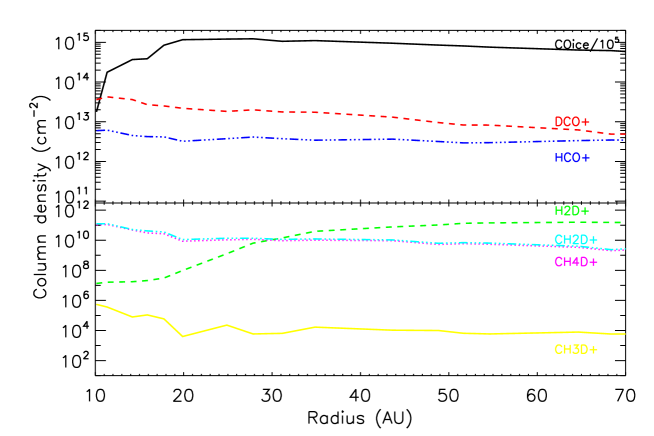
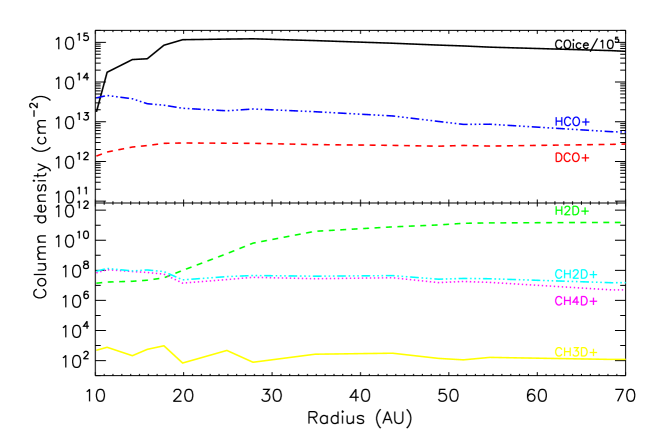
Reaction 2, involving H2D+, is usually considered as the main source of DCO+ in disks at low temperatures (see Mathews et al., 2013). If this is the case, the qualitative distribution of DCO+ abundance should resemble that of CO. However, as shown in Figure 1, the bulk of the DCO+ abundance is located in a narrow layer near the surface. This finding suggests that reaction 2 is not the only formation route for DCO+ in disks. This is further illustrated in Figure 2 that shows the DCO+, HCO+, COice and H2D+ column densities as a function of the radius when reaction 2 is activated (top panel) and turned off (bottom panel)222When switching off reaction 2, we keep reactions and unchanged.. The DCO+ profile remains almost the same in the inner 60 AU whether the H2D+ channel (reaction 2) is involved or not. Further out, reaction 2 contributes for about 40 in the DCO+ abundance, the other main contribution being through HCO+ (via the reaction , Aikawa et al. in prep.).
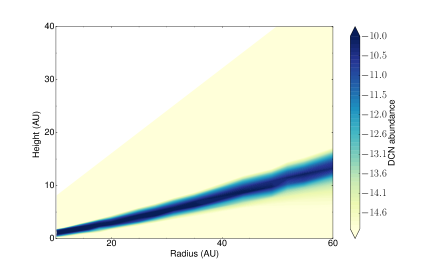
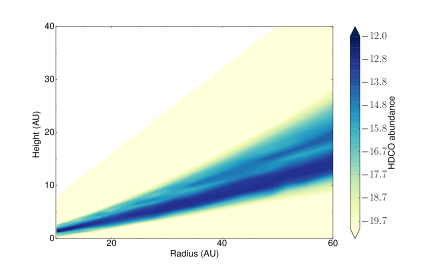
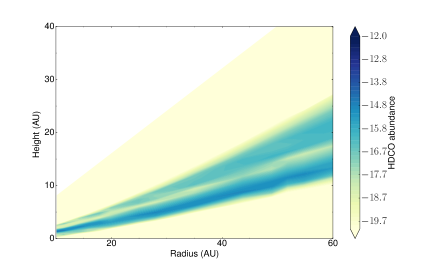
One notable feature of Figures 3 and 4 is that the formation of DCO+ in the inner surface layers inside of 60 AU involves CH2D+ or one of its product that have previously been created by reaction 3. Indeed, Figure 3 shows the abundance of the DCO+ ion for up to the 60 AU when reaction 3 is activated (left panel) and turned off (right panel). It is immediately apparent that reaction 3, which involves the CH2D+ channel, leads to the observed maximal DCO+ abundance in the inner surface layers of the disk. Likewise, a similar result is observed on the abundance profiles of DCN and HDCO (see Figure 3), molecules that can both also be formed through reaction 3. In addition, in Figure 4, we give the radial distribution of some key ions (such as CH2D+ and CH4D+) that can lead to the formation of DCO+ along with the one for H2D+ when reaction 3 is activated (top panel) and turned off (bottom panel). A decrease in the DCO+, CH2D+, CH3D+ and CH4D+ column density is clearly observed when reaction 3 is not activated in our network. Finally, we find that more than 80 of the DCO+ abundance in the inner 60 AU surface layers is due to a DCO+ formation through the reactions 3, 4 and 5 pathway.
3.3 DCO+ abundance and exothermicity
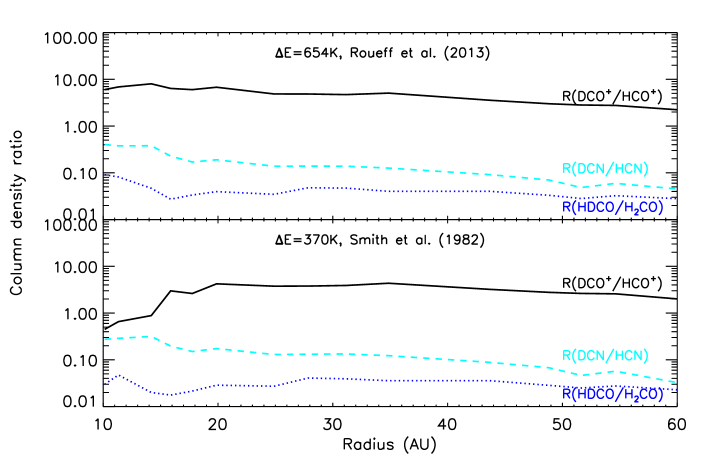
In Figure 5, we show that the use of the new exothermicities leads the warm channel (i.e. reaction 3) to dominate in the DCO+ production. More specifically, Fig. 5 illustrates the impact, within the inner disk, of the change of exothermicity on the DCO+/HCO+ abundance ratio but also on that of other easily observable molecules (DCN, formaldehyde). One notable feature is that the abundance of DCO+, DCN and HDCO is enhanced in the 20 AU inner radii when the chemical modeling includes the new exothermicities set by Roueff et al. (2013, E of 654 K for reaction 3) as opposed to the chemical modeling that includes the previous ones (E = 370 K, see Smith et al., 1982). Furthermore, it is immediately apparent that within the 20 AU inner radii the distribution of the DCO+/HCO+ abundance ratio is affected by the change of exothermicity: the latter does not increase with increasing radius while using the most recent exothermicities (Roueff et al., 2013), whereas assuming a lower exothermicity (i.e. the one of Smith et al., 1982) the ratio shows a rise with increasing radius in the inner disk.
4 Discussion
4.1 The effect of the exothermicity in the CH2D+ formation
Our results are a consequence of the increase in the exothermicity E of reaction 3, as suggested by Roueff et al. (2013), which favors deuterium fractionation in warm gas, up to temperatures even as high as T 300 K. We note that in the case of DCO+ only, which has its main formation route from channel 5 and, for an exothermicity of 654 K, a temperature 71 K is hot enough to turn off the DCO+ enrichment toward the inner disk. Indeed, the activation of the backward reaction is shifted to higher temperatures, enabling efficient deuteration closer to the star. This is a nice illustration of the influence of the energy budget of deuteration reactions. This is similar to the well known effect of the H2 ortho/para ratio on deuterium chemistry (see e.g. Flower et al., 2006): at low temperature, the backward counterpart of reaction 1 is strongly favored for ortho-H2 over para-H2, due to a lower for the former. However, we did not consider the spin states of H2 in the present study. DCO+ being mainly produced by reaction 3 , we do not expect this omission to be of crucial importance in the present case (see Sect. 4.4 for further details).
4.2 DCO+ a probe of ionization rather than the CO snow line
DCO+ has been proposed to be a good tracer of the CO snow line by Mathews et al. (2013), assuming H2D+ as its parent molecule. However, our study points out that the reaction which involves H2D+ as a parent molecule (see reaction 2) is unlikely to be the main formation route that leads to the bulk of the DCO+ abundance within the disk. Alternatively, our study shows that reactions involving CH2D+ as a parent molecule of DCO+ (see reaction 3 and reactions 4 and 5 as possible pathways for the formation of DCO+) are responsible for the observed high abundance of DCO+ in the inner surface layers of the disk. This finding leads us to argue that, instead of temperature, DCO+ is rather tracing ionization. Indeed, the distribution of the DCO+ abundance is similar to the one of CO except for its high abundance in the the inner warmer surface layers of the disk where ionization through X-rays is present. In that respect, we predict that DCO+ is a tracer of the inner tens of AU of protoplanetary disks surrounding X-ray active T Tauri stars.
4.3 Implications: on the production of other deuterated molecules
Chemical pathways involving the CH2D+ channel (reaction 3) can sufficiently lead to the formation of different deuterated molecules, such as DCO+, DCN, HDCO in warm conditions (e.g. T70–100 K, see Wootten, 1987; Öberg et al., 2012). In that context, our study not only shows that the high abundance of DCO+ in the inner disk results from pathways involving the CH2D+ ion as a parent molecule, but in addition shows that the DCN and HDCO abundance patterns are also affected by the change of exothermicity (see Figs 3 and 5). Indeed, the DCN and HDCO abundances are enhanced while using the CH2D+ formation route with the most recent exothermicities (E=654 K, Roueff et al., 2013).
4.4 Implications: on the specific structure of protoplanetary disks
Interestingly enough, from their ALMA observations, Mathews et al. (2013) analyzed the DCO+ emission in the disk surrounding HD 163296 as coming from a narrow (confined between 110 and 160 AU) ring-like structure. Although the radial extent of the ring may be subject to revision (Qi et al., in prep), such a narrow ring, located far from the star, is difficult to reconcile with our modeling. Likewise, based on SMA observations (Qi et al., 2008) of the TW Hydrae disk and empirical fitting of the data, Öberg et al. (2012) find a central depression and inferred a DCO+ abundance profile that increases with abundance with the radius. These suggestions disagree with our results, since we find that with a higher activation barriers (Roueff et al., 2013) the warm channel (reaction 3) dominates, leading to a strong abundance of DCO+ in the inner regions of the disk.
One possible caveat could be the ortho:para ratio. Teague et al. (2015) have investigated the effect of the ortho:para ratio on the deuterium fractionation and have found that, by a million years, the o:p ratio is low. However, assuming a higher o:p ratio might change our results by reducing the deuterium enhancement. Roueff et al. (2013) show that the exothermicity in reaction 3 is reduced if there is significant amount of ortho-H2 present in the gas (see Table 3 of Roueff et al., 2013). As a result, the backward reaction is actually comparable to the old warm channel rates (Smith et al., 1982). Thus, one way to chemically mimic a hole in the DCO+ distribution is to have a gradient in the o:p ratio in the disk which is higher in the inner regions and lower in the outer disk.
Another possible caveat could be the ionization structure. The presence of structure in the inner disk could perhaps prevent the propagation of the X–ray photons in the inner disk and may lead to a reduced production of DCO+. However, this effect may not be as important for the more substantially flared outer disk.
Finally, the disk surrounding HD 163296 is much warmer than our TW Hydrae disk model. In this disk, the CO snow line is located around 150 AU (Qi et al., 2011), while it is around 20 AU in our model. Another possibility would thus be that the HD 163296 disk is warm enough (T71 K) and/or present a higher o:p ratio to enable endothermic reactions to prevent deuterium fractionation in the inner 100 AU, thereby truncating the DCO+ layer. Direct modeling of the DCO+ chemistry in the warm disk surrounding HD 163296 would be necessary for further comparisons. In any case, further observations of HD 163296 and TW Hya are required to understand the DCO+ distribution, at the light of our new DCO+ formation pathway.
5 Conclusions
To summarize, our study shows that the high abundance of DCO+ in the inner surface layers of the disk results from CH2D+ as a parent molecule. The latter being efficiently formed through reaction 3 in warm conditions (typically T71 K). As a consequence we suggest that DCO+ is a reliable tracer of ionization in the inner warm disk surface. Furthermore, the change in exothermicity, in the instance of a low o/p ratio, leads to enhancements of other tracers including DCN and HDCO.
References
- Aikawa & Herbst (1999) Aikawa, Y., & Herbst, E. 1999, ApJ, 526, 314
- Aikawa et al. (2002) Aikawa, Y., van Zadelhoff, G. J., van Dishoeck, E. F., & Herbst, E. 2002, A&A, 386, 622
- Aikawa et al. (2012) Aikawa, Y., Wakelam, V., Hersant, F., Garrod, R. T., & Herbst, E. 2012, ApJ, 760, 40
- Bethell & Bergin (2011) Bethell, T. J., & Bergin, E. A. 2011, ApJ, 739, 78
- Cleeves et al. (2013) Cleeves, L. I., Adams, F. C., & Bergin, E. A. 2013, ApJ, 772, 5
- Cleeves et al. (2014) Cleeves, L. I., Bergin, E. A., Alexander, C. M. O. D., et al. 2014, Science, 345, 1590
- Dutrey et al. (2014) Dutrey, A., Semenov, D., Chapillon, E., et al. 2014, Protostars and Planets VI, 317
- Flower et al. (2006) Flower, D. R., Pineau Des Forêts, G., & Walmsley, C. M. 2006, A&A, 449, 621
- Fogel et al. (2011) Fogel, J. K. J., Bethell, T. J., Bergin, E. A., Calvet, N., & Semenov, D. 2011, ApJ, 726, 29
- Garrod & Herbst (2006) Garrod, R. T., & Herbst, E. 2006, A&A, 457, 927
- Garrod et al. (2008) Garrod, R. T., Weaver, S. L. W., & Herbst, E. 2008, ApJ, 682, 283
- Guilloteau et al. (2006) Guilloteau, S., Piétu, V., Dutrey, A., & Guélin, M. 2006, A&A, 448, L5
- Hasegawa & Herbst (1993) Hasegawa, T. I., & Herbst, E. 1993, MNRAS, 261, 83
- Hersant et al. (2009) Hersant, F., Wakelam, V., Dutrey, A., Guilloteau, S., & Herbst, E. 2009, A&A, 493, L49
- Mathews et al. (2013) Mathews, G. S., Klaassen, P. D., Juhász, A., et al. 2013, A&A, 557, A132
- Mumma & Charnley (2011) Mumma, M. J., & Charnley, S. B. 2011, ARA&A, 49, 471
- Öberg et al. (2011a) Öberg, K. I., Qi, C., Wilner, D. J., & Andrews, S. M. 2011a, ApJ, 743, 152
- Öberg et al. (2012) Öberg, K. I., Qi, C., Wilner, D. J., & Hogerheijde, M. R. 2012, ApJ, 749, 162
- Öberg et al. (2010) Öberg, K. I., Qi, C., Fogel, J. K. J., et al. 2010, ApJ, 720, 480
- Öberg et al. (2011b) —. 2011b, ApJ, 734, 98
- Pagani et al. (1992) Pagani, L., Salez, M., & Wannier, P. G. 1992, A&A, 258, 479
- Qi et al. (2011) Qi, C., D’Alessio, P., Öberg, K. I., et al. 2011, ApJ, 740, 84
- Qi et al. (2013) Qi, C., Öberg, K. I., & Wilner, D. J. 2013, ApJ, 765, 34
- Qi et al. (2008) Qi, C., Wilner, D. J., Aikawa, Y., Blake, G. A., & Hogerheijde, M. R. 2008, ApJ, 681, 1396
- Roueff et al. (2013) Roueff, E., Gerin, M., Lis, D. C., et al. 2013, Journal of Physical Chemistry A, 117, 9959
- Schwarz & Bergin (2014) Schwarz, K. R., & Bergin, E. A. 2014, ApJ, 797, 113
- Smith et al. (1982) Smith, D., Adams, N. G., & Alge, E. 1982, ApJ, 263, 123
- Tange (2011) Tange, O. 2011, ;login: The USENIX Magazine, 36, 42
- Teague et al. (2015) Teague, R., Semenov, D., Guilloteau, S., et al. 2015, A&A, 574, A137
- van Dishoeck et al. (2003) van Dishoeck, E. F., Thi, W.-F., & van Zadelhoff, G.-J. 2003, A&A, 400, L1
- Watson (1976) Watson, W. D. 1976, Reviews of Modern Physics, 48, 513
- Wootten (1987) Wootten, A. 1987, in IAU Symposium, Vol. 120, Astrochemistry, ed. M. S. Vardya & S. P. Tarafdar, 311–318