The importance of the cosmic web and halo substructure for power spectra
Abstract
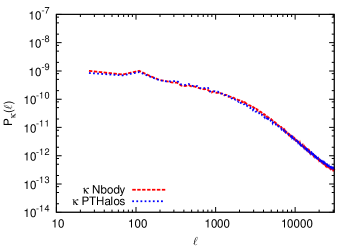
In this work we study the relevance of the cosmic web and substructures on the matter and lensing power spectra measured from halo mock catalogues extracted from the N-body simulations. Since N-body simulations are computationally expensive, it is common to use faster methods that approximate the dark matter field as a set of halos. In this approximation, we replace mass concentrations in N-body simulations by a spherically symmetric Navarro-Frenk-White halo density profile. We also consider the full mass field as the sum of two distinct fields: dark matter halos (/h) and particles not included into halos. Mock halos reproduce well the matter power spectrum, but underestimate the lensing power spectrum on large and small scales. For sources at the lensing power spectrum is underestimated by up to 40% at with respect to the simulated halos. The large scale effect can be alleviated by combining the mock catalogue with the dark matter distribution outside the halos. In addition, to evaluate the contribution of substructures we have smeared out the intra-halo substructures in a N-body simulation while keeping the halo density profiles unchanged. For the matter power spectrum the effect of this smoothing is only of the order of 5%, but for lensing substructures are much more important: for the internal structures contribute 30% of the total spectrum. These findings have important implications in the way mock catalogues have to be created, suggesting that some approximate methods currently used for galaxy surveys will be inadequate for future weak lensing surveys.
keywords:
Gravitational lensing: weak - methods: analytical, numerical, statistical - cosmology: theory, large-scale structure of Universe1 Introduction
One of the most important ways to study the growth of cosmological structure and infer the nature of gravity is to use gravitational lensing. Lensing arises from the deflection of light rays due to structures along the line-of-sight between the source and the observer. In particular, weak gravitational lensing measures the shear effect produced by the large scale structures in the Universe on the background galaxies, making it an effective tool to evaluate the total matter in the universe. Weak lensing observations are steadily improving (Kilbinger et al., 2013; Simpson et al., 2013; Van Waerbeke et al., 2013; Fu et al., 2014; Kitching et al., 2014) and on-going and future surveys such as KIDS111http://kids.strw.leidenuniv.nl, DES222http://www.darkenergysurvey.org, Pan-STARRS333http://pan-starrs.ifa.hawaii.edu, LSST444http://www.lsst.org and Euclid555http://www.ias.u-psud.fr/imEuclid (Laureijs et al., 2011; Amendola et al., 2013) will be able to probe the growth of structures and the expansion history to a very high precision. Such a precise determination of the growth of structures will provide constraints on the underlying cosmological model and probe whether General Relativity is a good description of the Universe (with cosmological constant or some form of dark energy) or whether modifications of gravity are required.
Theoretical expectations of weak lensing on small scales are often based on raytracing through simulations (Pace et al., 2007; Hilbert et al., 2009; Fedeli et al., 2011; Hartlap et al., 2011; Pace et al., 2011; Pace et al., 2015), where light rays are shot from the observer to distant sources through the matter distribution of an N-body simulation. These simulations are useful to probe lensing statistics for different cosmological models and highlight differences in the non-linear regime that are usually not accessible via analytical techniques. Many lensing studies have focused on the properties of the probability distribution function (PDF) of the effective convergence and shear (Munshi & Jain, 2000; Taruya et al., 2002; Valageas, 2000a, b; Ménard et al., 2003; Valageas & Munshi, 2004; Valageas et al., 2004; Takahashi et al., 2011), on how to model it numerically (Kainulainen & Marra, 2009, 2011; Marra et al., 2013), how to combine it with other cosmological probes (Song et al., 2011; Munshi et al., 2014a, b) and on tomography (Munshi et al., 2014c).
Much attention is also devoted to the study of lensing properties of a given mass density profile for dark matter halos (Bartelmann, 1996; Oguri & Hamana, 2011; Retana-Montenegro & Frutos-Alfaro, 2011; Retana-Montenegro et al., 2012a; Retana-Montenegro et al., 2012b) as according to N-body simulations, halo density profiles can be parametrised with a universal function (Navarro et al., 1996, 1997; Gao et al., 2008). In addition, the halo density profile is one of the main ingredients for the halo model (Scherrer & Bertschinger, 1991; Seljak, 2000; Cooray & Sheth, 2002; Sheth & Jain, 2003); halo model applications for lensing include calculating the lensing power spectrum (Cooray et al., 2000; Takada & Hamana, 2003; Kainulainen & Marra, 2011), the influence of substructures (Giocoli et al., 2008; Giocoli et al., 2010), and the modelling of the intrinsic alignments (Schneider & Bridle, 2010) and their effects on the lensing power spectrum (Ciarlariello et al., 2014). Conversely, lensing can be used to constrain elements of the halo model (Cacciato et al., 2012; Velander et al., 2014).
Halo modelling also plays an important role in creating fast realisations of large scale structure that can play an
important role in modelling observations of large scale structure and particularly their covariances.
Many different techniques have been put forward exploiting halo modelling.
Coles &
Jones (1991) and Cole
et al. (2005) used the log-normal model to generate mock catalogues; Chuang et al. (2015)
used an approach based on the Zel’dovich approximation to create mock catalogues that can accurately reproduce the
one-point, two-point, and three-point statistics;
Scoccimarro &
Sheth (2002) and Manera
et al. (2013) used the 2LPT formalism to create matter density fields from which halo
catalogues were extracted (PTHalos). de la Torre &
Peacock (2013) instead used a method based on the sampling of the mass
function to create halos under the limit resolution of the halos;
Tassev et al. (2013, 2015) used a method based on Lagrangian Perturbation Theory (LPT) and similar methods were
used by (Monaco et al., 2002a; Monaco
et al., 2002b; Taffoni
et al., 2002; Monaco et al., 2013).
A compilation of some of the fast methods for generating mock catalogues can be found in Chuang et al. (2014).
Other techniques, based on remapping the halos from a simulation with a given cosmology to catalogues with a different
cosmological background, have also been developed (Mead &
Peacock, 2013).
Finally, methods to generate mock catalogues on a spherical surface by using a real distribution were also used for
the 2MASS Redshift Survey (2MRS) catalogue (De Domenico &
Lyberis, 2012).
Halo model techniques have been tuned to reproduce galaxy clustering surveys, where they are exploited to calculate covariances of observations. It is important to understand whether they are similarly accurate for lensing surveys, as they can potentially be used to calculate not only lensing covariances, but also potential cross correlations and covariances for joint lensing and galaxy observations. Here we attempt to answer this question.
To do this, we create a convergence field using the halo catalogue extracted with a Friend-of-Friend (FoF) technique from an N-body simulation and compare its power spectrum with the convergence spectrum from the original N-body particles. We assume that the halos are well described by a Navarro-Frenk-White (NFW) density profile. In this way we can quantify the accuracy with which the halo catalogue reproduces the numerical simulation results, and on which scales we can rely on analytical methods.
We also study the importance of substructures in the simulated halos. To do so, we randomly rotate the particles in a halo while keeping them always at the same distance from the centre. In this way coherent subhalos are erased while the density profile of the halo remains unchanged. This creates numerical halos more similar to the analytical ones, since the NFW profile doesn’t include the presence of substructures.
Finally we explore how well fast halo catalogue techniques are able to reproduce full N-body simulations and the halo catalogues extracted from them. In particular, we focused on the PTHalos technique, based on realisations of the 2LPT field (Manera et al., 2013) and compare its results with N-body simulations.
We begin in Sect. 2 with a brief description of the N-body simulations, and the implementation of the halo modelling, based on an NFW profile. In the following section, we compare the full N-body statistics to those derived from the halo catalogues, focusing in particular on the matter power spectrum (Sect. 3.1) and the lensing convergence spectrum (Sect. 3.2) and explore the impact of halo substructure. In Sect. 4 we investigate the effectiveness of a fast halo method, PTHalos, for calculating these statistics. Finally in Section 5 we study the effectiveness of the optimal weight on lensing statistics, when only mock catalogues for halos are available, before drawing conclusions in Section 6.
2 Simulations and the halo model
The aim of this work is to compare results from N-body simulations with mock catalogues from a statistical point of view, focusing in particular on the matter and lensing power spectra. We begin by describing the N-body simulations that will be the basis of the halo catalogues and the methods we use to approximate them using a halo model approach.
2.1 N-body simulations
We use the LasDamas666http://lss.phy.vanderbilt.edu/lasdamas N-body simulations (McBride et al., 2009, 2011), created with the publicly available code GADGET-II (Springel, 2005). In particular we use the suite of realizations called Oriana; the Oriana suite, an ensemble of 40 independent realizations of the dark matter distribution in the Universe, studies the dark matter particles evolution in a box of 2.4 Gpc/h comoving filled with particles. The mass resolution is and the corresponding softening length is 53 kpc/h comoving. Initial conditions were created at using the 2LPT formalism in order to take into account very early non-linearities and therefore to be more accurate than the usual Zel’dovich approximation (Crocce et al., 2006). The initial linear power spectrum was created using the CMBFAST code (Seljak & Zaldarriaga, 1996). In Table 1 we show the cosmological parameters adopted for the Oriana simulations.
| Cosmological Parameter | Value |
|---|---|
| Baryon density | 0.04 |
| Matter density | 0.25 |
| Cosmological constant density | 0.75 |
| Hubble parameter | 0.7 |
| Spectral index | 1.0 |
| Power spectrum normalization | 0.8 |
Within the simulations, halos are identified using a parallel Friends-of-Friends (FoF) algorithm (Davis et al., 1985) implemented within the Ntropy framework (Gardner et al., 2007b, a). The linking length adopted is 0.2 times the mean inter-particle distance.
In Fig. 1 we show the mass function of the Oriana simulation used in this work, evaluated from the FoF catalogue. We show the number of objects above a given mass. A halo is defined as an object with at least 20 particles linked together, therefore the minimum mass probed is . As we show below, the sampled catalogue does not contain all of the galactic mass objects that might be contributing to the matter or lensing signal.
Below, we also explore whether halo locations and masses derived using spherical overdensity (SO) techniques differ significantly from the Friends-of-Friends method. However the halos are identified, all information about the internal structure of the halos is lost once the mock halo catalogues are constructed. One main goal is to quantify whether this simplification makes it impossible to recover the density and lensing spectra.
2.2 The halo model approach
To analytically model the simulated halos, we describe them as spherically symmetric objects characterised by a Navarro-Frenk-White (NFW) density profile (Navarro et al., 1996, 1997), whose functional form is:
| (1) |
where and is the critical density and . The density is related to the virial mass of the halo, . The over-density is sometimes referred to the background comoving density. The quantity is the scale radius and it is related to the virial radius (the radius of the halo) via the concentration parameter , . In particular, the relation between and is
| (2) |
and is the dimensionless mass of the NFW halo:
| (3) |

The only remaining unknown quantity is the concentration parameter . Many studies in the literature (Navarro et al., 1997; Bullock et al., 2001; Eke et al., 2001; Neto et al., 2007; Duffy et al., 2008; Gao et al., 2008; Macciò et al., 2008; Muñoz-Cuartas et al., 2011; Prada et al., 2012; Bhattacharya et al., 2013; Ludlow et al., 2013) have been devoted to the study of the dependence of the concentration parameter on the mass and on the redshift of the halo. Because low mass objects are formed earlier, when the average density of the universe was higher, they tend to have higher concentrations than higher mass objects. In this work we adopt the original concentration-mass relation established by Navarro et al. (1997); however, the exact recipe adopted to evaluate the concentration does not greatly alter our results. Differences of order of a few percent appear in the convergence power spectrum on non-linear scales, with the prescription by Navarro et al. (1997) giving more power than the Bullock et al. (2001) and Eke et al. (2001) recipe.
A useful feature of the NFW density profile is that many lensing quantities, and in particular the convergence, have an analytical expression (see Bartelmann, 1996; Wright & Brainerd, 2000). The convergence is defined as the integral, along the line of sight, of the density profile scaled by the critical density and weighted by a function that depends on the relative distance of the lensing system components (observer, lens and source). Defining the projected matter density and the critical density , the effective convergence is therefore . Here, and represent the speed of light and the gravitational constant, while the inverse of the lensing efficiency in the definition of the critical density is given by the combination of three angular-diameter distances, , and , representing the distance between the observer and the source, the observer and the lens and the lens and the source, respectively. Finally, the vector represents the angular position on the lens plane.
The radial dependence of the surface mass density (justified by the spherical symmetry) is
| (4) |
where we have defined . Note that all these equations imply a smooth inner profile, where substructures (density peaks inside the halos) do not play any role. For the comparison between the lensing signal of the numerical and analytical halos we will rely on Equation 4 and we will show its accuracy and limitations for both N-body (see Sect. 3.2) and 2LPT simulations (see Sect. 4.4).
3 Reproducing the N-body results
In this section we study the statistical properties of the matter distribution in the simulated box at , focussing on the matter power spectrum (see Sect. 3.1) and the lensing signal (see Sect. 3.2).
We use a number of techniques to explore the impact of the substructure, and in particular how the halo catalogues perform in reproducing the density statistics. We directly compare the full N-body results to the FoF halo catalogues; to get comparable results, the halo catalogue must be rescaled appropriately as explained later so that its average density is the same as the N-body. We also divide the particles in the simulation into two different groups: those particles in halos (PIH) that, according to the FoF algorithm, build up the halos, and the particles outside the halos (POH) that contain the remaining particles. In terms of the particle numbers, it follows that . This division also allows us to directly test the impact of treating the halos as spheres.
To further probe the effects of halo substructure, we consider the impact of randomly rotating the positions of the PIH around the associated halo centres. We do this either by coherently rotating the particle positions, such that halo substructure is preserved, or by randomly rotating the individual particles while preserving their distances to the halo centres. In the first case, the power in the internal structures should remain unchanged, while the cross-correlations between the substructure and the cosmic web could be suppressed. In the second case, the substructures are erased and the halos become effectively spherical, but their radial distributions are not fixed to a particular profile, as in the NFW halo catalogue.
3.1 3D matter power spectrum
The 3D matter power spectrum represents an important statistical tool to probe the growth of fluctuations and the underlying cosmological model. To evaluate the matter power spectrum using the particle distribution in the simulated box, we divide the box volume into 5123 voxels and we assign each dark matter particle to the corresponding voxel using a Nearest Grid Point (NGP) assignment scheme (Hockney & Eastwood, 1988). Once the discretized volume is created, we Fourier transform it and multiply it by its complex conjugate, according to the definition of the matter power spectrum
| (5) |
In the previous equation represents the three-dimensional Dirac’s delta and the matter overdensity. For our analysis, the Nyquist frequency is h/Mpc.
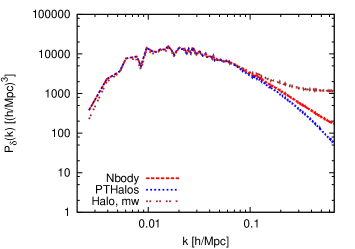
A similar procedure is carried out to evaluate the mass-weighted matter power spectrum of the FoF halos where we assign the mass of each halo to the corresponding voxel determined according to the position of the halo as given in the catalogue. The comparison between the matter power spectrum from N-body and the mass-weighed spectrum is shown in Fig. 2. We also evaluate the shot-noise term due to the finite number of halos in the catalogues. The halo shot noise is evaluated as , where is the number density of the FoF halos. The shot-noise due to the finite number of particles in the simulated box is negligible.
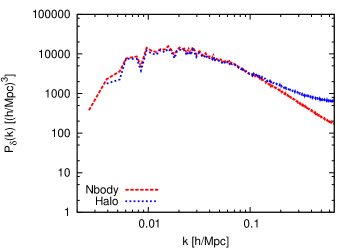
The two spectra agree very well on large scales where the linear regime is still valid; this is obtained with an appropriate amplitude rescaling of the halos power spectra to take into account the different effective matter densities of the two fields (multiplying the halo spectrum by the factor squared). Obviously the agreement is limited only to a restricted range of frequencies h/Mpc, corresponding to the modes where the non-linear matter power spectrum starts to deviate from the linear prediction. For higher modes, we notice a flattening in the halo matter power spectrum, due to the shot noise term that dominates for high .
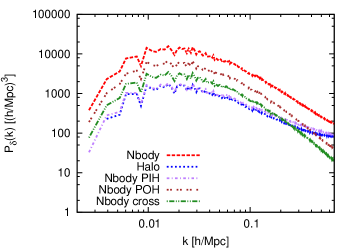
As introduced above, we can divide the particles in the simulation in two different groups: the particles in the halos (PIH) and the particles outside the halos (POH). In Fig. 3 we show the power spectra for the different contributions (PIH, POH, halos and the cross-correlation between the PIH and the POH). For the FoF halo identification method described above, most of the particles are outside the halos; the effective matter densities are and . As a test of consistency, we checked that summing up the three spectra (particles inside and outside the halos and its cross-correlation) we obtain the full three-dimensional matter power spectrum.
Both the POH and the PIH show power on all scales, and are strongly correlated with one another. While the bias in the power spectrum of the halo particles is stronger, the amplitude shown is considerably lower since this reflects the different effective matter densities of each component. On linear scales, the spectra of the particles inside and outside the halos agree after a suitable rescaling of the amplitude due to the different effective matter density parameters. Particles in halos dominate the power seen at high ; the slope in the non-linear regime for the PIH spectrum is shallower because the non-linear (one-halo) structures contribute to it. Not surprisingly, there is very good agreement between the power spectra evaluated from the halo catalogue and the particles building the halos. The agreement is excellent up to very non-linear scales ( h/Mpc) where the shot noise of the halos becomes important.
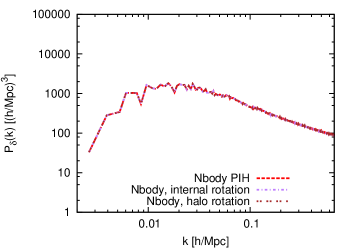
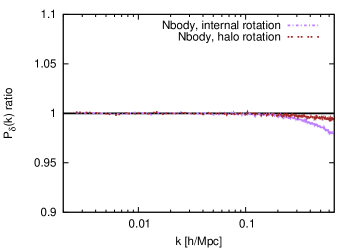
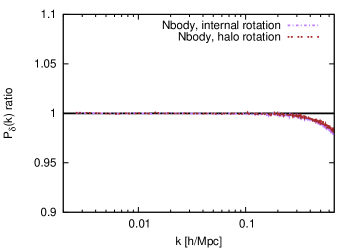
To further evaluate the influence of the internal structure of halos, we rotate the particles about the halo centres as described above, both coherently and incoherently. The results are presented in Fig. 4, compared to the original PIH spectrum. When the halos are rotated coherently, there is very little impact on the power spectrum; a small decrease of power at the non-linear scales (at most 1%) apparently results from missing small correlations between substructures in neighbouring halos. When the positions of individual particles are rotated inside the halos, the halo substructures are wiped out and we notice a decrement in the matter power spectrum of order 2-3% for wavelengths h/Mpc, the highest wavelength we can probe in our analysis.
This shows two things: First, the matter power spectrum is almost completely independent of the halo orientation; what matters most are the halo masses and their positions with respect to other halos (i.e. their correlation function). Second, the power spectrum obtained from the particles in the halos is largely independent of the internal substructures, just showing a decrement at the few percent level. This shows that most of the power in the internal halo distribution lies in the radial profile rather than in smaller substructures. The upper and middle panel in Fig. 4 show that the power in halos is more impacted by the incoherent rotations than by the coherent rotations. This demonstrates that significant power is in either the ellipticity or the substructure of halos. Interestingly also the cross-correlation power spectrum is affected by the rotation of the particles building the halos in a similar fashion to the halo power spectrum. Differences are appreciable once again at small scales and both rotations have very similar quantitative consequences, albeit in slightly smaller amplitude than the halo power spectrum. This is likely due to the induced misalignment between coherent substructures and the cosmic web. It is worth reminding the reader that on small scales, the cross-correlation between PIH and POH is considerably smaller than the autocorrelation of the PIH itself (see Fig. 3), so the halo-cosmic web misalignment has a relatively small impact on the total power. While halo substructures appear to have an effect on the matter power spectrum limited to very small scales, this will not be the case any more for the lensing spectrum, as shown in Sect. 3.2, since this is an integrated quantity. In particular, as a consequence, effects of substructures on the lensing power spectrum will be emphasised.
3.2 Lensing power spectrum
In this section we will study and compare the lensing signal from the full N-body simulation and from the halo catalogue as well.
3.2.1 Creating the lensing maps
In the following we will describe the procedure used to create the lensing maps taking into account the particle distribution or the halos in the FoF catalogue. Unfortunately, we have the matter distribution at a single redshift only, so we are not able to fully ray-trace through an evolving simulation. Since the snapshot represents the simulated matter in a volume of 2.4 Gpc/h comoving, we assume that this same box spans the matter distribution in the universe between and . This is obviously not correct because we do not take into account the gravitational evolution of structures, but it is still a useful exercise to evaluate the signature of the different components under investigation, in particular how substructures will affect the lensing signal.
To create the lensing maps using the particle distribution, we closely follow the procedure outlined in Fosalba et al. (2008), which we refer to for more details. There are two major differences between our maps and the convergence maps created by Fosalba et al. (2008). Since we only have one box at a given redshift, we divide the box into slices, and consider each as an independent snapshot at a different redshift and sum the contributions of all of them after a suitable weighting due to the lensing efficiency. The second difference is that we do not cover the whole sky, but just a portion of it; however, since lensing is a line of sight effect, this is not an issue.
In the widely used Born approximation (Bartelmann & Schneider, 2001; Cooray & Sheth, 2002; Refregier, 2003; Vale & White, 2003), lensing distortions are integrated over the unperturbed photon paths and the effective convergence is simply defined as the weighted projected surface density:
| (6) |
where is the scale factor, the radial distance and the radial position of the lensing sources. In our simulations, we assume all the sources are located at , corresponding roughly to a comoving distance of 2.4 Gpc/h. Finally, represents the angular position on the source and lens plane. Given the effective convergence , it is possible to construct shear, deflection angle and lensing potential maps, though here we limit ourselves to the study of the effective convergence only.
Since the matter distribution is discrete, we can replace the integral in Eqn. (6) with a summation over the lensing planes (Fosalba et al., 2008). The effective convergence at a pixel will therefore be:
| (7) |
where represents the plane separation (the width of the radial bin in Fosalba et al. (2008)). The density in each pixel, for a given lensing plane, , is defined as
| (8) |
where corresponds to the volume associated with the pixel and the mass included in the pixel for each lensing plane . Summing over all the lensing planes, we obtain the final convergence maps.
We checked the numerical stability of our ray-tracing implementation changing the number of lensing planes and the number of pixels on each plane, using either eight or sixteen lensing planes and a resolution of 20482 or 40962 pixels. We evaluated the lensing power spectrum for all the realisations and we obtained identical results. This confirmed the numerical stability of our implementation. In the following we will therefore show results for maps obtained summing up 8 planes and with a resolution of 20482 pixels. To evaluate the angular scale of our convergence maps, we fix a comoving size on the source plane of 500 Mpc/h. This corresponds, in our cosmology, to a field-of-view aperture of 12∘, therefore the pixel resolution is . We cut a cone through the box with side of 0.5 Gpc/h (comoving) in order to remain in the flat-sky approximation. To create more realisations of the effective convergence maps from our single simulation snapshot, we placed the observer in six different faces of the box, so that the power spectrum obtained is the mean of six different realisations.
So far we have described the algorithm we implemented when the matter distribution is represented by the particles in the simulation. Something similar can be done to create the lensing maps for the halos of the FoF catalogue. The FoF catalogue provides for each halo its mass and location, that we assume to represent the centre of the halo. To evaluate the convergence of the halo, we assume that the halos are described by a spherically symmetric NFW profile. Knowing the mass and the redshift of the halo, we infer the virial radius, the concentration parameter and the scale radius and using the equations described in Sect. 2.2, we evaluate the lensing signal as a function of the distance from the centre of the halo. Summing up the contribution from all the halos, we obtain the convergence map. As above, we verified the robustness of the implementation for the halos varying the number of planes and the map resolution; these agree very well, and to be consistent with what we did for the particle distribution, we use eight lens planes and a resolution of 20482 pixels.
We briefly clarify the concentration parameter we adopt for the halos. The concentration parameter for the NFW halo model depends on both the mass and the redshift of the halo; for consistency, when we evaluated the convergence of the halo fields, we used the appropriate relation discussed in Section 2.2. But in our simulation, the halos are all at the same redshift, making therefore the concentration parameter effectively dependent only on the mass. To check the influence of the concentration parameter on the lensing statistics, we constructed the convergence maps in two ways: in the first, we considered the concentration parameter evolving with redshift, while in the second case we modify the concentration accordingly with the mass, but assuming the same redshift for all the objects.
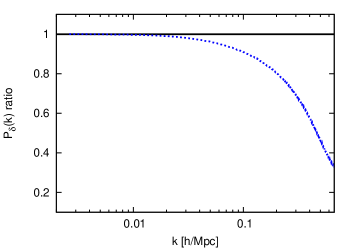
We show the ratio between the two different implementations in Fig. 5. On large scales the two spectra are identical, while on small scales they differ by a few percent, with the spectrum with the unevolving concentration being slightly higher. Larger differences appear at intermediate frequencies, where the spectrum with unevolving concentration parameter is roughly 8% higher than the spectrum where the concentration parameter is a function of mass and redshift. In the following we will assume that the concentration varies with mass and redshift and will discuss the impact of this assumption.

Another comment is necessary at this point. Comparing our results to better ray-tracing simulations, we need to emphasize that there will be additional contributions. Not only the concentration relation will evolve in time, but also the mass function will play an important role in changing the number of halos as a function of redshift.
3.2.2 Comparing the convergence spectra
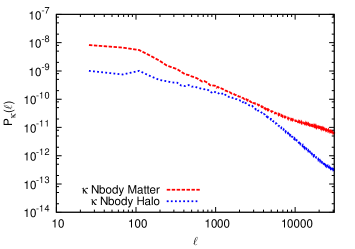
In Fig. 6 we compare the N-body lensing power spectrum, obtained using the particles in the simulated box, with the spectrum obtained using the halos only. The lensing power spectrum is significantly different from the total spectrum; unlike the matter power spectrum, they cannot be matched with a simple rescaling to account for the effective matter density. The two spectra have very different shapes. The lensing spectrum of the halos has a lower amplitude (since ) and differs both at low and high s, while it is comparable around . This suggests the importance of the cosmic web - structures not in halos - for the lensing signal, being them the primary responsible for the differences of shape and amplitude on large scales for the spectrum obtained using only the halos.
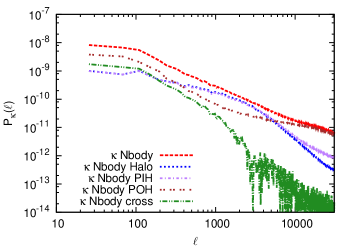


As above, it is useful to break down the contributions of the particles between those making up the halos (PIH), and those particles outside the halos (POH). In Fig. 7, we show the contribution to the total lensing spectrum of PIH, the POH and of their cross-correlation. Again, we verified that summing of the spectra of the different components recovers the power spectrum of the full field.
The lensing spectrum inferred from the NFW halo catalogue agrees very well with that of the PIH on large scales, up to , but there is an excess of power around of about 10%. However, on small scales we observe a lack of power inferred from the halo catalogue; we find the power dips about 20% at , dropping even lower on smaller scales. The origin of this complex behaviour is unclear; it must be remembered that the lensing maps are a projection of the density maps, and the effects of substructure missing in the halo treatment (as well as associated shot noise) could be spread over a range of multipoles.
Different concentration recipes give very similar results on small scales, but they can impact the excess of power seen on intermediate scales. The peak seen in the power ratio can change as much as 5% and shifts towards smaller frequencies when changing the concentration relation. When considering FoF halos, the amplitude and the position of the excess is related to the assumed concentration relation, but its origin is more complex and related to the asphericity of the FoF halos, as we will explain later.
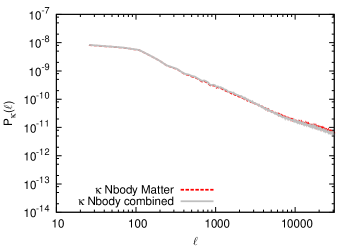
In Fig. 8 we compare the lensing signal of the full simulation to that combining the NFW halos with the matter distribution of particles outside the halos (upper panel), showing their ratio in the lower panel. These are largely in agreement, but are unable to reproduce the signal exactly, due to the lack of power on large s in the NFW halos and the mismatch on intermediate scales (see lower panel in Fig. 7). Due to the importance of the POH and its cross correlation with the halos, the lack of total power is limited to 10% and changes little over a decade in scale.
We also checked how these results are affected by the definition of a halo itself, by analysing maps created with catalogues whose halos had a different particle number threshold. All structures having fewer particles were excluded from the halos and the particles building them were absorbed into the cosmic web. Thresholds of 20, 100, 200, 1000 and 2000 particles, corresponding to a mass threshold of , , , and , were considered. The differences between the combined POH plus mock catalogues and the full particle distribution for the halos become progressively smaller when fewer halos are used (and the fraction of mass in the POH increases).
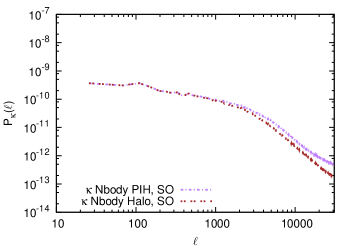

One might wonder whether the differences using the analytical halos could be related to how the halos were identified in the simulations. The NFW profile assumes that halos are spherically symmetric objects with a given over-density (in our case 200 times the critical density). Obviously this is not necessarily true in the FoF halos that they replace. To explore whether the spherical symmetry of the halos is an issue, we apply a spherical over-density algorithm on top of the FoF halo catalogue to identify the particles in the halos. The halos identified in this way are by definition more spherical; we also require the number of particles must be at least 20 and the density enclosed in the sphere to be . These spherical over-density (SO) halos will be smaller (and therefore less massive) and in a lower number with respect to the FoF halos. To create the SO-halo catalogue from the FoF-halo catalogue, we consider a sphere, centred on the halo centre with radius equal to the maximum distance of the particles from the centre of the halo; we then shrink this radius until the internal average density is 200 times the critical density. If the final number of particles is less than 20 (the minimum number of particles to have an halo) we discard that halo and any discarded particles instead contribute to the cosmic web.
In Fig. 9 we show the comparison between the lensing signal from the particles building the numerical SO halos and the corresponding analytical NFW halos. The agreement on large scales is once again achieved, as expected. Up to the two spectra are practically identical while with the increase of the multipole we notice the usual lack of power, while we find the power decreases rather than increases at intermediate scales. Comparing Fig. 9 with Fig. 8 we notice that the previously discussed peak disappears. This tells us that the FoF halos are responsible for excess of power at intermediate scales. When we compare a spherical halo with a FoF halo, we observe that the latter will have particles outside the modelled spherical area, creating overdense regions that by construction do not exist in the case of the SO halos. These regions are responsible for the excess of power at intermediate scales.
3.2.3 Rotating the halo particles
We next explore the impact of rotating halo particles, either randomly or coherently, on the lensing convergence spectrum. Recall that for the power spectrum, these rotations had relatively little impact; however, by suppressing halo substructures, the incoherent rotations did suppress the large spectrum (Fig. 4).
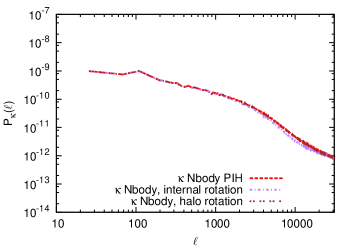
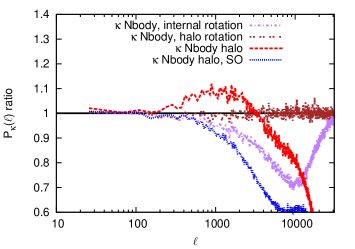
The impact of the rotations for the lensing spectrum is shown in Fig. 10. There is no appreciable difference on large scales; both kinds of rotations remain in very good agreement with the original PIH spectrum. However, on small angular scales, where one-halo effects become important (above ), there is a notable lack of power for the incoherent rotations that becomes as large as before the shot noise contribution becomes dominant at . This indicates that the halo substructures play a larger role in the determination of the lensing maps than they do for the density maps, due to closer substructures being projected into larger angular scales. It may be possible to improve the halo model results by adding substructure to the assumed profiles to reflect the mass and profile distributions (Giocoli et al., 2008; Giocoli et al., 2010) of the satellite sub-halos. Alternatively, one could create a library of halos including substructures and assign them randomly to the mock halos.
It is interesting to compare these results to the case where the particles in a halo are rotated coherently, preserving the halo substructures. In this case (also shown in Fig. 10), the power is largely preserved compared to the original simulations (as also seen in the matter power spectrum); this indicates that it is indeed the halo substructure, rather than the halo profile, that makes the differences seen for the incoherent rotations. Mixed in with the effect of substructure will also be the ellipsoidal distortions seen in realistic halos; while spherically symmetric objects have no preferred direction, the effective convergence of the halos (ellipsoidal rather than spherical) will change significantly if the projection is made along the longest or shortest axis. Thus the ellipsoidal structure of halos could add additional variance in the lensing power spectrum.
From the analysis of Fig. 10 we can draw another important conclusion. By comparing the curves showing the ratio between the lensing power spectrum based on the FoF halo catalogue (red dashed curve) and on the SO halo catalogue (blue dot-dotted curve), we notice that the peak at disappears, clearly showing that its presence can be related to the non-spherical halos typical of FoF catalogues as well as bridged halos (unbounded particles included by the FoF algorithm). We want to stress out that the peak at is the effect of using FoF halo catalogues instead of SO halo catalogues on lensing maps.
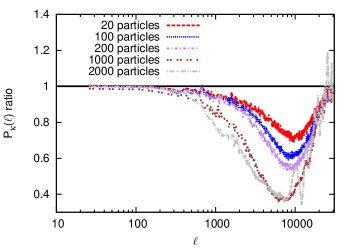
Finally, we investigate how the substructure contribution depends on the masses of halos we consider. In Fig. 11, we investigate how the effect of substructures is affected by the different definition of minimum halo mass considered, plotting the ratio of the effective convergence power spectrum of halos whose internal substructures are washed out to the PIH power spectrum for different halo mass thresholds. Massive halos are rarer but are rich in substructures and contribute more to the total halo mass. Thus, it is not surprising that erasing substructures in massive halos leads to a bigger suppression than when all the halos are included. Changing the threshold by a factor of fifty doubles the fraction of suppressed power and shifts it to larger angular scales. Given the rarity of very massive objects, we do not see appreciable differences with a threshold of 1000 or 2000 particles.
Our inability to reproduce the full simulation results should be compared with the findings of Petkova et al. (2013). In that work, the authors present an extension of the raytracing code GLAMER (Metcalf & Petkova, 2013) to the case of multiple deflection planes and compare their findings with several existing works. In particular they assemble spherically symmetric NFW halos drawn from the Sheth & Tormen mass function and compare the probability distribution functions for deflection angle, shear and effective convergence to N-body results from Pace et al. (2011), finding good agreement. However, in Pace et al. (2015) it was shown that for high values of the effective convergence, the raytracing simulations underestimated analytical or semi-analytical solutions. Thus the agreement may have been due to the suppressed power observed here for NFW halos compensating for the loss of resolution in the procedure adopted to build the lensing planes (for a more complete discussion see Pace et al., 2015). Note that, because we directly use the particle distribution to evaluate the effective convergence rather than evaluating it as the Laplacian of the lensing potential, we expect the resolution issues here to be less severe than in Pace et al. (2007), Pace et al. (2011) and Pace et al. (2015).
To conclude, our results show that both the cosmic web and the halo substructures are necessary to fully reproduce the lensing statistics, suggesting that halo based approaches may be seriously flawed for lensing studies.
4 2LPT methods
In this section we focus on the comparison between N-body simulations and simulation and halo catalogues based on the Lagrangian Perturbation Theory (LPT).
4.1 Lagrangian perturbation theory
Lagrangian perturbation theory (LPT) is a very useful mathematical approach used to describe perturbations in the matter density field and to create initial conditions for cosmological N-body simulations (Buchert, 1989; Moutarde et al., 1991; Bouchet et al., 1992; Buchert, 1992; Buchert & Ehlers, 1993; Buchert, 1994; Hivon et al., 1995; Catelan, 1995). In the LPT formalism, the current Eulerian position of a given mass element is related to its initial Lagrangian position via a displacement vector field according to the relation
| (9) |
Similarly to what it is usually done for the Eulerian perturbation theory (EPT), one can make a power series expansion of the displacement field as a function of the linear over-density field :
| (10) |
and is related to the th order expansion of the linear matter density field. LPT up to third order has been discussed in several works in literature (Buchert & Ehlers, 1993; Buchert, 1994; Hivon et al., 1995; Catelan, 1995) and recently calculations at the fourth order were carried out by Tatekawa (2013). Here, we will limit ourselves to the second-order treatment. Translating from Eulerian to Lagrangian coordinates, we can obtain the LPT equations at each order by substituting Eqn. (10) into Eqn. (9) and the equation of motion for particles
| (11) |
where is the scale factor, the Hubble expansion rate and the gravitational potential.
At first order we obtain the well-known Zel’dovich approximation (Zel’Dovich, 1970):
| (12) |
In Eqn. (12), represents the linear growth factor and is the Gaussian density field imposed by the initial conditions. Second-order LPT (2LPT) corrects the Zel’dovich approximation by taking into account gravitational tidal forces and the second order displacement to find
| (13) |
where is the second order growth factor and for a wide range of is proportional to (Bouchet et al., 1995).
At first and second order, it is convenient to define two different gravitational potentials and since the solutions are curl-free. The displacement fields are related to the gravitational potentials via the relation
| (14) |
with . Using the relations in Eqn. 14, the solution up to second order is
| (15) | |||||
| (16) |
where is the peculiar velocity and the cosmic time. Finally, is the logarithmic derivative of the growth factor, .
4.2 2LPT halo catalogues
With the formalism outlined in Sect. 4.1, it is possible to generate the 2LPT displacement and evolve particles according to it. From these, halos can be identified and rescaled to provide fast halo catalogues (PTHalos); we briefly describe these here and refer to Manera et al. (2013); Chuang et al. (2015); Manera et al. (2015) for more details.
The algorithm used to create the second order displacement is described in Scoccimarro (1998); it takes advantage of the fast Fourier transform (FFT) technique. Coles et al. (1993); Scoccimarro & Sheth (2002) used a cut-off in the linear matter power spectrum and found the halos using merger trees. For these simulations halos are identified with a standard friends-of-friends (FoF) technique (Davis et al., 1985) with a modified linking length. The theoretical derivation for the evaluation of the modified value for the 2LPT linking length is based on the spherical collapse model for the 2LPT and we refer to Manera et al. (2013) for an exhaustive explanation. The linking length used for the 2LPT simulations is calibrated on the LasDamas N-body simulations and its value is , significantly larger than the standard commonly used in N-body simulations.
The FoF algorithm identifies halo positions and masses in the 2LPT realisations. However, the 2LPT masses need to be calibrated by abundance matching to match a fiducial mass function. In particular, the Tinker et al. (2008) mass function was used to calibrate the 2LPT halo masses.
As for the LasDamas simulations used previously, 2LPT halos are identified at . The cosmology adopted is, as before, a flat CDM model with , , , , power spectrum normalization and spectral index . The simulated box is 2.4 Gpc/h comoving on a side with dark matter particles. In the following we will consider objects with at least 20 particles.
4.3 3D matter power spectrum
We first study the matter power spectrum following the same procedure outlined in Sect. 3.1. As for the full simulations, we use the NGP (Hockney & Eastwood, 1988) algorithm to assign dark matter particles to the grid and we use 512 points for the Fourier transform.
In the upper panel of Fig. 12 we first compare the full N-body spectrum to that inferred from the 2LPT particles, showing their ratio. As expected, the 2LPT spectrum agrees very well with the N-body spectrum on large scales, but the spectra differ considerably on small scales where fully non-linear effects are absent in the 2LPT treatment. The power deficit is considerable on the smallest modes of the simulation, dropping to 20% of the full simulation. As we will see in the next section (see Sect. 4.4), this inaccuracy will have tremendous effects on the lensing power spectrum.
It is necessary to find alternative methods to enhance the small scale power in the 2LPT simulations. In the halo method, the underdeveloped 2LPT halos are replaced by more realistic halo masses. As pointed out by Manera et al. (2013), to correctly reproduce the fiducial mass function, it is necessary to calibrate the mass of the FoF halos. We therefore compare the halo power spectrum with the total matter power spectrum in the bottom panel of Fig. 12 where we refer to the caption for the different line styles and colours. As done for the FoF halos in the N-body simulation, we evaluate the halo power spectrum weighting the halos either by their (corrected) mass, or simply giving all equal weight.
The halo power spectra reproduce, to large extent, the matter power spectrum on large scales. We checked that rescaling the halo power spectrum by an appropriate factor, well reproduces the expected matter power spectrum. The halo power spectrum with mass weighting is indeed very close to the total one due to a rescaling in the matter density parameter.

4.4 Lensing power spectrum
We next analyse the lensing power spectrum in the 2LPT simulations, again beginning with the 2LPT particle distribution and then seeing how things change using FoF halos derived from the simulations.
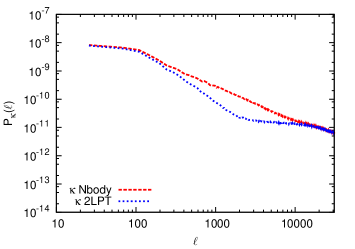
In Fig. 13 we show the lensing power spectrum using all the particles in the simulations for sources at for both the N-body and the 2LPT simulation. The missing power seen in the matter power spectrum (due to the lack of non-linear evolution in the 2LPT simulations) is even more prevalent in the effective convergence power spectrum. For very low the agreement is still very good, but the power deficit is significant on intermediate scales, beginning as low as . By , the power drops to 20% of the full simulation; this is as bad as the deficit seen in the density spectrum only at the highest modes. Beyond , the lensing spectrum flattens out at the expected shot nose level. It is perhaps not surprising that the missing non-linear power of the 2LPT simulations is disastrous for predictions of the lensing statistics.
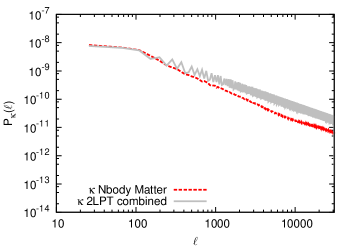
Better predictions might be derived using the associated NFW halo catalogues, where the halo masses have been rescaled to match the mass distribution observed in full N-body simulations; boosting the halo masses should make the deficit shown in Fig. 13 less severe. In Fig. 14, we show the spectrum of the PTHalos plus the POH in the cosmic web. We indeed see that the power decrement of the 2LPT particles has disappeared, but the mass rescaling makes the signal too high over a range of frequencies. While on large scales the agreement is excellent, on scales with we instead note an excess of power with respect to the total power measured from the N-body simulation. This is due to the mass correction we applied to the halos before evaluating their lensing signal, so that the mass of the rescaled halos added is greater than the PIH initially removed. This shows that PTHalos are clustered differently.
In Fig. 15 we compare the effective convergence power spectrum of the halo catalogues for the N-body and the 2LPT simulations, taking into account the mass correction for the 2LPT halos. While the mass correction is able to populate the halos with galaxies following the HOD prescription (Manera et al., 2013), the effective convergence for halos from the 2LPT catalogue is initially lower than the spectrum of the halos from the N-body catalogue on all scales. However, the total mass in the N-body halos is still greater () than that in the 2LPT halos even after the masses are individually rescaled. When the effective convergence power spectrum is rescaled by the matter density parameter squared, there is good agreement with the N-body lensing spectrum, as shown in the figure. However, the spectra do not match over the whole range of frequencies for the halo lensing power spectrum; there remains a difference in shape, with the N-body having more power at . This might reflect the fact that the mass remapping is not perfect, leading to a somewhat different mass weighting of the clustering of the PTHalos than in the N-body simulation.
5 Inclusion of a bias weight
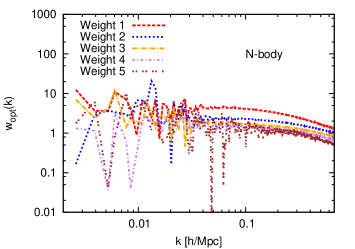
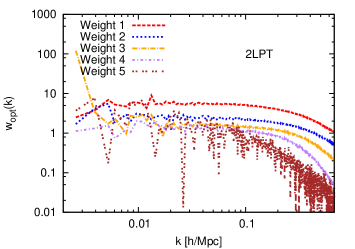
Given the limitations of simply using the mock-catalogues when trying to reproduce the results from the N-body simulations, in particular those for weak lensing, we next investigate whether these issues can be alleviated by using an optimal weight to reconstruct the underlying dark matter distribution from the halo catalogue. To do so, we closely follow the work by Cai et al. (2011) and we refer to them for further details. The idea is to see whether lensing studies can benefit from a mass-dependent weighting used to reconstruct the three dimensional matter field starting from a mock catalogue.
The halo distribution represents a biased sample of the underlying total matter distribution and the goal is to reconstruct the density only using the information we can extract from the mock catalogue. We divide our mock catalogue into mass bins and indicate with the fluctuation in each bin. The estimator for the matter density field is then
| (17) |
where represents the weight we use for each mass bin to reconstruct the dark matter field starting from the mock catalogue. The power spectrum for the mass fluctuation , the bias vector and the covariance matrix are defined as
| (18) | |||||
| (19) | |||||
| (20) |
Our weights are determined by minimising the stochasticity between the true and reconstructed density fields. Defining the stochasticity as
| (21) |
the minimum in the stochasticity is reached when the weight is
| (22) |
this implies the optimal stochasticity is
| (23) |
The halos are divided into five (logarithmically) equally-spaced mass bins, from the smallest masses (halos with 20 particles) in bin 1, to bin 5 which includes halos up to 70% of the highest mass found in the simulation. This most massive bin has only nine halos. To evaluate the weights, we calculated the power spectrum for each bin and the cross correlation between the bins and the total matter field.
In Fig. 16 we show the optimal weights to be applied to each mass bin. Due to the limited numbers of objects, the weights are very noisy on large scales, particularly for the highest mass halos. It is easy to understand why the lowest mass bin has a higher normalisation: lower mass halos are less biased and better reflect the matter density field not in halos, hence they are up-weighted with respect to the other halos in the density reconstruction. This can be seen in both the N-body and the 2LPT simulations. On small scales, the amplitude drops a factor of 2.5 going from the lowest mass bin to the highest mass bin in the N-body simulation, while for the 2LPT simulation differences in the weights are more pronounced.
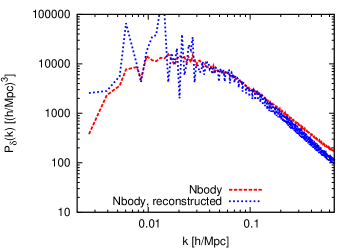
In Fig. 17 we show the reconstructed three dimensional matter power spectrum using the mass weighting. The reconstruction on large scales is relatively noisy, though the reconstructed matter power spectrum follows the expected trend. Good agreement is achieved for the mildly non-linear regime, with differences of the order of 10% for h/Mpc. For smaller scales, deeply in the non-linear regime, we observe a lack of power that becomes more pronounced for higher wave numbers. The effect of the shot noise is suppressed with the weighting, making the spectrum more reliable over a larger range of frequencies. In addition, now the spectra agree over a large range of frequencies without any additional rescaling due to the different effective matter density parameter, as the weights compensate for this.
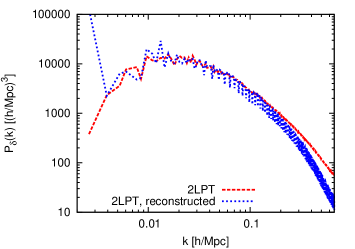
In terms of the matter density perturbations, the effective convergence , for sources at a fixed redshift, is written as
| (24) |
where is the scale factor, the comoving distance and a function that takes into account the 3D curvature of the space-time. In Fourier space, can be viewed as the weighted sum of the contributions of all the different mass bins (see Eq. 17). Therefore the effective convergence power spectrum is the integration along the line of sight of the reconstructed matter power spectrum:
| (25) |
where represents the matter power spectrum of the -th bin and the cross-correlation between the different bins. Using these relations, we numerically evaluate the lensing power spectrum from the halo catalogue. The matter power spectrum is binned only for a given set of wavelengths, therefore when the evaluation of the matter power spectrum has to be done outside this range, we extrapolate the values of the spectrum to both smaller and larger scales.
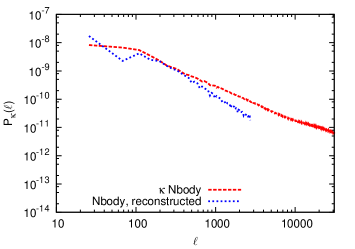
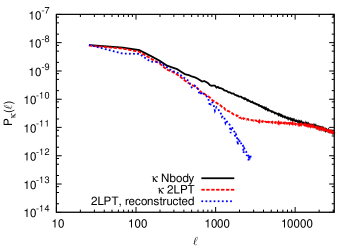
We show our results in Fig. 18. As expected the reconstruction is not perfect and is limited to a limited range of frequencies. On large scales the reconstructed lensing power spectrum agrees well with the original one, but at higher wave numbers the reconstructed spectrum has a lower amplitude: this reflects the lack of power present in the reconstructed three-dimensional matter power spectrum. Interestingly, the reconstruction for the 2LPT case works better than for the N-body simulation. However, what is reconstructed is the lensing prediction for the 2LPT particles, and so greatly under-produces power compared to the N-body lensing prediction, as seen in the bottom panel of Fig. 18.
6 Conclusions
Our focus has been to understand how well approximations to large scale structure, in particular those based on the halo model, can reproduce the statistics characterising large scale structure observations. Particularly challenging in this regard are lensing statistics, where projection effects mean that large and small scale features can jointly determine the observations on a given angular scale. Lensing studies are often based on ray-tracing through numerical simulations, but these methods are computationally expensive and it is essential to understand which fast methods can make reliable lensing predictions.
In this work we have studied whether mock halo catalogues, based either on full simulations or fast 2LPT realisations, could be of value for pushing lensing analyses into the non-linear regime. Such halo model approaches, if based on simple templates such as the NFW profile, can take advantage of analytical methods to calculate the lensing effect and so be much faster. By comparing fully non-linear simulations to mock catalogue methods over a huge cosmic volume, we have quantified where the halo model approaches appear to fail.
We have considered a gradual progression from the full N-body simulations to the halo catalogues. The first step beyond directly using the N-body simulation was to coherently rotate the halos; and we found that the halo orientations did not have a significant impact on either the matter power spectrum or the lensing convergence spectrum. However, when the halo particles were rotated incoherently, effectively smearing out the internal halo substructures, the matter power spectrum was reduced by 5% on the smallest scales we probed. The lensing convergence was impacted more dramatically, as this blurring of halos resulted in a significant suppression of power even on intermediate angular scales (see Fig. 10).
Directly replacing the halo particles with NFW halos had a similar effect, though in detail it depends on the assumed prescription for the concentration evolution. We also find that the effect of ignoring substructure is stronger in bigger halos. Finally, when we consider the halo catalogues alone, we can still reproduce the density power spectrum on large scales with a suitable rescaling, at least up to scales h/Mpc, where shot noise in the catalogue begins to dominate. But this cannot be done for the convergence spectrum; on large scales, the cosmic web of particles not included in halos plays an essential role in determining not only the amplitude but also the shape of the lensing spectrum.
One fast means of creating halo catalogues is through a 2LPT approach. 2LPT realisations entirely miss fully non-linear structures, and on their own would be inadequate for pushing predictions into the non-linear regime. Methods such as PTHalos improve the non-linear properties by identifying embryonic halos in the 2LPT simulations and replacing them with more realistic halo masses based on abundance matching to full simulations. These can improve agreement in the halo statistics, including the lensing power spectrum.
We also considered an optimal reconstruction of the matter density field by reweighing halos according to their mass, following the work by Cai et al. (2011). In this case the reconstructed matter power spectrum agrees reasonably well with the original matter power spectrum obtained from the particle distribution and no scaling is necessary to compensate for the different matter density parameters. The method worked better on large scales in reproducing the shape of the lensing convergence spectrum, compared with the simple halo approach. However, the lack of power on small scales remains an outstanding issue.
We demonstrate that both cosmic web and substructures are important in shaping the total lensing signal. While the cosmic web is responsible for the overall shape and contribution on large scales, substructures are responsible for a quite substantial fraction of the power on small scales.
To improve the performance of halo methods for lensing on non-linear scales, at a minimum we must include some additional substructure beyond the assumption that halos have simple spherically symmetric profiles. An obvious possibility to explore is the impact of the halo ellipticity; it would be interesting to understand whether extracting and modelling the halo ellipticities could help address the power deficits we have seen in the lensing spectrum. Another possibility is to include substructures, such as satellite galaxies, following, for example, the work of Giocoli et al. (2008); Giocoli et al. (2010) in characterising the number and masses of satellite halos. Alternatively, one could create a library of realistic halos (or their associated convergence maps) that could be pasted randomly onto halo catalogues.
Acknowledgements
The authors thank Roman Scoccimarro and the Las Damas collaboration to provide the N-body simulations we used in this work. The analysis was performed on the Intel SCIAMA High Performance Compute (HPC) cluster which is supported by the ICG, SEPNet and the University of Portsmouth. F. P., D. B. and R. C. are supported by STFC grant ST/H002774/1. W. P. is grateful for support from the UK Science and Technology Facilities Research Council through the grant ST/I001204/1, and the European Research Council through the grant ”Darksurvey”. MM acknowledges support from the European Research Council through the grant ”TESTDE”.
References
- Amendola et al. (2013) Amendola L., Appleby S., Bacon D., Baker T., Baldi M., Bartolo N., Blanchard A., Bonvin C., Borgani S., et al. 2013, Living Reviews in Relativity, 16, 6
- Bartelmann (1996) Bartelmann M., 1996, A&A, 313, 697
- Bartelmann & Schneider (2001) Bartelmann M., Schneider P., 2001, Physics Report, 340, 291
- Bhattacharya et al. (2013) Bhattacharya S., Habib S., Heitmann K., Vikhlinin A., 2013, ApJ, 766, 32
- Bouchet et al. (1995) Bouchet F. R., Colombi S., Hivon E., Juszkiewicz R., 1995, A&A, 296, 575
- Bouchet et al. (1992) Bouchet F. R., Juszkiewicz R., Colombi S., Pellat R., 1992, ApJL, 394, L5
- Buchert (1989) Buchert T., 1989, A&A, 223, 9
- Buchert (1992) Buchert T., 1992, MNRAS, 254, 729
- Buchert (1994) Buchert T., 1994, MNRAS, 267, 811
- Buchert & Ehlers (1993) Buchert T., Ehlers J., 1993, MNRAS, 264, 375
- Bullock et al. (2001) Bullock J. S., Kolatt T. S., Sigad Y., Somerville R. S., Kravtsov A. V., Klypin A. A., Primack J. R., Dekel A., 2001, MNRAS, 321, 559
- Cacciato et al. (2012) Cacciato M., Lahav O., van den Bosch F. C., Hoekstra H., Dekel A., 2012, MNRAS, 426, 566
- Cai et al. (2011) Cai Y.-C., Bernstein G., Sheth R. K., 2011, MNRAS, 412, 995
- Catelan (1995) Catelan P., 1995, MNRAS, 276, 115
- Chuang et al. (2015) Chuang C.-H., Kitaura F.-S., Prada F., Zhao C., Yepes G., 2015, MNRAS, 446, 2621
- Chuang et al. (2014) Chuang C.-H., Zhao C., Prada F., Munari E., Avila S., Izard A., Kitaura F.-S., et al. 2014, ArXiv e-prints, 1412.7729
- Ciarlariello et al. (2014) Ciarlariello S., Crittenden R., Pace F., 2014, ArXiv e-prints, 1412.4606
- Cole et al. (2005) Cole S., Percival W. J., Peacock J. A., Norberg P., Baugh C. M., Frenk C. S., Baldry I., Bland-Hawthorn J., Bridges T., et al. 2005, MNRAS, 362, 505
- Coles & Jones (1991) Coles P., Jones B., 1991, MNRAS, 248, 1
- Coles et al. (1993) Coles P., Moscardini L., Lucchin F., Matarrese S., Messina A., 1993, MNRAS, 264, 749
- Cooray et al. (2000) Cooray A., Hu W., Miralda-Escudé J., 2000, ApJL, 535, L9
- Cooray & Sheth (2002) Cooray A., Sheth R., 2002, Physics Report, 372, 1
- Crocce et al. (2006) Crocce M., Pueblas S., Scoccimarro R., 2006, MNRAS, 373, 369
- Davis et al. (1985) Davis M., Efstathiou G., Frenk C. S., White S. D. M., 1985, ApJ, 292, 371
- De Domenico & Lyberis (2012) De Domenico M., Lyberis H., 2012, ArXiv e-prints, 1204.1365
- de la Torre & Peacock (2013) de la Torre S., Peacock J. A., 2013, MNRAS, 435, 743
- Duffy et al. (2008) Duffy A. R., Schaye J., Kay S. T., Dalla Vecchia C., 2008, MNRAS, 390, L64
- Eke et al. (2001) Eke V. R., Navarro J. F., Steinmetz M., 2001, ApJ, 554, 114
- Fedeli et al. (2011) Fedeli C., Pace F., Moscardini L., Grossi M., Dolag K., 2011, MNRAS, 416, 3098
- Fosalba et al. (2008) Fosalba P., Gaztañaga E., Castander F. J., Manera M., 2008, MNRAS, 391, 435
- Fu et al. (2014) Fu L., Kilbinger M., Erben T., Heymans C., Hildebrandt H., Hoekstra H., Kitching T. D., et al. 2014, MNRAS, 441, 2725
- Gao et al. (2008) Gao L., Navarro J. F., Cole S., Frenk C. S., White S. D. M., Springel V., Jenkins A., Neto A. F., 2008, MNRAS, 387, 536
- Gardner et al. (2007a) Gardner J. P., Connolly A., McBride C., 2007a, 376, 69
- Gardner et al. (2007b) Gardner J. P., Connolly A., McBride C., 2007b, ArXiv e-prints, 0709.1967
- Giocoli et al. (2010) Giocoli C., Bartelmann M., Sheth R. K., Cacciato M., 2010, MNRAS, 408, 300
- Giocoli et al. (2008) Giocoli C., Pieri L., Tormen G., 2008, MNRAS, 387, 689
- Hartlap et al. (2011) Hartlap J., Hilbert S., Schneider P., Hildebrandt H., 2011, A&A, 528, A51
- Hilbert et al. (2009) Hilbert S., Hartlap J., White S. D. M., Schneider P., 2009, A&A, 499, 31
- Hivon et al. (1995) Hivon E., Bouchet F. R., Colombi S., Juszkiewicz R., 1995, A&A, 298, 643
- Hockney & Eastwood (1988) Hockney R. W., Eastwood J. W., 1988, Computer simulation using particles
- Kainulainen & Marra (2009) Kainulainen K., Marra V., 2009, Phys. Rev. D, 80, 123020
- Kainulainen & Marra (2011) Kainulainen K., Marra V., 2011, Phys. Rev. D, 83, 023009
- Kilbinger et al. (2013) Kilbinger M., Fu L., Heymans C., Simpson F., Benjamin J., Erben T., Harnois-Déraps J., Hoekstra H., Hildebrandt H., et al. 2013, MNRAS, 430, 2200
- Kitching et al. (2014) Kitching T. D., Heavens A. F., Alsing J., Erben T., Heymans C., Hildebrandt H., Hoekstra H., et al. 2014, MNRAS, 442, 1326
- Laureijs et al. (2011) Laureijs R., Amiaux J., Arduini S., Auguères J. ., Brinchmann J., Cole R., Cropper M., Dabin C., Duvet L., Ealet A., et al. 2011, ArXiv e-prints, 1110.3193
- Ludlow et al. (2013) Ludlow A. D., Navarro J. F., Angulo R. E., Boylan-Kolchin M., Springel V., Frenk C., White S. D. M., 2013, ArXiv e-prints, 1312.0945
- Macciò et al. (2008) Macciò A. V., Dutton A. A., van den Bosch F. C., 2008, MNRAS, 391, 1940
- Manera et al. (2015) Manera M., Samushia L., Tojeiro R., Howlett C., Ross A. J., Percival W. J., Gil-Marín H., Brownstein J. R., Burden A., Montesano F., 2015, MNRAS, 447, 437
- Manera et al. (2013) Manera M., Scoccimarro R., Percival W. J., Samushia L., McBride C. K., Ross A. J., Sheth R. K., White M., Reid B. A., et al. 2013, MNRAS, 428, 1036
- Marra et al. (2013) Marra V., Quartin M., Amendola L., 2013, Phys. Rev. D, 88, 063004
- McBride et al. (2009) McBride C., Berlind A., Scoccimarro R., Wechsler R., Busha M., Gardner J., van den Bosch F., 2009, in American Astronomical Society Meeting Abstracts #213 Vol. 41 of Bulletin of the American Astronomical Society, LasDamas Mock Galaxy Catalogs for SDSS. p. #425.06
- McBride et al. (2011) McBride C., Berlind A. A., Scoccimarro R., Manera M., Tinker J., Busha M., Wechsler R., Wu H., van den Bosch F., 2011, in American Astronomical Society Meeting Abstracts #217 Vol. 43 of Bulletin of the American Astronomical Society, LasDamas: Accurate Determination of the Abundance of Galaxy Clusters. p. #249.07
- Mead & Peacock (2013) Mead A., Peacock J., 2013, ArXiv e-prints, 1308.5183
- Ménard et al. (2003) Ménard B., Hamana T., Bartelmann M., Yoshida N., 2003, A&A, 403, 817
- Metcalf & Petkova (2013) Metcalf R. B., Petkova M., 2013, ArXiv e-prints, 1312.1128
- Monaco et al. (2013) Monaco P., Sefusatti E., Borgani S., Crocce M., Fosalba P., Sheth R. K., Theuns T., 2013, MNRAS, 433, 2389
- Monaco et al. (2002b) Monaco P., Theuns T., Taffoni G., 2002, MNRAS, 331, 587
- Monaco et al. (2002a) Monaco P., Theuns T., Taffoni G., Governato F., Quinn T., Stadel J., 2002, ApJ, 564, 8
- Moutarde et al. (1991) Moutarde F., Alimi J.-M., Bouchet F. R., Pellat R., Ramani A., 1991, ApJ, 382, 377
- Muñoz-Cuartas et al. (2011) Muñoz-Cuartas J. C., Macciò A. V., Gottlöber S., Dutton A. A., 2011, MNRAS, 411, 584
- Munshi et al. (2014c) Munshi D., Coles P., Kilbinger M., 2014, JCAP, 4, 4
- Munshi et al. (2014a) Munshi D., Hu B., Renzi A., Heavens A., Coles P., 2014, MNRAS, 442, 821
- Munshi & Jain (2000) Munshi D., Jain B., 2000, MNRAS, 318, 109
- Munshi et al. (2014b) Munshi D., Joudaki S., Coles P., Smidt J., Kay S. T., 2014, MNRAS, 442, 69
- Navarro et al. (1996) Navarro J. F., Frenk C. S., White S. D. M., 1996, ApJ, 462, 563
- Navarro et al. (1997) Navarro J. F., Frenk C. S., White S. D. M., 1997, ApJ, 490, 493
- Neto et al. (2007) Neto A. F., Gao L., Bett P., Cole S., Navarro J. F., Frenk C. S., White S. D. M., Springel V., Jenkins A., 2007, MNRAS, 381, 1450
- Oguri & Hamana (2011) Oguri M., Hamana T., 2011, MNRAS, 414, 1851
- Pace et al. (2015) Pace F., Baldi M., Moscardini L., Bacon D., Crittenden R., 2015, MNRAS, 447, 858
- Pace et al. (2007) Pace F., Maturi M., Meneghetti M., Bartelmann M., Moscardini L., Dolag K., 2007, A&A, 471, 731
- Pace et al. (2011) Pace F., Moscardini L., Bartelmann M., Branchini E., Dolag K., Grossi M., Matarrese S., 2011, MNRAS, 411, 595
- Petkova et al. (2013) Petkova M., Metcalf R. B., Giocoli C., 2013, ArXiv e-prints, 1312.1536
- Prada et al. (2012) Prada F., Klypin A. A., Cuesta A. J., Betancort-Rijo J. E., Primack J., 2012, MNRAS, 423, 3018
- Refregier (2003) Refregier A., 2003, ARA&A, 41, 645
- Retana-Montenegro & Frutos-Alfaro (2011) Retana-Montenegro E., Frutos-Alfaro F., 2011, ArXiv e-prints, 1108.4905
- Retana-Montenegro et al. (2012b) Retana-Montenegro E., Frutos-Alfaro F., Baes M., 2012, A&A, 546, A32
- Retana-Montenegro et al. (2012a) Retana-Montenegro E., van Hese E., Gentile G., Baes M., Frutos-Alfaro F., 2012, A&A, 540, A70
- Scherrer & Bertschinger (1991) Scherrer R. J., Bertschinger E., 1991, ApJ, 381, 349
- Schneider & Bridle (2010) Schneider M. D., Bridle S., 2010, MNRAS, 402, 2127
- Scoccimarro (1998) Scoccimarro R., 1998, MNRAS, 299, 1097
- Scoccimarro & Sheth (2002) Scoccimarro R., Sheth R. K., 2002, MNRAS, 329, 629
- Seljak (2000) Seljak U., 2000, MNRAS, 318, 203
- Seljak & Zaldarriaga (1996) Seljak U., Zaldarriaga M., 1996, ApJ, 469, 437
- Sheth & Jain (2003) Sheth R. K., Jain B., 2003, MNRAS, 345, 529
- Simpson et al. (2013) Simpson F., Heymans C., Parkinson D., Blake C., Kilbinger M., Benjamin J., Erben T., et al. 2013, MNRAS, 429, 2249
- Song et al. (2011) Song Y.-S., Zhao G.-B., Bacon D., Koyama K., Nichol R. C., Pogosian L., 2011, Phys. Rev. D, 84, 083523
- Springel (2005) Springel V., 2005, MNRAS, 364, 1105
- Taffoni et al. (2002) Taffoni G., Monaco P., Theuns T., 2002, MNRAS, 333, 623
- Takada & Hamana (2003) Takada M., Hamana T., 2003, MNRAS, 346, 949
- Takahashi et al. (2011) Takahashi R., Oguri M., Sato M., Hamana T., 2011, ApJ, 742, 15
- Taruya et al. (2002) Taruya A., Takada M., Hamana T., Kayo I., Futamase T., 2002, ApJ, 571, 638
- Tassev et al. (2015) Tassev S., Eisenstein D. J., Wandelt B. D., Zaldarriaga M., 2015, ArXiv e-prints, 1502.07751
- Tassev et al. (2013) Tassev S., Zaldarriaga M., Eisenstein D. J., 2013, JCAP, 6, 36
- Tatekawa (2013) Tatekawa T., 2013, Progress of Theoretical and Experimental Physics, 2013, 010003
- Tinker et al. (2008) Tinker J., Kravtsov A. V., Klypin A., Abazajian K., Warren M., Yepes G., Gottlöber S., Holz D. E., 2008, ApJ, 688, 709
- Valageas (2000a) Valageas P., 2000a, A&A, 356, 771
- Valageas (2000b) Valageas P., 2000b, A&A, 354, 767
- Valageas et al. (2004) Valageas P., Barber A. J., Munshi D., 2004, MNRAS, 347, 654
- Valageas & Munshi (2004) Valageas P., Munshi D., 2004, MNRAS, 354, 1146
- Vale & White (2003) Vale C., White M., 2003, ApJ, 592, 699
- Van Waerbeke et al. (2013) Van Waerbeke L., Benjamin J., Erben T., Heymans C., Hildebrandt H., Hoekstra H., Kitching T. D., et al. 2013, MNRAS, 433, 3373
- Velander et al. (2014) Velander M., van Uitert E., Hoekstra H., Coupon J., Erben T., Heymans C., Hildebrandt H., et al. 2014, MNRAS, 437, 2111
- Wright & Brainerd (2000) Wright C. O., Brainerd T. G., 2000, ApJ, 534, 34
- Zel’Dovich (1970) Zel’Dovich Y. B., 1970, A&A, 5, 84