Gamma-Ray Bursts Trace UV Metrics of Star Formation over ††thanks: Partly based on observations collected at the European Organisation for Astronomical Research in the Southern Hemisphere under IDs 089.A-0120(A) and 091.A-0786(A).
Abstract
We present the first uniform treatment of long duration gamma-ray burst (GRB) host galaxy detections and upper limits over the redshift range , a key epoch for observational and theoretical efforts to understand the processes, environments, and consequences of early cosmic star formation. We contribute deep imaging observations of 13 GRB positions yielding the discovery of eight new host galaxies. We use this dataset in tandem with previously published observations of 31 further GRB positions to estimate or constrain the host galaxy rest-frame ultraviolet (UV; Å) absolute magnitudes . We then use the combined set of 44 estimates and limits to construct the luminosity function (LF) for GRB host galaxies over and compare it to expectations from Lyman break galaxy (LBG) photometric surveys with the Hubble Space Telescope. Adopting standard prescriptions for the luminosity dependence of galaxy dust obscuration (and hence, total star formation rate), we find that our LF is compatible with LBG observations over a factor of 600 in host luminosity, from mag to mag, and with extrapolations of the assumed Schechter-type LF well beyond this range. We review proposed astrophysical and observational biases for our sample, and find they are for the most part minimal. We therefore conclude, as the simplest interpretation of our results, that GRBs successfully trace UV metrics of cosmic star formation over the range . Our findings suggest GRBs are providing an accurate picture of star formation processes from out to the highest redshifts.
1 Introduction
A fundamental goal of modern cosmology is to understand the history of star formation in our Universe, from its earliest epochs to the present day. Efforts over recent decades, including ambitious ground-based spectroscopic surveys and space-based observations in the ultraviolet (GALEX), optical to near-infrared (Hubble Space Telescope), and longer wavelengths (Spitzer, Herschel) have enabled multiple determinations and cross-checks, including extinction corrections, of the cosmic star formation rate (SFR) at redshifts , and the first credible estimates over ; for a recent review and references, see Madau & Dickinson (2014).
Star formation in the early Universe, at , is of particular interest as it tracks the formation of the first galaxies, which should account for the redshift and timescale of the cosmic reionization and may yield insight into the dark matter-driven formation of the first cosmic structures (e.g., Yoshida et al., 2003; Trenti et al., 2010; Tseliakhovich & Hirata, 2010; Dijkstra & Wyithe, 2012; Jaacks et al., 2012; Trenti et al., 2013). Accurately quantifying star formation at these redshifts presents obvious challenges: at these distances even the most luminous galaxies are faint and nearly inaccessible to spectroscopic study; moreover, high-sensitivity observations are currently (until the advent of the James Webb Space Telescope, JWST) restricted to rest-frame ultraviolet (UV) and optical bands. Nonetheless, the underlying scientific promise has motivated intense observational efforts.
Multiple deep surveys with the Hubble Space Telescope (HST) have collected over 10,000 photometrically-selected Lyman break galaxies (LBGs) over (Bouwens et al., 2011; Oesch et al., 2012; Ellis et al., 2013; Schenker et al., 2013; Schmidt et al., 2014; Bouwens et al., 2014b, 2015b), with multiband imaging over substantial regions allowing the fitting of full spectral energy distributions (SEDs), and thus stellar population models, for individual galaxies (e.g., Duncan et al., 2014). These surveys have been complemented by HST observations of the most massive known galaxy clusters, which take advantage of the gravitational-lensing boost to extend LBG luminosity functions (LFs) by a full magnitude (Atek et al., 2015), and have yielded LBG candidates out to (Zheng et al., 2012; Bouwens et al., 2014a).
Meanwhile via ground-based facilities, narrow-band surveys targeting emission-line galaxies have collected substantial samples over (Shimasaku et al., 2006; Ouchi et al., 2010; Ota et al., 2010); cosmic microwave background (CMB) experiments have discovered dozens of gravitationally-lensed, dusty, star-forming galaxies at (Vieira et al., 2010; Mocanu et al., 2013; Marsden et al., 2014); and large-area near-infrared (NIR) surveys are yielding competitive constraints on the bright end of the galaxy LF (Bowler et al., 2014) and pushing the frontier of quasar discovery out to (Mortlock et al., 2011).
With the latest results from the Planck Collaboration (2015) yielding a reduced estimate for the Thomson scattering optical depth to the CMB () consistent with reionization ending at (Shull et al., 2012; Robertson et al., 2015; Bouwens et al., 2015a), the chief remaining uncertainty in our estimates of high-redshift SFR must be the quantity of star formation happening in faint galaxies, beyond the reach of even the deepest HST fields. Such galaxies are too faint for current galaxy surveys; at higher redshifts, many have flux densities nJy that will challenge even JWST, and thus most conceivable observational tests.
In this respect, long-duration gamma-ray bursts (GRBs) offer an elegant and complementary approach, currently reaching to (Tanvir et al., 2009; Salvaterra et al., 2009; Cucchiara et al., 2011), that could be extended to with relatively modest space-based observatories (Burrows et al., 2010; Paul et al., 2011; Greiner et al., 2012). Due to their link to core-collapse supernovae (SNe) (Stanek et al., 2003; Hjorth et al., 2003), GRBs probe the formation of massive stars. Intrinsically luminous and dust-penetrating, GRBs accurately pinpoint regions of active SF – in three dimensions – independent of galaxy luminosity, dust obscuration, and precise redshift.
Past efforts to use GRBs as tracers of cosmic star formation (SF) have compared the GRB redshift distribution to other independent estimators. Since SF at low redshifts is considered well-characterized, the aim of these studies has been to validate or calibrate the GRB distribution over so as to leverage knowledge of the GRB redshift distribution at higher redshifts, , to infer cosmic SFR and explore the consequences for cosmic reionization. Initial efforts using the Swift (Gehrels et al., 2004) GRB redshift distribution found that the GRB rate rose more rapidly with redshift over than other estimators (Yüksel et al., 2008; Kistler et al., 2009). Adopting the implied correction, with , led to SFR predictions consistent with extrapolations of the LBG LF at those redshifts (Kistler et al., 2009).
Wanderman & Piran (2010) also found a steep rise in the GRB rate at and a relatively slow decay at , which they suggested was inconsistent with LBG SFR estimates. However, their derived SFR (Fig. 9) closely resembles both the evolution-corrected GRB-based SFR and the “LF integrated” LBG-based SFR from Kistler et al. (2009, their Fig. 4). Given the uncertainties, it may be accurate to characterize these initial papers as demonstrating that the SFRs implied by GRB rates and LBG surveys are consistent over a range of plausible LBG LF extrapolations and GRB evolution corrections.
This consistency of GRB- and LBG-derived SFRs would be in accord with Robertson & Ellis (2012), who found that varying their treatment of the unknown redshifts of dark bursts (GRBs that lack bright optical afterglows, and are hence missing from redshift samples based on afterglow spectroscopy) had a significant impact on the strength of the evolution correction needed to bring GRB and other SFR metrics into agreement at : putting all dark bursts at their maximum likely redshifts suggested a mild GRB evolution correction, ; while putting all dark bursts at low redshifts favored no correction, . Along these lines, we note that luminosity-based selection of GRBs, pursued in some cases to improve sample completeness, has been shown to affect the strength of the inferred anti-metallicity bias (Elliott et al., 2012).
If differential evolution of the GRB rate and SFR is required at low-redshift, there is a broad consensus that this would reflect an anti-metallicity bias in the GRB population, thanks to past suggestions on both theoretical (e.g., Woosley & Heger, 2006; Yoon et al., 2006) and observational (e.g., Stanek et al., 2006; Fruchter et al., 2006) grounds. However, since the average metallicity of star-forming galaxies drops precipitously from to (Maiolino et al., 2008), even if anti-metallicity bias is present the implied correction from GRB rates to SFR at might be modest (Trenti et al., 2013). Indeed, comparison of high-resolution cosmology simulations to the observed GRB sample suggests at redshifts of (Elliott et al., 2015).
In this paper, we seek to make a different type of global comparison between GRBs and UV-based star formation metrics, calculating the UV luminosity function of GRB host galaxies over and comparing it to prior expectations from LBG surveys (see also Schulze et al. 2015). We focus our efforts on this redshift range because: (1) The accuracy and completeness of current SFR estimates at these redshifts, in terms of extinction corrections and the necessary extrapolation to unobserved faint galaxies, remain subject to active debate; (2) At these redshifts any metallicity bias in the selection of GRB host galaxies is likely to be reduced or, potentially, negligible; (3) A sufficient number of GRB redshifts have been measured within this range to make statistical analyses useful; and (4) Large-aperture ground-based telescopes (and HST) can readily detect host galaxies of modest luminosity at these redshifts or, alternatively, yield useful constraints on their magnitudes. Naturally, we carry out this work in hopes that it will shed light on the connection between GRBs and SF not just within, but also beyond, our targeted redshift range.
In Section 2 below we present 15 observations of 13 GRB host galaxies over , which yield detections of eight and deep limits of five GRB hosts. We supplement these data with 61 observations of 31 additional host galaxies from the literature, yielding detections of 21 and limits of 10 hosts. With a uniform treatment of the new and previously published data, informed by the results of the HST LBG surveys, we convert each observation into a rest-frame UV (Å) absolute magnitude or limit, using a CDM cosmology with =70 km/s/Mpc, =0.3, =0.7. In Section 3 we construct the UV LF for the GRB host galaxies, and compare it to the SFR-weighted LF of Lyman-break galaxies in this redshift range. We then discuss the possible influence of proposed astrophysical biases, including an anti-metallicity bias in GRB production and suppression of star-formation in low-mass halos, and observational selection effects, including interloper galaxies, “dark bursts” potentially missing from our sample, and publication bias. Our conclusions are presented in Section 4.
2 Observations
Presently, measured redshifts for GRB afterglows are known for more than 400 GRBs***see the online collection at http://mpe.mpg.de/$∼$jcg/grbgen.html, among those 65 (as of February 2015) in the redshift range . Of those, host measurements for 31 are reported in the literature and in the GRB Host Studies (GHostS) database†††GHostS: http://www.grbhosts.org/, at widely disparate sensitivities. We add our own data, in particular FORS2/VLT (Appenzeller & Rupprecht, 1992) observations of 7 GRB hosts, and GROND/2.2m (Greiner et al., 2007, 2008) observations for another 6 GRB hosts.
Our VLT observations of GRB host galaxies at are summarized in Table 1. FORS2/-band observations are taken as a sequence of 1140 s integrations, while FORS2/-band observations are taken as a sequence of 240 s integrations, owing to the brighter sky in that bandpass. Observations were carried out in service mode, extending over two or more nights in each case, and were almost all of high quality. The raw data are available for downloading from the ESO VLT data archive‡‡‡VLT data archive: http://dataportal.eso.org. Pointings were chosen to put the targeted region of sky in a clean portion of CCD 2 on FORS2, southwest of the pointing center.
GROND observations (also listed in Table 1) were taken as a sequence of 369 s exposures using four or six telescope dither positions. Imaging was done in all seven GROND filters simultaneously; for each target we report the observed magnitude for the bluest filter redward of, and not affected by, Ly-.
2.1 Data Reduction
After bias-subtraction and flat-fielding, VLT images are trimmed to exclude the vignetted corners of the FORS2 field of view; CCD 1 images are trimmed to a 353 by 201 rectangular region, and CCD 2 images to a 353 by 150 rectangular region.
Individual CCD images are processed with SExtractor (Bertin & Arnouts, 1996) in order to identify and mask bright objects and fit and subtract a smoothly-varying model of the sky background. We observe mild fringing at a level of 1% of the sky background which is not reliably repeated from one observing epoch to the next. For this reason, we construct an object-masked fringe image for each observing epoch and scale and subtract it from the images before proceeding. Using the native WCS, the two CCD images are then integrated into a single image with an 18-pixel (228) gap between the two fields.
Coaddition of the multiple frames for each field proceeds via a two-step process. In the first step, images are aligned via cross-correlation analysis and a median stack is constructed. This median image is used to identify bad pixels and cosmic ray-affected pixels in each individual frame, updating the previous (static) bad pixel masks for each detector. Masked pixels in each image are replaced by corresponding values from the median image, and the images are re-aligned with a second cross-correlation analysis. The final coadded image is then generated as the sigma-clipped mean of the masked and aligned individual frames. The coadded image is trimmed to the size of the best-centered individual frame, yielding a single 353 by 355 image with roughly constant depth across the field. We then refine the WCS of this final image by reference to the SDSS (when available) or USNO-B1.0 catalogs; the resulting WCS solutions have uniformly acceptable residuals of 02 (rms).
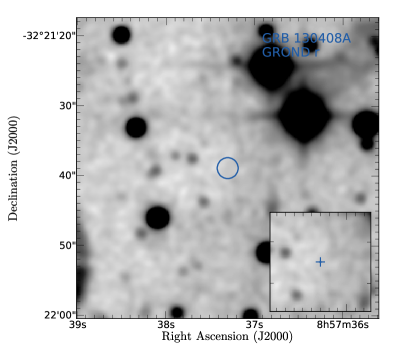
These residuals are due to the mapping against the catalog positions. Astrometry between two GROND images (for afterglow and host, respectively) or between GROND and FORS2 is even more accurate. In order to determine the position of the afterglow relative to the host galaxy, the following procedure is used. First, a source detection is run over the GROND images containing the afterglow, providing a list of x,y coordinates of the afterglow and neighbouring field stars (extended objects were de-selected). This list is then used as “catalog” input list for the astrometry of the FORS2 images. This provides relative accuracies of 005 and 01 (rms) for GROND-internal and GROND-FORS2 mapping, respectively. In Fig. 1 the position of the afterglow is plotted with a cross, while the circle denotes the aperture used to extract the host photometry.
Photometric analysis is done using standard IRAF tasks (Tody, 1993), as documented in full in Krühler et al. (2008). In short, bright stars within the field are used to fit a point-spread function (PSF) which then is applied to the entire field. Absolute photometric calibration of the FORS images was achieved with GROND by observing a Sloan digital Sky Survey (SDSS) field (Aihara et al., 2011) that was closest to the host galaxy, and consecutively the corresponding host field (in few cases this was not needed as the GRB lies already in SDSS-covered area).
With accurate afterglow positions registered on our VLT and GROND frames, and using the well-known 1′′ offsets of long-duration GRBs from their hosts (Bloom et al., 2002), we are finally in the position to search for a host related to the corresponding GRB afterglow. Simple aperture photometry is used for the host galaxy. For each galaxy a curve-of-growth analysis was carried out to determine the aperture size for which the signal-to-noise ratio is optimized (also added as separate column in Table 1). We also list the centroid positions of the host galaxies in Table 1. A selection of stars for each host field were then used to determine the associated zero point.
2.2 Results and Source Notes
Fig. 1 shows the final image of each of our sample GRBs. Table 1 contains the details of the observations, including the GRB name (column 1), the redshift (2), telescope/instrument (3), filter (4), exposure (5), centroid position of the host (03 uncertainty) (6), the aperture size as determined from the curve-of-growth analysis (7) and the host magnitude with uncertainty, reporting a 2 upper limit for non-detections (8). The three GRBs with explicit errors in the redshift column have photometric redshifts.
![[Uncaptioned image]](/html/1503.05323/assets/x1.png)
![[Uncaptioned image]](/html/1503.05323/assets/x2.png)
![[Uncaptioned image]](/html/1503.05323/assets/x3.png)
![[Uncaptioned image]](/html/1503.05323/assets/x4.png)
![[Uncaptioned image]](/html/1503.05323/assets/x5.png)
![[Uncaptioned image]](/html/1503.05323/assets/x6.png)
![[Uncaptioned image]](/html/1503.05323/assets/x7.png)
![[Uncaptioned image]](/html/1503.05323/assets/x8.png)
![[Uncaptioned image]](/html/1503.05323/assets/x9.png)
![[Uncaptioned image]](/html/1503.05323/assets/x10.png)
![[Uncaptioned image]](/html/1503.05323/assets/x11.png)
![[Uncaptioned image]](/html/1503.05323/assets/x12.png)
With respect to the data reduction for individual GRB positions, we have the following notes:
GRB 090313: The galaxy 25 North of the GRB afterglow position is not the host galaxy. Using Le PHARE§§§LePHARE website: http://www.cfht.hawaii.edu/$^∼$arnouts/LEPHARE (Arnouts et al., 1999; Ilbert et al., 2006), the spectral energy distribution obtained with GROND over all seven optical+NIR channels is best fit with an Sbc spiral galaxy template at a photometric redshift of . This is much smaller than the GRB afterglow redshift, and also lower than the redshifts of the two intervening absorber systems reported by de Ugarte Postigo et al. (2009). The limiting magnitude of our GROND image is about 15 deeper than reported in Table 1, but the halo of this nearby galaxy produces additional background light at the afterglow position.
GRB 120805A: Based on the combination of GROND afterglow photometry and X-Shooter host spectroscopy, Krühler et al. (2015) derive a photometric redshift .
Table 2 presents further data on these observed GRBs, along with our compilation of GRB host measurements from the literature. Data columns present the GRB name and redshift (columns 1 and 2), the host magnitude or upper limit in the measured filter band (3), the Galactic foreground extinction from Schlafly & Finkbeiner (2011) (4), and the distance modulus for our chosen cosmology (5); the derived value of the spectral slope (6), absolute UV magnitude (7), and inferred star formation rate (8); and appropriate references (9).
2.3 Host Galaxy Properties
We derive host galaxy properties (Table 2) from the observed magnitudes and upper limits as follows:
- 1.
-
2.
We calculate the absolute magnitude at the observed rest-frame wavelength by applying the distance modulus for our chosen cosmology (=70 km/s/Mpc, =0.3, =0.7);
-
3.
We solve jointly for the absolute magnitude of the host galaxy at the rest-frame wavelength Å, , and the spectral index of its continuum, (), using the relation for star-forming galaxies at from Table 3 of Bouwens et al. (2014b):
(1) Note that while this relation exhibits substantial scatter, uncertainties for the fitted parameters over ensembles of high-redshift star-forming galaxies are modest, and .
Our procedure for upper limits is as follows: If our upper limit implies mag (strong constraint) then we adopt the value appropriate for a galaxy with absolute magnitude equal to our upper limit. If our upper limit is at mag (weak constraint) then we adopt exactly. Note that for the latter observations, our quoted limits and our observed upper limits (at rest-frame wavelength ) will be the same.
-
4.
In a handful of cases (GRBs 000131, 060223A, 060605, 081029, 090323, 090519, 100518A, 130408A) observations of host galaxies at are attempted in the -band or similar filters, which extend over the Lyman-alpha feature at these redshifts. We correct for absorption blueward of the Lyman-alpha transition by integrating the adopted power-law continuum over the filter bandpass, assuming a uniform 60% suppression of the host galaxy continuum at wavelengths blueward of Lyman-alpha. This 1 mag of UV continuum suppression is typical for high-redshift LBGs (e.g., Ando et al. 2004). The corresponding values are marked with an asterisk in Table 2.
-
5.
We estimate the host galaxy star formation rate from the calculated spectral slope and absolute magnitude by assuming that the UV extinction (Meurer et al., 1999), and that the total star formation rate is proportional to the extinction-corrected UV luminosity (Eq. 11 of Duncan et al. 2014). For consistency, we quote estimates from each single-band observation, even for hosts with observations in multiple filters or with previously-published SFR estimates. Extinction values are required to be non-negative; only the two faintest host limits are affected by this restriction.
We note that since observed spectral indices of high-redshift star-forming galaxies are close to (Bouwens et al., 2014b), their restframe UV spectra are nearly flat in , with AB magnitudes that are close to constant redward of the Lyman-alpha transition. Further, we note that Duncan et al. (2014) found the adopted star-formation estimator satisfactorily reproduced the results of full spectral energy distribution analyses (to within 0.1 mag) for high-redshift galaxies in CANDELS GOODS South. On the other hand, we recognize that the SFR estimates for galaxies detected in multiple bands are not always consistent; GRB 110818A represents an extreme case, with and SFR estimates from and -band observations that differ by more than ; the spectral slope between the two observations is , very different than the expected on the basis of the galaxy’s absolute magnitude (although this relation is observed to have significant scatter, e.g. Fig. 7 of Bouwens et al. 2014b).
Among the six targets with photometric redshift (or similarly low accuracy) estimates, the error on the derived absolute magnitude across the likely redshift range is less than 0.3 mag for all but two. For the two exceptions, GRBs 100518A and 000131, this is due to the uncertain impact of Lyman-alpha absorption in -band observations. Since GRB 000131 has an -band limit which we use for our host studies, only the single limit for GRB 100518A (one of 29 detections and 15 limits) is affected in a significant way by photometric redshift uncertainty.
As a consequence of the observed correlations between , , and specified above, we find that (except where the condition of non-negative extinction applies) and hence . Thus we expect the intrinsic UV luminosities of the host galaxies to scale as for bright galaxies, mag. In the complementary regime, mag, the expected extinction is zero, and intrinsic and observed UV luminosities will be equivalent. Hence, since SFR is proportional to , we adopt the above SFR weighting to convert from the observed luminosity function of LBG galaxies in the field to predicted luminosity functions for GRB host galaxies (see §3.1).
2.4 Comparison to the Literature
In general, the absolute magnitudes derived here from previously published magnitudes and limits are in good agreement with those already published, in particular for filters located close to rest-frame 1600Å (corresponding to Å at and Å at ). For longer-wavelength filters, the effect of the luminosity-dependent slope relation that we have adopted introduces corrections which range from 0.2 to 0.4 mag.
Three GRBs from our sample have published star-formation rates:
The difference for GRBs 971214 and 080607 is likely due to the different method used, i.e. the SED fitting employed by Perley et al. (2013) For GRB 090323, the difference is nearly solely (factor 3.0 out of the total factor 4.1 difference) due to the -slope dependent extinction-correction which we (but not Savaglio et al. 2012) have applied; the two approaches are consistent to within a factor of two if the same method is used. The case of GRB 090323 also demonstrates the relatively small residual effect (remaining difference of 50%) of even a relatively extreme spectral slope () as derived via our approach.
3 Analysis & Interpretation
We now proceed to analyze our dataset of GRB host galaxy properties in light of current models of galaxy formation and GRB production, addressing astrophysical biases and possible selection effects.
3.1 Host Galaxy Luminosity Function
First, we use our collection of GRB host galaxy luminosities and upper limits to estimate the GRB host galaxy luminosity function and compare to recent survey work on galaxies using deep- and wide-field imaging observations from HST. For each burst we choose the single best estimate or upper limit from Table 2, preferring detections over limits, and higher-precision measurements (e.g., HST data) over lower-precision measurements, and selecting the shortest-wavelength filter redward of Lyman-alpha to minimize systematic uncertainty.
With the resulting set of 29 measurements and 15 lower bounds, we use Kaplan-Meier estimation (Kaplan & Meier, 1958), as implemented in the R statistical software package (Therneau, 2012; R Core Team, 2013), to construct the maximum-likelihood LF for GRB host galaxies over , along with its 50%-confidence and 90%-confidence ranges. Our results are presented in Fig. 2 (upper panel), along with a histogram of the input detections and limits (lower panel). As common in astronomical applications of the Kaplan-Meier algorithm, the requirement that the “survival” of any individual data point be unrelated to its true value is not strictly met, since the intrinsically-faintest galaxies are less likely to be detected. However, as also common in astronomical situations, the broad range in source redshifts and the range in achieved limits across the various observations serve to randomize the distribution of detections and limits somewhat. As such, we are confident that the resulting characterization of the LF is roughly as good as any non-parametric analysis of the data can offer (see Feigelson & Babu 2012 for discussion).
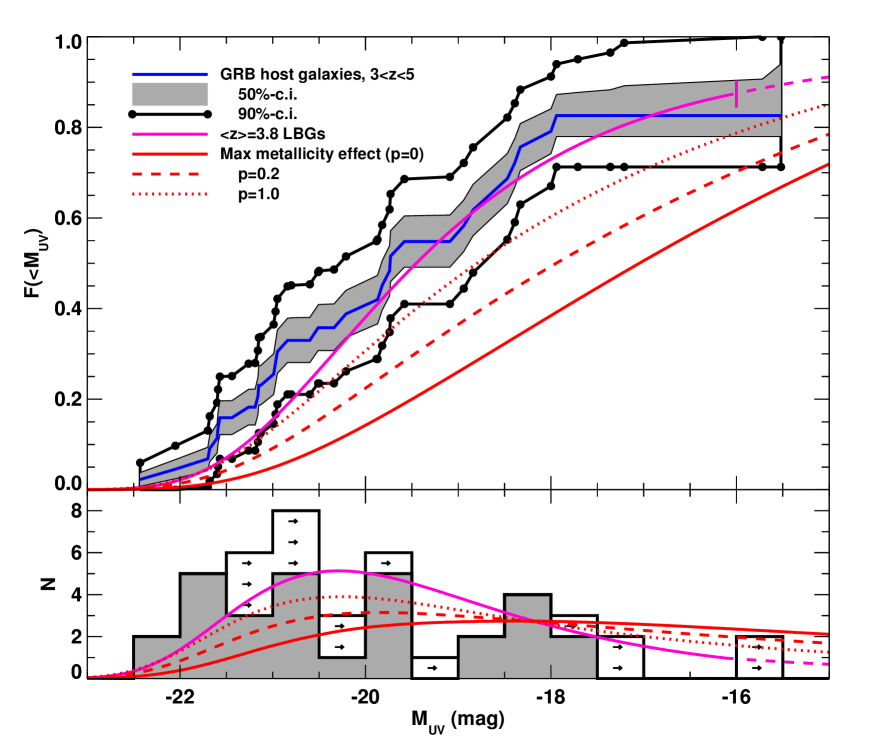
For comparison purposes, we use the luminosity function of Bouwens et al. (2015b, the “All Fields” fit from Table 6). This luminosity function results from their photometric redshift selection of Lyman-break galaxies (LBGs) over the XDF, HUDF09-Ps, CANDELS (North + South), and ERS HST survey fields, and reaches to mag. A Schechter-function form (Schechter, 1976) is assumed, and the best-fit parameters with uncertainties are: mag, Mpc-3, and ¶¶¶We note that the best-fit LBG LF parameters changed between initial preprints of Bouwens et al. (2015b) and the published version, owing to an improved treatment of the survey selection volume; the original submitted version of the present manuscript used the initial parameter values.. In this context, we note that the median and mean redshifts of our sample are 3.57 and 3.72, respectively.
To compare the LBG and GRB host galaxy luminosity functions, we must account for GRB selection effects. Our default hypothesis, consistent with the collapsar model, is to weight galaxies according to their instantaneous star-formation rates. Here we use results established previously (§2.3), showing that the star formation rate scales as for mag, and as for mag. The effect of an SFR-weighted selection of galaxies on the luminosity function is thus to increase the parameter by 1.22 (1.00) to () over these two regimes, without altering . Note that is irrelevant in the present context as our sample is fixed at galaxies.
Overplotting the cumulative SFR-weighted LBG LF from Bouwens et al. (2015b) (magenta line) against our cumulative LF for the GRB host galaxies (blue line) shows that the two are consistent across the full range of absolute magnitudes probed (Fig. 2). In particular, the LBG LF stays within the 90%-confidence bounds (black lines with points) on the GRB host galaxy LF for 38 of 42 plotted points (exceeding the constraint for four points at mag), and lies within the 50%-confidence interval (shaded region) for 33% of this range. Exploring the degree of agreement quantitatively, we find that the LBG LF is consistent with our observations at roughly the 1 (68%-confidence) level.
Given consistency with this straightforward model, we do not find evidence for complex or second-order selection effects for GRB host galaxies in this redshift range. Effects that have been proposed in this context include metallicity-dependent selection (biasing toward lower-mass galaxies; Fruchter et al. 2006; Modjaz et al. 2008; Wang & Dai 2014) and selection against the most luminous, dusty hosts (via extinction of the optical afterglow light; Perley et al. 2009; Krühler et al. 2011; Perley et al. 2013). By contrast, our results are consistent with predictions that metallicity or anti-extinction effects in the GRB population will yield minimal selection bias for GRB host galaxies at (Kocevski et al., 2009; Mannucci et al., 2011; Perley et al., 2013). We explore the question of anti-metallicity bias quantitatively in Sect. 3.2 below, comparing our host galaxy LF to expectations under a range of scenarios (their “plateau parameter” , 0.2 and 1.0) for anti-metallicity bias explored by Trenti et al. (2015). These models are plotted as red lines in Fig. 2.
We note that our results provide independent evidence for host luminosity-dependent obscuration as observed both at (Meurer et al., 1999) and in higher-redshift LBG studies (Bouwens et al., 2014b; Duncan et al., 2014). In particular, if we assume that SFR is proportional to observed UV luminosity across the full range of galaxy luminosities, the resulting LF is inconsistent with our GRB host galaxy LF at 90%-confidence, lying to the right of the illustrated 90%-confidence interval for 35 of 42 plotted points (and between the plotted LFs for the and models from Trenti et al. 2015).
Comparison to recent work – Since submission of this manuscript, a separate study of GRB host galaxy luminosity functions over , including comparison to expectations from galaxy surveys and semianalytic models, has been posted to the ArXiv (Schulze et al., 2015). These authors study the 69 GRB positions defined by the TOUGH sample (Hjorth et al., 2012), a subset of which are included in our compilation. Since the authors do not perform a Kaplan-Meier analysis, the effects of host galaxy nondetections (limits) on their LFs are not clear, and they restrict their analysis to the depth of the faintest detected host galaxy in each redshift interval, foregoing the opportunity to test their LFs from the faint end. Nonetheless, they compare their resulting empirical LFs to LBG LFs and the semi-analytic LFs from Trenti et al. (2015), as we have (see in particular their Fig. 7).
Schulze et al. (2015) find evidence for significant anti-metallicity bias over ( galaxies) and ( galaxies). Their empirical LF over ( galaxies) is consistent with all tested models, while the LF over ( galaxies) disfavors models with strong anti-metallicity bias ( and ). Over the two higher-redshift intervals, their results are subject to significant uncertainty due to the unknown redshifts of nine of their targeted GRBs, six of which have detected host galaxies. Including a significant number of these host galaxies in the redshift interval would shift the LF for this interval to fainter magnitudes, increasing agreement with moderate and strongly biased models, while including a significant number in the interval (owing to the greater implied host galaxy luminosities at these redshifts) would shift the LF for this interval to brighter magnitudes, increasing agreement with the less-biased models (including simple SFR-weighting or no bias, ).
Given the uncertainties, distinct statistical approach, and relatively small sample size within the redshift range considered here, we do not consider the results of Schulze et al. (2015) to be in significant tension with ours. To the contrary, we think they demonstrate (along with our present work) that GRB host galaxy studies have advanced to the point where LF comparisons over a broad range of redshifts are providing useful insights into the host galaxy population, and likely, the GRB mechanism itself.
3.2 Astrophysical Effects
The consistency we have demonstrated between the GRB host galaxy LF over and the most straightforward predictive model – the SFR-weighted LF of LBGs from Bouwens et al. (2015b) – suggests that astrophysical biases in selecting GRB host galaxies at these redshifts are either minor or counterbalanced by competing astrophysical or selection effects.
Of course, it may be the case that these astrophysical biases are, indeed, present and counterbalanced. Even if not, reviewing past and current predictions as to the nature and strength of these effects, and comparing to the constraints implied by our data, may help to place GRBs and their host galaxies in their full cosmic context. We therefore review these questions here, considering first proposed astrophysical biases and then the most likely observational or selection effects.
Metallicity bias: The effects of host galaxy metallicity on GRB production have been much debated. From the standpoint of the collapsar model of long-duration GRBs (Woosley, 1993; MacFadyen & Woosley, 1999), the metal content of a massive star’s envelope is a strong driver of mass and angular momentum losses. Expulsion of the hydrogen envelope before core collapse is necessary to reduce the star’s size to the point where the GRB jet can successfully escape the star while the central engine is active. At the same time, if angular momentum losses from the envelope are transmitted to the core, they will prevent a long-lived accretion disk from forming, drastically reducing the lifetime of the central engine. As a result, isolated high-metallicity stars are not expected to explode as GRBs (Woosley & Heger, 2006; Yoon et al., 2006). The strength of this bias could be mitigated, however, if binary stellar evolution can produce GRB progenitors more or less independent of metallicity (Fryer & Heger, 2005; Cantiello et al., 2007).
From an observational perspective, a bias toward low-metallicity environments finds support from the lowest-redshift “low luminosity” GRBs, which have been found exclusively in low-metallicity host galaxies and regions of those galaxies (Stanek et al., 2006; Levesque et al., 2011); from metallicity studies of GRB host galaxies at (Levesque et al., 2010a; Graham & Fruchter, 2013) and beyond (Krühler et al., 2015); from comparative host galaxy studies of GRBs, type Ibc, and type II supernovae at (Fruchter et al., 2006; Modjaz et al., 2008); and from GRB host galaxy photometric surveys at (Perley et al., 2013) and beyond (Fynbo et al., 2003; Hjorth et al., 2012). However, contrary indications also exist: for example, not all GRB host galaxies are low-mass or metal poor (Savaglio et al., 2009; Levesque et al., 2010b; Savaglio et al., 2012; Elliott et al., 2013; Schady et al., 2015; Krühler et al., 2015), and gas-phase metallicities derived from GRB absorption spectroscopy are consistent with average galaxy metallicities for star-forming galaxies at similar redshifts (Prochaska et al., 2007; Cucchiara et al., 2015). Moreover, with respect to low-luminosity GRBs it should be noted that these are not, strictly speaking, GRBs – their much lower luminosities can be accommodated within mildly-relativistic shock-breakout models, without the need for highly-relativistic jets (Nakar & Sari, 2012; Katz et al., 2012; Barniol Duran et al., 2015).
In an attempt to shed light on these issues, Trenti et al. (2015) extended their semi-analytic models of galaxy formation to incorporate metallicity-sensitive GRB production rates. They explored a range of models, from zero to near-maximal sensitivity, by including metallicity-sensitive (MS) and metallicity-insensitive (MI) channels of GRB production in a variable ratio. The redshift distribution and host galaxy properties of the GRBs in each scenario are then compared to observations. Importantly, with these models they address, for the first time and in realistic fashion, the effect that the evolving metallicity distribution of star-forming regions, in galaxies of various sizes, will have on the metallicities, masses, and luminosities of GRB host galaxies across the full range of observed redshifts.
Trenti et al. (2015) find that the Swift GRB redshift distribution (Wanderman & Piran, 2010) is best reproduced by models that incorporate contributions from both MS and MI production channels. In their maximum-likelihood scenario, most GRBs at result from the MI channel and hence reflect the typical metallicities of star-forming regions; GRBs are produced at comparable rates in the two channels at and show the strongest differential preference (compared to total star-formation metrics) for low-metallicity regions; and GRBs are produced primarily via the MS channel at , when nearly all star-formation is occurring in metal-poor environments.
We have compared our host galaxy LF to the LF predictions of Trenti et al. (2015) at (Fig. 2). Our LF is consistent with their predictions for the pure-MI scenario and inconsistent at 90%-confidence with the pure-MS scenario (with their “plateau” variable ), as well as with two mixed scenarios (, not plotted, and ) that incorporate both MS and MI GRB production. It is marginally consistent (not excluded at 90%-confidence) with a further mixed scenario that was generated specifically for this work. The plateau variable sets the relative efficiency of GRB production via the MI channel at metallicities : GRB production is suppressed by a factor of (e.g., by 6 for , and by 2 for ) for , compared to its rate at . In a pure-MS scenario, and there is no GRB production at , while as GRB production is independent of metallicity. In models with finite , the GRB production efficiency at intermediate metallicities decreases monotonically with increasing metallicity; see Trenti et al. (2015) for details.
Consistency with the pure-MI model is expected, as it is constructed in part on the LBG survey work of Bouwens et al. (2015b) which provides our successful default LBG LF (§3.1). The incompatibility of the mixed model with our observed LF is more surprising, as it successfully reproduces the GRB redshift distribution. Yet our sample includes a significantly greater proportion of bright host galaxies than this model predicts, and is barely consistent with the significantly reduced bias of the mixed model. We conclude that a dominant role for the MS channel in GRB production at can only be supported if some distinct astrophysical or selection effect is acting to enrich our sample with bright host galaxies.
Suppression of star formation in low-mass halos: In fact, the possible existence and likely implications of one such astrophysical effect have been central to several earlier studies relating GRB production to high-redshift star formation (Trenti et al., 2012, 2013). These models assume that SF at is efficient in dark matter halos only above a certain minimum mass, leading to a Schechter-like LF up to a corresponding maximum (faintest) , beyond which the LF cuts off sharply. This limiting “suppression magnitude” has been taken to be mag in the so-called standard scenario, corresponding to a minimum halo mass of . A significantly larger minimum halo mass for successful star formation would bias the LF to brighter magnitudes and increase the fraction of detected host galaxies at a given flux limit. Hence, the allowed range for can be constrained using observations of host galaxies at substantially brighter magnitudes, .
Such an analysis has previously been applied by Trenti et al. (2012) to the deep limits for six GRB host galaxies reported by Tanvir et al. (2012); they showed that the luminosity function at those redshifts must extend to at least mag (90%-confidence limit). With respect to the present dataset and our lower-redshift range, , the non-detection of two host galaxies down to mag (GRB 060607A at ) and mag (GRB 020124 at ) provides a strong lower bound, mag, that is almost as constraining as the previous result.
Because a non-negligible fraction of SF happens in faint galaxies for any Schechter-like LF, values of that are consistent with our lower (bright-end) bound can still alter the predicted GRB host galaxy LF in a significant fashion. For example, the LF for galaxies from Trenti et al. (2015) is consistent with (not ruled out at 90%-confidence by) our results for mag. While this particular case is excluded (in a distinct manner) by our faintest limits, plateau parameter values , excluded at 90%-confidence for mag, would be consistent with our data for values of mag which are allowed by our deepest limits.
3.3 Potential Observational Biases
We now turn to consider potential biases in the observations, independent of astrophysical effects, which may affect our results. We have identified three such potential biases, and address each of these in turn.
Interloper galaxies: Some of the identified galaxies, while coincident with the GRB positions, may not actually be the GRB host galaxies; we refer to this as the interloper problem. When interlopers are present, the sample will be contaminated with galaxies having greater inferred luminosity than the (unobserved) true host galaxies. The nature of this effect, then, is to bias the observed LF to brighter magnitudes.
We estimate the magnitude of this effect by reference to -band galaxy number counts from Boutsia et al. (2014). We find that for a radius localization, there is a 1% chance for an interloper galaxy with magnitude within 0.25 mag of mag; a 2% chance for an interloper galaxy within 0.25 mag of 26 mag; a 5% chance for an interloper galaxy within 0.25 mag of 27 mag; and a 14% chance for an interloper galaxy within 0.25 mag of 28 mag. By its nature, the interloper effect is not relevant for (cannot affect) our upper limits.
Our faintest detection is mag for the candidate host galaxy of GRB 060605; however, this galaxy has a brighter -band detection from the ground at mag. The next two faintest detections are mag for GRB 060223A and mag for GRB 050908. These two detections should be compared to the 12% chance of an interloper of similar magnitude; on a purely probabilistic basis there is a 78% chance that both are true associations and a 22% chance that one or both are false. Our brighter detections are less likely to be interlopers; the estimated total number of interlopers across our full sample of 29 detected host galaxies is 0.85.
If one or more of our detected galaxies are interlopers, identifying and correcting for this would convert one, or several, of the fainter detections (e.g., those identified above), into upper limits. Given the sample size and the estimated number of interlopers, we do not expect this to have a dramatic impact on our derived LF.
Moreover, we note that we have calculated interloper probabilities from a frequentist perspective, without taking into account the prior expectation that a significant fraction of GRB positions should have star-forming galaxies that will be detected via the reported observations. A full Bayesian analysis, beyond the scope of the present paper, would be expected to yield a smaller contamination rate than we have calculated above, with a correspondingly weaker effect on the derived LF.
Dark burst host galaxies: Since we require a spectroscopic or photometric redshift to include a GRB in our sample, GRBs that experience high extinction in their host galaxies are more likely to be excluded. The known hosts of confirmed high-extinction ( mag) GRBs, almost all at , have been shown to be statistically more massive, more luminous, and more evolved than the host galaxies of low-extinction bursts in this redshift range (Krühler et al., 2011; Perley et al., 2013). LBG surveys also uniformly find that more massive and luminous galaxies are subject to greater amounts of dust obscuration than less massive galaxies (Duncan et al., 2014; Bouwens et al., 2015b). Hence, selection against optically-extinguished bursts may exclude some of the most luminous GRB host galaxies, and bias our derived LF toward fainter luminosities. In the present context, with an empirical LF that lies on the higher-luminosity side of the SFR-weighted LBG LF and all semi-analytic LFs incorporating effects of anti-metallicity bias (Fig. 2), detailed consideration of this correction may appear unwarranted. Nonetheless, our concern with all astrophysical and selection effects leads us to review this issue briefly here.
The most ambitious survey of high-extinction host galaxies to date (Perley et al., 2013) – which first clarified the extent to which hosts of high-extinction bursts are systematically more massive and luminous than those of low-extinction bursts – shows a clear decrease in this trend with redshift (e.g., in their Fig. 7), with the distributions of high-extinction and low-extinction host galaxies becoming consistent with each other and with the distribution for star-forming galaxies by (see caption to their Fig. 8). Unless this trend reverses at higher redshift, this suggests that the host galaxies of high-extinction and low-extinction bursts will not be strongly distinguished over our redshift range of . Furthermore, the host galaxies of heavily dust-extinguished GRBs are not exclusively massive, with 50% of the sample included in Perley et al. (2013) having stellar masses , and less than 20% having .
We attempt to quantify the number of host galaxies missing from our sample due to high afterglow extinction (defined as mag in the host galaxy) by considering two GRB samples that are relatively complete in terms of both redshift and measurements. These are the GROND 4-hour sample (Greiner et al., 2011), consisting of 39 long-duration GRBs observed by GROND within 4 hours of the Swift trigger, and the BAT peak flux-selected sample (Salvaterra et al., 2012; Covino et al., 2013), made up of 58 GRBs, 11 of which are in the GROND 4-hour sample. Removing duplicates, the union of these datasets provides a sample of 86 GRBs, 78 of which have redshift measurements (91% completeness). Ten GRBs (13%) have , and one of these has mag (GRB 080607 with mag; Perley et al. 2011). This gives us a lower limit of 10% on the fraction of GRBs at with mag. If we assume that all eight bursts without measured redshifts are high-extinction bursts, with redshifts distributed similarly as for the bursts with measured redshifts, then one of these high-extinction bursts with unknown redshifts (and two or fewer, at 90%-confidence) are from . This would imply an expected fraction of 18% of GRBs (25%, at 90%-confidence) over with mag.
Since two high-extinction bursts are included in our sample (GRBs 080607, Perley et al. 2013; and GRB 060210, Cenko et al. 2009), a high-extinction fraction of 18% would mean that we have missed 7 high-extinction afterglows in our sample of 44 GRBs. If, as we expect, the host properties of high-extinction bursts in our redshift range are not strongly distinguished from those of low-extinction bursts, then the absence of these host galaxies from our sample will not significantly affect our results. Alternatively, if the hosts of high-extinction and low-extinction bursts are strongly distinguished over , then our LF has been biased to lower luminosities by this effect, and any correction would shift our LF toward even higher luminosities.
Publication bias: The majority of our host measurements are drawn from the published literature, including a diverse array of efforts and facilities. This is advantageous in the sense that it provides coverage of many GRB positions, yields detections of multiple bright host galaxies, and provides a somewhat-randomized distribution of detections and upper limits, helping to make a Kaplan-Meier approach to LF construction more appropriate. On the other hand, it means the sample may be affected by publication bias: if upper limits from moderate-depth observations are considered less interesting, they may be less likely to be reported in the literature than detections. As a result, our sample could be depleted in moderate-depth upper limits by comparison to a hypothetical survey offering complete coverage to a uniform depth; absence of these upper limits would bias our derived LF toward brighter magnitudes.
While we cannot guarantee that this effect is absent in our sample, we have taken care to search the Gemini, VLT, and HST archives for unpublished late-time imaging of GRB positions within our targeted redshift range; this process led (in part) to the present set of coauthors, and to our presentation of five previously-unpublished HST observations from Svennson (2011). Moreover, our sample includes significant contributions from the pre-defined and complete survey efforts of Hjorth et al. (2012) and Perley et al. (2013). We thus expect the impact of future observations of GRBs within the targeted redshift range, with respect to this effect, to be modest.
4 Conclusions
We have presented deep ground-based imaging of thirteen GRBs over (Fig. 1), yielding discovery of eight new GRB host galaxies along with five deep upper limits (Table 1). Combining these results with published observations of 31 additional GRB positions, including 21 detected host galaxies, we have presented a comprehensive and uniform summary of the photometric properties of GRB host galaxies over (Table 2).
Adopting ultraviolet (UV) continuum spectral index () and extinction () prescriptions for high-redshift star-forming galaxies from multiband Lyman-break galaxy surveys with the Hubble Space Telescope (HST; Meurer et al., 1999; Bouwens et al., 2014b; Duncan et al., 2014; Bouwens et al., 2015b), we have used our detections and limits to estimate host galaxy absolute magnitudes at Å in the rest frame, (quoted in AB mags), and their resulting inferred star formation rates. Adopting the single most useful detection or upper limit for each of 44 targeted host galaxies, we have constructed the luminosity function (LF) for GRB host galaxies over by Kaplan-Meier estimation, calculating the maximum-likelihood LF as well as its 50%-confidence and 90%-confidence intervals (Fig. 2).
We have compared the GRB LF to expectations from LBG surveys by constructing the SFR-weighted LF for LBGs (Bouwens et al., 2015b). This LBG LF has mag, Mpc-3, and ; our adopted SFR-weighting, appropriate if GRBs trace star formation, adjusts the power-law slope by (+1.00) over mag ( mag) owing to the luminosity-dependent extinction observed in LBG surveys (Meurer et al., 1999; Duncan et al., 2014). The resulting LF is compatible with our GRB host galaxy LF over the full range of host galaxy luminosities probed, from mag to mag, a range of more than 600 in host luminosity. Since GRB host galaxies are selected independent of host luminosity, our results demonstrate consistency of the two LFs – with respect to their Schechter-function form and and parameters – well beyond the range of absolute magnitudes that has been probed directly.
We have reviewed proposed astrophysical and observational effects that might bias our dataset and resulting LF. If two or more of these effects are present in sufficient and counter-balancing strength, they might conspire to yield a misleading agreement between the GRB host galaxy LF and the SFR-weighted LF of the LBG population, which is meant to reflect UV metrics of star formation over this redshift range.
In this context, we reviewed the issue of the proposed anti-metallicity bias of GRBs. Existing observational evidence of this bias has been gathered almost entirely at low-redshift, , via studies of GRB host galaxies (Levesque, 2014, and references therein), and by comparison of the redshift evolution of the GRB rate to other metrics of star formation (Kistler et al., 2008, 2009; Wanderman & Piran, 2010; Robertson & Ellis, 2012). At a much greater fraction of star formation occurs in low-metallicity environments, where the effects of such a bias might be reduced. Nonetheless, recent theoretical explorations demonstrate that, for plausible models of the bias, the GRB host galaxy LF can be significantly altered over the redshift range considered here (Trenti et al., 2015). We tested these models against our observed LF and found (in the absence of other biases) no evidence for a dominant contribution from any metallicity-sensitive GRB production channel over .
Alternatively, suppression of star formation in low-mass halos could result in a brighter GRB host galaxy LF than predicted via naive extrapolation of a Schechter-type LF (Trenti et al., 2010, 2013). We do not find it necessary to invoke this effect; the two faintest host galaxy limits in our sample, mag and mag, imply directly that mag, and are almost as constraining as those derived from deep HST observations of known GRB positions (Tanvir et al., 2012; Trenti et al., 2012). It remains possible that this effect is present and compensating for the effects of a (relatively mild) anti-metallicity bias in the GRB host galaxy population.
In terms of observational or selection effects, we have reviewed our sample for possible contamination by line-of-sight interloper galaxies, unrelated to the GRB, and concluded that there is some chance that one or a few of our faintest detections are spurious in this sense; we estimated that on average, 0.85 of the host galaxies in the present sample will be interlopers.
The observational challenges of measuring spectroscopic or photometric redshifts for high-extinction ( mag in the host galaxy) GRB afterglows are real and likely to affect our sample; we estimate that we are missing 7 GRBs as a result of these effects. If the properties of the host galaxies of these “dark bursts” are significantly different than those of the mag population, this could affect our LF and conclusions. However, the most extensive existing survey of the host galaxies of high-extinction bursts has shown that the differences between the high-extinction and low-extinction host galaxy populations decreases with redshift, becoming quite modest by (Perley et al., 2013).
We have also considered whether our sample might be depleted in medium-sensitivity upper limits on GRB host galaxies owing to publication bias. Given our review of the Gemini, VLT, and HST archives, we consider this possibility unlikely, although it is difficult to rule out completely.
Rather than invoke a hypothetical and delicate balance among two or more of these competing astrophysical and observational effects, we conclude, as the simplest interpretation of our results, that GRBs accurately trace UV metrics of cosmic star formation over . As differential effects between GRB production and star formation are robustly expected to decrease with redshift (Trenti et al., 2015), our finding strongly suggests that GRBs are providing an accurate picture of star formation processes from out to the highest redshifts, . GRBs can thus be relied upon in these regimes to provide an independent check on SFR estimates from galaxy surveys, which must necessarily extrapolate their results to faint galaxies well beyond their detection thresholds.
Looking ahead, this work can be strengthened in a straightforward manner by carrying out a complete survey of GRB host galaxies over . Such a survey would address the question of publication bias directly, and given that the present sample already yields interesting constraints on GRB production biases and star formation models, would be assured of providing even greater insights.
Similar work at higher redshifts, , is also desirable. Given the challenges of gathering useful data at these redshifts from ground-based facilities, this survey work will most likely be carried out using HST.
Meanwhile, detected GRB host galaxies in this redshift range can be subjected to deep multiband observations, which will lead to galaxy-by-galaxy dust extinction and stellar population models. Targeted spectroscopic investigations will also be useful to provide a detailed picture of the environments and properties of the star formation occurring within this unique and – as we have shown – SFR-weighted selection of high-redshift star-forming galaxies.
References
- Aihara et al. (2011) Aihara, H. et al. 2011, ApJS, 193, 29
- Andersen et al. (2000) Andersen, M. I. et al. 2000, A&A, 364, L54
- Ando et al. (2004) Ando, M., Ohta, K., Iwata, I., Watanabe, C., Tamura, N., Akiyama, M., & Aoki, K. 2004, ApJ, 610, 635
- Appenzeller & Rupprecht (1992) Appenzeller, I. & Rupprecht, G. 1992, The Messenger, 67, 18
- Arnouts et al. (1999) Arnouts, S., Cristiani, S., Moscardini, L., Matarrese, S., Lucchin, F., Fontana, A., & Giallongo, E. 1999, MNRAS, 310, 540
- Atek et al. (2015) Atek, H. et al. 2015, ApJ, 800, 18
- Barniol Duran et al. (2015) Barniol Duran, R., Nakar, E., Piran, T., & Sari, R. 2015, MNRAS, 448, 417
- Berger et al. (2002) Berger, E. et al. 2002, ApJ, 581, 981
- Bertin & Arnouts (1996) Bertin, E. & Arnouts, S. 1996, A&AS, 117, 393
- Bloom et al. (2002) Bloom, J. S., Kulkarni, S. R., & Djorgovski, S. G. 2002, AJ, 123, 1111
- Boutsia et al. (2014) Boutsia, K. et al. 2014, A&A, 563, A142
- Bouwens et al. (2014a) Bouwens, R. J. et al. 2014a, ApJ, 795, 126
- Bouwens et al. (2011) — 2011, Nature, 469, 504
- Bouwens et al. (2015a) Bouwens, R. J., Illingworth, G. D., Oesch, P. A., Caruana, J., Holwerda, B., Smit, R., & Wilkins, S. 2015a, ArXiv.org, 1503.08228
- Bouwens et al. (2014b) Bouwens, R. J. et al. 2014b, ApJ, 793, 115
- Bouwens et al. (2015b) — 2015b, ApJ, 803, 34
- Bowler et al. (2014) Bowler, R. A. A. et al. 2014, MNRAS, 440, 2810
- Burrows et al. (2010) Burrows, D. N., Roming, P. W. A., Fox, D. B., Herter, T. L., Falcone, A., Bilén, S., Nousek, J. A., & Kennea, J. A. 2010, in Society of Photo-Optical Instrumentation Engineers (SPIE) Conference Series, Vol. 7732, Society of Photo-Optical Instrumentation Engineers (SPIE) Conference Series, 1
- Cantiello et al. (2007) Cantiello, M., Yoon, S.-C., Langer, N., & Livio, M. 2007, A&A, 465, L29
- Cardelli et al. (1989) Cardelli, J. A., Clayton, G. C., & Mathis, J. S. 1989, ApJ, 345, 245
- Cenko et al. (2009) Cenko, S. B. et al. 2009, ApJ, 693, 1484
- Chary et al. (2007) Chary, R., Berger, E., & Cowie, L. 2007, ApJ, 671, 272
- Chen et al. (2009) Chen, H.-W. et al. 2009, ApJ, 691, 152
- Covino et al. (2013) Covino, S. et al. 2013, MNRAS, 432, 1231
- Cucchiara et al. (2015) Cucchiara, A., Fumagalli, M., Rafelski, M., Kocevski, D., Prochaska, J. X., Cooke, R. J., & Becker, G. D. 2015, ApJ, 804, 51
- Cucchiara et al. (2011) Cucchiara, A. et al. 2011, ApJ, 736, 7
- D’Avanzo et al. (2010) D’Avanzo, P. et al. 2010, A&A, 522, A20
- de Ugarte Postigo et al. (2009) de Ugarte Postigo, A. et al. 2009, GRB Coordinates Network, 9015, 1
- Dijkstra & Wyithe (2012) Dijkstra, M. & Wyithe, J. S. B. 2012, MNRAS, 419, 3181
- Duncan et al. (2014) Duncan, K. et al. 2014, MNRAS, 444, 2960
- Elliott et al. (2012) Elliott, J., Greiner, J., Khochfar, S., Schady, P., Johnson, J. L., & Rau, A. 2012, A&A, 539, A113
- Elliott et al. (2015) Elliott, J., Khochfar, S., Greiner, J., & Dalla Vecchia, C. 2015, MNRAS, 446, 4239
- Elliott et al. (2013) Elliott, J. et al. 2013, A&A, 556, A23
- Ellis et al. (2013) Ellis, R. S. et al. 2013, ApJ, 763, L7
- Feigelson & Babu (2012) Feigelson, E. D. & Babu, G. 2012, Modern Statistical Methods for Astronomy (Cambridge University Press)
- Ferrero et al. (2009) Ferrero, P. et al. 2009, A&A, 497, 729
- Fruchter et al. (2006) Fruchter, A. S. et al. 2006, Nature, 441, 463
- Fryer & Heger (2005) Fryer, C. L. & Heger, A. 2005, ApJ, 623, 302
- Fynbo et al. (2003) Fynbo, J. P. U. et al. 2003, A&A, 406, L63
- Gehrels et al. (2004) Gehrels, N. et al. 2004, ApJ, 611, 1005
- Graham & Fruchter (2013) Graham, J. F. & Fruchter, A. S. 2013, ApJ, 774, 119
- Greiner et al. (2008) Greiner, J. et al. 2008, PASP, 120, 405
- Greiner et al. (2007) — 2007, The Messenger, 130, 12
- Greiner et al. (2009) — 2009, A&A, 498, 89
- Greiner et al. (2011) — 2011, A&A, 526, A30
- Greiner et al. (2012) — 2012, Experimental Astronomy, 34, 551
- Hjorth et al. (2012) Hjorth, J. et al. 2012, ApJ, 756, 187
- Hjorth et al. (2003) — 2003, Nature, 423, 847
- Ilbert et al. (2006) Ilbert, O. et al. 2006, A&A, 457, 841
- Jaacks et al. (2012) Jaacks, J., Choi, J.-H., Nagamine, K., Thompson, R., & Varghese, S. 2012, MNRAS, 420, 1606
- Jaunsen et al. (2003) Jaunsen, A. O. et al. 2003, A&A, 402, 125
- Kaplan & Meier (1958) Kaplan, E. L. & Meier, P. 1958, J. Amer. Stat. Assn., 53, 457
- Katz et al. (2012) Katz, B., Sapir, N., & Waxman, E. 2012, ApJ, 747, 147
- Kistler et al. (2009) Kistler, M. D., Yüksel, H., Beacom, J. F., Hopkins, A. M., & Wyithe, J. S. B. 2009, ApJ, 705, L104
- Kistler et al. (2008) Kistler, M. D., Yüksel, H., Beacom, J. F., & Stanek, K. Z. 2008, ApJ, 673, L119
- Kocevski et al. (2009) Kocevski, D., West, A. A., & Modjaz, M. 2009, ApJ, 702, 377
- Krühler et al. (2011) Krühler, T. et al. 2011, A&A, 534, A108
- Krühler et al. (2008) — 2008, ApJ, 685, 376
- Krühler et al. (2015) — 2015, ArXiv.org, 1505.06743
- Kulkarni et al. (1998) Kulkarni, S. R. et al. 1998, Nature, 393, 35
- Laskar et al. (2011) Laskar, T., Berger, E., & Chary, R.-R. 2011, ApJ, 739, 1
- Levesque (2014) Levesque, E. M. 2014, PASP, 126, 1
- Levesque et al. (2011) Levesque, E. M., Berger, E., Soderberg, A. M., & Chornock, R. 2011, ApJ, 739, 23
- Levesque et al. (2010a) Levesque, E. M., Kewley, L. J., Berger, E., & Zahid, H. J. 2010a, AJ, 140, 1557
- Levesque et al. (2010b) Levesque, E. M., Kewley, L. J., Graham, J. F., & Fruchter, A. S. 2010b, ApJ, 712, L26
- MacFadyen & Woosley (1999) MacFadyen, A. I. & Woosley, S. E. 1999, ApJ, 524, 262
- Madau & Dickinson (2014) Madau, P. & Dickinson, M. 2014, ARA&A, 52, 415
- Maiolino et al. (2008) Maiolino, R. et al. 2008, A&A, 488, 463
- Mannucci et al. (2011) Mannucci, F., Salvaterra, R., & Campisi, M. A. 2011, MNRAS, 414, 1263
- Marsden et al. (2014) Marsden, D. et al. 2014, MNRAS, 439, 1556
- McBreen et al. (2010) McBreen, S. et al. 2010, A&A, 516, A71
- Meurer et al. (1999) Meurer, G. R., Heckman, T. M., & Calzetti, D. 1999, ApJ, 521, 64
- Mocanu et al. (2013) Mocanu, L. M. et al. 2013, ApJ, 779, 61
- Modjaz et al. (2008) Modjaz, M. et al. 2008, AJ, 135, 1136
- Mortlock et al. (2011) Mortlock, D. J. et al. 2011, Nature, 474, 616
- Nakar & Sari (2012) Nakar, E. & Sari, R. 2012, ApJ, 747, 88
- Nardini et al. (2011) Nardini, M. et al. 2011, A&A, 531, A39
- Oesch et al. (2012) Oesch, P. A. et al. 2012, ApJ, 745, 110
- Ota et al. (2010) Ota, K. et al. 2010, ApJ, 722, 803
- Ouchi et al. (2010) Ouchi, M. et al. 2010, ApJ, 723, 869
- Paul et al. (2011) Paul, J., Wei, J., Basa, S., & Zhang, S.-N. 2011, Comptes Rendus Physique, 12, 298
- Perley et al. (2009) Perley, D. A. et al. 2009, AJ, 138, 1690
- Perley et al. (2013) — 2013, ApJ, 778, 128
- Perley et al. (2011) — 2011, AJ, 141, 36
- Planck Collaboration et al. (2015) Planck Collaboration et al. 2015, ArXiv.org, 1502.01589
- Prochaska et al. (2007) Prochaska, J. X., Chen, H.-W., Dessauges-Zavadsky, M., & Bloom, J. S. 2007, ApJ, 666, 267
- R Core Team (2013) R Core Team 2013, R: A Language and Environment for Statistical Computing, R Foundation for Statistical Computing, Vienna, Austria
- Robertson & Ellis (2012) Robertson, B. E. & Ellis, R. S. 2012, ApJ, 744, 95
- Robertson et al. (2015) Robertson, B. E., Ellis, R. S., Furlanetto, S. R., & Dunlop, J. S. 2015, ApJ, 802, L19
- Salvaterra et al. (2012) Salvaterra, R. et al. 2012, ApJ, 749, 68
- Salvaterra et al. (2009) — 2009, Nature, 461, 1258
- Savaglio et al. (2009) Savaglio, S., Glazebrook, K., & Le Borgne, D. 2009, ApJ, 691, 182
- Savaglio et al. (2012) Savaglio, S. et al. 2012, MNRAS, 420, 627
- Schady et al. (2015) Schady, P. et al. 2015, ArXiv.org, 1505.04415
- Schechter (1976) Schechter, P. 1976, ApJ, 203, 297
- Schenker et al. (2013) Schenker, M. A. et al. 2013, ApJ, 768, 196
- Schlafly & Finkbeiner (2011) Schlafly, E. F. & Finkbeiner, D. P. 2011, ApJ, 737, 103
- Schmidt et al. (2014) Schmidt, K. B. et al. 2014, ApJ, 786, 57
- Schulze et al. (2015) Schulze, S. et al. 2015, ArXiv.org, 1503.04246
- Shimasaku et al. (2006) Shimasaku, K. et al. 2006, PASJ, 58, 313
- Shull et al. (2012) Shull, J. M., Harness, A., Trenti, M., & Smith, B. D. 2012, ApJ, 747, 100
- Sparre et al. (2014) Sparre, M. et al. 2014, ApJ, 785, 150
- Stanek et al. (2006) Stanek, K. Z. et al. 2006, Acta Ast., 56, 333
- Stanek et al. (2003) — 2003, ApJ, 591, L17
- Svennson (2011) Svennson, K. M. 2011, PhD thesis, University of Warwick
- Tanvir et al. (2009) Tanvir, N. R. et al. 2009, Nature, 461, 1254
- Tanvir et al. (2012) — 2012, ApJ, 754, 46
- Therneau (2012) Therneau, T. 2012, A Package for Survival Analysis in S, R package version 2.36-14
- Thöne et al. (2013) Thöne, C. C. et al. 2013, MNRAS, 428, 3590
- Tody (1993) Tody, D. 1993, in Astronomical Society of the Pacific Conference Series, Vol. 52, Astronomical Data Analysis Software and Systems II, ed. R. J. Hanisch, R. J. V. Brissenden, & J. Barnes, 173
- Trenti et al. (2015) Trenti, M., Perna, R., & Jimenez, R. 2015, ApJ, 802, 103
- Trenti et al. (2012) Trenti, M., Perna, R., Levesque, E. M., Shull, J. M., & Stocke, J. T. 2012, ApJ, 749, L38
- Trenti et al. (2013) Trenti, M., Perna, R., & Tacchella, S. 2013, ApJ, 773, L22
- Trenti et al. (2010) Trenti, M., Stiavelli, M., Bouwens, R. J., Oesch, P., Shull, J. M., Illingworth, G. D., Bradley, L. D., & Carollo, C. M. 2010, ApJ, 714, L202
- Tseliakhovich & Hirata (2010) Tseliakhovich, D. & Hirata, C. 2010, Phys. Rev. D, 82, 083520
- Vieira et al. (2010) Vieira, J. D. et al. 2010, ApJ, 719, 763
- Wanderman & Piran (2010) Wanderman, D. & Piran, T. 2010, MNRAS, 406, 1944
- Wang & Dai (2014) Wang, F. Y. & Dai, Z. G. 2014, ApJS, 213, 15
- Woosley (1993) Woosley, S. E. 1993, ApJ, 405, 273
- Woosley & Heger (2006) Woosley, S. E. & Heger, A. 2006, ApJ, 637, 914
- Xu et al. (2013) Xu, D. et al. 2013, GRB Coordinates Network, 14273, 1
- Yoon et al. (2006) Yoon, S.-C., Langer, N., & Norman, C. 2006, A&A, 460, 199
- Yoshida et al. (2003) Yoshida, N., Sokasian, A., Hernquist, L., & Springel, V. 2003, ApJ, 591, L1
- Yüksel et al. (2008) Yüksel, H., Kistler, M. D., Beacom, J. F., & Hopkins, A. M. 2008, ApJ, 683, L5
- Zheng et al. (2012) Zheng, W. et al. 2012, Nature, 489, 406
| GRB | Tel./Inst. | Filt | Exp (s) | Position | Aper. | magb | |
|---|---|---|---|---|---|---|---|
| 080810 | 3.355 | VLT/FORS2 | 7 1140 | 23h47m1051 +00∘19′116 | 160 | ||
| 090313 | 3.375 | 2.2m/GROND | 20 369 | ||||
| 090516 | 4.109 | 2.2m/GROND | 20 369 | 09h13m0259 –11∘51′149 | 150 | ||
| 090519 | 3.85 | VLT/FORS2 | 8 1140 | ||||
| 091109 | 3.076 | VLT/FORS2 | 6 1140 | 20h37m0180 –44∘09′295 | 125 | ||
| 100513A | 4.772 | VLT/FORS2 | 48 240 | 11h18m2681 +03∘37′399 | 070 | ||
| 100518A | VLT/FORS2 | 11 1140 | |||||
| 110818A | 3.36 | VLT/FORS2 | 5 600 | 21h09m2094 -63∘58′524 | 150 | ||
| VLT/FORS2 | 12 240 | 21h09m2094 –63∘58′524 | 150 | ||||
| 120805A | 2.2m/GROND | 12 369 | 14h26m0913 +05∘49′318 | 110 | |||
| 120909A | 3.93 | VLT/FORS2 | 33 240 | 18h22m5672 –59∘26′541 | 076 | ||
| 120922A | 2.2m/GROND | 12 369 | |||||
| 121201A | 3.385 | 2.2m/GROND | 18 369 | 00h53m5216 –42∘56′351 | 150 | ||
| 130408A | 3.757 | 2.2m/GROND | 18 369 | ||||
| 2.2m/GROND | 18 369 |
Note. — a Redshifts with errors are photometric redshifts. b Upper limits are at the 2 confidence level.
| GRB | mag | DM | SFR ( yr-1) | References | ||||
|---|---|---|---|---|---|---|---|---|
| 140114A | 0.014 | Krühler et al. (2015) | ||||||
| 080607 | 3.036 | 0.019 | 47.06 | 1.92 | Perley et al. (2013) | |||
| Jy | 1.59 | 21.88(10) | 55.5(53) | Chary et al. (2007) | ||||
| 060607A | 3.075 | 0.025 | 47.09 | 2.10 | 17.26 | 0.3 | Hjorth et al. (2012) | |
| 2.29 | 0.1 | Svennson (2011) | ||||||
| 2.00 | 19.08 | 2.0 | Chen et al. (2009) | |||||
| 091109 | 3.076 | 0.026 | 47.09 | 1.84 | 4.2(4) | This work | ||
| 120922A | 0.128 | 2.00 | 7.5(8) | This work | ||||
| 120805A | 0.027 | This work | ||||||
| 111123A | 3.152 | 0.047 | 47.16 | 1.57 | 67(21) | Xu et al. (2013) | ||
| 020124 | 3.198 | 0.041 | 47.19 | 2.27 | 0.06 | Berger et al. (2002); Chen et al. (2009) | ||
| 2.00 | 19.56 | 3.1 | Chen et al. (2009) | |||||
| 060926 | 3.206 | Jy | 0.138 | 47.20 | 1.62 | 40.1(17) | Laskar et al. (2011) | |
| 060526 | 3.221 | 0.056 | 47.21 | 2.00 | 18.32 | 1.0 | Hjorth et al. (2012) | |
| 2.09 | 0.4 | Svennson (2011) | ||||||
| 050319 | 3.24 | Jy | 0.010 | 47.23 | 1.69 | 19.7(22) | Laskar et al. (2011) | |
| 050908 | 3.347 | 0.021 | 47.31 | 2.01 | 0.7(4) | Hjorth et al. (2012) | ||
| 2.00 | 19.73 | 3.7 | Chen et al. (2009) | |||||
| 080810 | 3.355 | 0.024 | 47.32 | 1.53 | 102.7(48) | This work | ||
| 110818A | 3.36 | 0.031 | 47.32 | 1.61 | 44.3(21) | This work | ||
| 1.54 | 22.31(7) | 89.1(59) | This work | |||||
| 030323 | 3.372 | 0.049 | 47.33 | 1.96 | 1.2(1) | Chen et al. (2009) | ||
| 090313 | 3.375 | 0.024 | 47.33 | 2.00 | 14.2 | This work | ||
| 121201A | 3.385 | 0.008 | 47.34 | 1.70 | 17.4(37) | This work | ||
| 971214 | 3.418 | 0.016 | 47.37 | 1.77 | 8.6(13) | Kulkarni et al. (1998); Perley et al. (2013) | ||
| 060707 | 3.424 | 0.019 | 47.37 | 1.69 | 19.9(11) | Hjorth et al. (2012) | ||
| Jy | 1.65 | 21.34(9) | 30.2(27) | Laskar et al. (2011) | ||||
| 061110B | 3.434 | 0.035 | 47.38 | 1.82 | 5.5(17) | Hjorth et al. (2012) | ||
| 980329 | 0.064 | 1.82(3) | 5.1(5)(13) | Jaunsen et al. (2003) | ||||
| 1.84(2) | 19.59(27)(22) | 4.3(12)(11) | Bloom et al. (2002) | |||||
| 060115 | 3.533 | 0.113 | 47.45 | 1.91 | 2.1(13) | Hjorth et al. (2012) | ||
| 090323 | 3.569 | 0.021 | 47.48 | 1.67 | 21.17(15)∗ | 25.0(37) | McBreen et al. (2010) | |
| 1.62 | 40.4(73) | McBreen et al. (2010) | ||||||
| 070721B | 3.626 | 0.027 | 47.52 | 1.97 | 1.1(6) | Hjorth et al. (2012) | ||
| 2.00 | 20.07 | 5.0 | Chen et al. (2009) | |||||
| 060906 | 3.686 | Jy | 0.175 | 47.56 | 2.00 | 8.2 | Laskar et al. (2011) | |
| 130408A | 3.757 | 0.220 | 47.61 | 2.00 | 20.77∗ | 9.6 | This work | |
| 2.00 | 13.4 | This work | ||||||
| 060605 | 3.773 | 0.044 | 47.62 | 1.82 | 19.81(30)∗ | 5.5(17) | Ferrero et al. (2009) | |
| 2.02 | 0.7(1) | Svennson (2011) | ||||||
| 050502 | 3.793 | Jy | 0.009 | 47.64 | 2.00 | 6.5 | Laskar et al. (2011) | |
| 081029 | 3.848 | 0.027 | 47.67 | 2.00 | 4.2 | Nardini et al. (2011) | ||
| 090519 | 3.85 | 0.035 | 47.67 | 2.00 | 2.0 | This work | ||
| 060210 | 3.913 | 0.080 | 47.72 | 1.61 | 45.5(92) | Perley et al. (2009) | ||
| Jy | 1.60 | 21.80(7) | 50.4(36) | Laskar et al. (2011) | ||||
| 120909A | 3.93 | 0.076 | 47.73 | 1.67 | 24.7(29) | This work | ||
| 050730 | 3.968 | 0.043 | 47.75 | 2.00 | 19.49 | 3.0 | Chen et al. (2009) | |
| 2.10 | 0.3 | Svennson (2011) | ||||||
| 100518A | 0.067 | This work | ||||||
| 060206 | 4.048 | 0.011 | 47.80 | 1.96 | 1.2(1) | Chen et al. (2009) | ||
| 090516 | 4.109 | 0.050 | 47.84 | 1.69 | 20.4(91) | This work | ||
| 080916C | 0.291 | 2.00 | 8.2(5) | Greiner et al. (2009) | ||||
| 060223A | 4.406 | 0.100 | 48.02 | 2.00 | 20.25∗ | 5.9 | Hjorth et al. (2012) | |
| 1.98 | 1.1(2) | Svennson (2011) | ||||||
| 000131 | 4.50 | 0.047 | 48.08 | 2.00 | 21.19∗ | 14.2 | Andersen et al. (2000) | |
| 2.00 | 17.9 | Andersen et al. (2000) | ||||||
| 090205 | 4.65 | 0.101 | 48.16 | 1.66 | 27.7(35) | D’Avanzo et al. (2010) | ||
| 2.00 | 20.57 | 8.0 | D’Avanzo et al. (2010) | |||||
| 100219A | 4.667 | 0.066 | 48.17 | 1.82 | 5.1(30) | Thöne et al. (2013) | ||
| 100513A | 4.772 | 0.046 | 48.23 | 1.81 | 6.0(18) | This work | ||
| 060510B | 4.942 | Jy | 0.034 | 48.31 | 1.74 | 12.0(21) | Chary et al. (2007) | |
| 111008A | 4.99 | 0.004 | 48.34 | 2.00 | 9.9 | Sparre et al. (2014) |
Note. — (1) The third column contains measured magnitudes/fluxes, i.e. without any correction for Galactic foreground or host-intrinsic extinction. Observed magnitudes are in the Vega system, and magnitudes and HST measurements are in the AB system, except where noted. (2) Spitzer upper limits (3) from Laskar et al. (2011) are used only when no competitive limits are available at other wavelengths. (3) All upper limits are 2 confidence level; in some cases, reported 3 upper limits have been transformed into 2 limits by adding 0.44 mag (e.g. for measurements from Hjorth et al. 2012). Observed magnitudes are corrected for Galactic foreground extinction (Schlafly & Finkbeiner, 2011) before conversion to absolute magnitudes, using and , , , , , , , , and . (4) is the slope of the assumed power-law spectrum of the star-forming galaxy () which is used to compute the k-correction according to . (5) is the inferred absolute AB magnitude of the host galaxy (or limit) at Å in the rest frame. Measurements and limits used to construct the luminosity function are listed in boldface. (6) Horizontal lines indicate that, as discussed in the text, at redshifts (), / (/) measurements are preferred, as Ly- has moved into the / (/) bandpass. estimates with an asterisk have been corrected for this effect assuming a 60% suppression of the continuum blueward of Lyman-alpha. Applied corrections are: mag for 090323; mag for 130408A; mag for 060605, 081029, and 090519; 0.00, , and mag for 100518A at , 4.0, and 4.3, respectively; mag for 060223A; and mag for 000131. Quoted values and SFR estimates derived from these measurements incorporate these corrections.