dateToday
Strong interaction between electrons and collective excitations in multiband superconductor MgB2
Abstract
We use a tunable laser ARPES to study the electronic properties of the prototypical multiband BCS superconductor MgB2. Our data reveal a strong renormalization of the dispersion (kink) at 65 meV, which is caused by coupling of electrons to the E2g phonon mode. In contrast to cuprates, the 65 meV kink in MgB2 does not change significantly across Tc. More interestingly, we observe strong coupling to a second, lower energy collective mode at binding energy of 10 meV. This excitation vanishes above Tc and is likely a signature of the elusive Leggett mode.
pacs:
74.25.Jb, 74.72.Hs, 79.60.BmIn conventional superconductors, the pairing is mediated by phonons and favored by strong electron-phonon coupling, as described by Bardeen-Cooper-Schrieffer (BCS) theoryBardeen . This strong electron-phonon coupling in general gives rise to a renormalization of the band dispersion called a “kink” and an abrupt change of quasiparticle lifetime at an energy related to the phonon frequency, . This idea has been extended to unconventional superconductors, where the mechanism of pairing is unknown, and the coupling of electrons to several collective excitations was reported MODE1 ; MODE2 ; Valla ; Bogdanov ; Kaminski ; KondoLowKink . Their origin and relation to pairing is still debated. For example the ”70meV” kink in Bi2212 cuprate is strongest at the antinode and vanishes above TcKaminski a behavior that resembles the magnetic resonance mode reported by inelastic neutron scattering CuRes ; however, the electron-phonon interaction may have similar characteristics TCuk ; Devereaux . On the other hand, the kinks in the dispersion along the nodal direction in single layer Bi2201 do not seem to change significantly with temperature Meevasana . Surprisingly, there is little data on dispersion renormalization effects in conventional superconductors; several low energy kinks have been reported in NbSe2 Rossnagel , but the situation is complicated by the presence of a charge density wave phase coexisting with superconductivity, and the measurements were carried out only at low temperatures. In other materials, difficulties in clearly observing three dimensional band dispersions and low transition temperatures are limiting factors. MgB2 Nagamatsu ; Budko ; Kortus ; JMAn ; AYLiu ; Choi is a notable exception: it is a layered material with multi-gap, phonon-mediated superconductivity at Tc= 39K with some quasi-two-dimensional bands, making it an ideal candidate to study the temperature dependence of the dispersion renormalization due to electron-phonon coupling. LDA calculations Kortus predict four bands crossing Fermi level in MgB2: two quasi 2D -bands from , orbitals around and two 3D -bands from orbital Uchiyama ; Souma ; Tsuda . The superconductivity is believed to caused by the phonon mode at 75meV that couples strongly to the 2D -bands, but more weakly to the -bands AYLiu , leading to two different gaps, meV and meV, as revealed by previous tunneling Szabo and ARPES studies Souma . Inelastic neutron scattering studies have reported optical phonon modes at 35, 55, 75, 85 and 100 meV OsbornPRL2001 , while Raman scattering reports a single, broad asymmetric peak at 75meV, attributed to the mode, as well as a sharp peak at meV due to a pair breaking excitation Quilty . As a bonus, due to its multi-gap nature, MgB2 also contains another exotic collective mode that can couple to the electrons: the Leggett mode Leggett ; Agterberg ; Brinkman ; Ponomarev ; Blumberg . This mode is a longitudinal fluctuation corresponding to equal and opposite displacements of the two condensates. As it is a neutral excitation, it is not pushed up to the plasma frequency like the Bogoliubov-Anderson mode, however, it is predicted to have a mass in-between and for MgB2, where it will be partially damped by decaying into quasiparticles LMtheory . As the superconductivity is believed to be phonon mediated and due to intraband pairing, the two gaps are expected to have the same relative sign, giving rise to pairing, by contrast to the iron based superconductors, where interband repulsive pairing likely leads to pairing and a Leggett mode is not expected.
High resolution band dispersion data demonstrating the coupling of the conduction electrons to collective excitations such as phonons or Leggett modes are not available in the published literature. One of the main reasons is that high quality single crystals need to be synthesized under high pressure, resulting in rather small 500 m crystals, which are difficult to measure in traditional ARPES setups. We use tunable laser ARPES to study the electronic properties of MgB2 multiband superconductivity. The use of low photon energy increases significantly the bulk sensitivity due to increased escape depth and momentum resolution due to increased Ådeg ratio. The ability to focus the laser beam down to 30m enables measurement of very small single crystals and also helps to improve the momentum resolution. We find evidence for strong coupling of conduction electrons to a 75 meV acoustic phonon with estimated at that persists above Tc, unlike those in the cuprates. In fact we observe no significant changes with temperature up to 65K, more than 50% above Tc. Furthermore, we observe a very strong renormalization of the dispersion in the superconducting state at 10 meV. Instead of the expected Bogoliubov-like back bending of the dispersion, a sharp, non-dispersive quasiparticle peak centered at the gap energy of 6.5 meV is present and is separated by a dip from the high energy spectral weight. All these features vanish above Tc as expected for a superfluid excitation and are likely due to interaction of electrons with a Leggett mode.
MgB2 single crystals with Tc = 39 K and typical size of mm3 were grown in Ames Laboratory by a high pressure synthesis technique similar to that outlined in Ref. Karpinski using pure 11B isotope. Optimally doped Bi2Sr2CaCu2O8+δ (Bi2212) single crystals with =93K (OP93K) were grown by the conventional floating-zone (FZ) technique. Sample were cleaved in situ at a base pressure lower than 8 10-11 Torr. ARPES measurements were carried out using a laboratory-based system consisting of a Scienta R8000 electron analyzer and tunable VUV laser light sourceRJiang . All data were acquired using a photon energy of 6.7 eV. The energy resolution of the analyzer was set at 1 meV and angular resolution was 0.13∘ and 0.5∘ along and perpendicular to the direction of the analyzer slits, respectively. Samples were cooled using a closed cycle He refrigerator and temperature was measured using a silicon-diode sensor mounted on the sample holder. The energy corresponding to the chemical potential was determined from the Fermi edge of a polycrystalline Au reference in electrical contact with the sample. The aging effect was checked by recycle measurements. The consistency of the data was confirmed by measuring several samples.
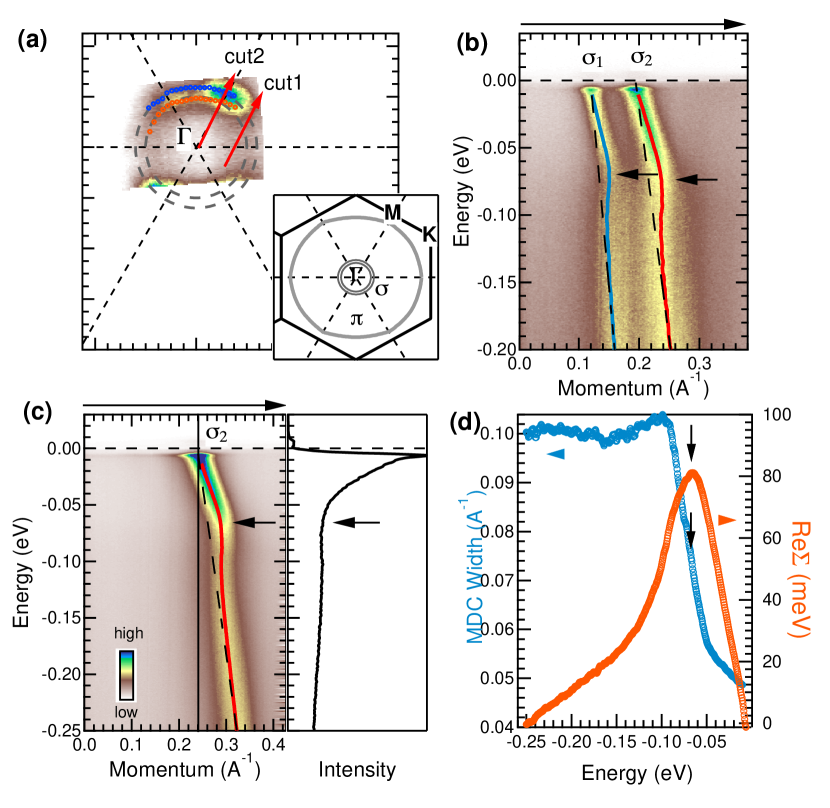
The Fermi surface data are shown in Fig. 1a, with a schematic plot of the Brillouin zone inset. We used the peak position of MDCs at EF to quantitatively extract kF. Results are superposed as red points on image data. Both FS sheets are round with kF 0.2 Å-1 and 0.25 Å-1 respectively. If we ignore the small warping of these two sheets along kz, the contribution to carrier concentration would be 0.069 holes for inner FS sheet and 0.108 holes for outer one. The measured area of the outer FS is consistent with previous quantum oscillation results, while the inner one is slightly largerYelland . Fig. 1 (b, c) show ARPES intensity plots at two different cuts in the Brillouin zone. In the data measured along cut #1 (Fig. 1b) the Fermi crossing for both sheets are clearly visible, whereas in the cut #2, along symmetry axis (Fig. 1c), intensity of the inner -band is strongly suppressed due to the matrix element effect. In order to quantitatively analyze the renormalization effects due to the collective modes, we fit the MDCs of each data set with Lorenzians and plot such extracted dispersion as blue and red lines in Fig. 1 (b) and (c). It should be noted that MDC peaks do not reflect the dispersion at very low energies in the presence of the superconducting gap therefore the fitting is carried out only for binding energies larger than 2. We estimate bare dispersion by extrapolation from higher binding energies and plot them as dashed lines. In all three data sets, a very pronounced kink structure is clearly visible (indicated by arrows), where the renormalized dispersion deviates from bare estimate. In this case, the renormalization of the dispersion (kink) is the fingerprint of coupling the conduction electrons to phonon mode(s). This coupling is rather strong and the energy distribution curves (EDCs) at kF develop a dip (right side of panel 1 (c)). The kink in dispersion and dip in EDC occurs at -(70-75) meV. By comparison with Raman data Quilty , we can conclude that it is due to the E2g optical phonon responsible for pairing in MgB2 AYLiu . We subtract an estimated bare dispersion from the measured one to obtain the approximate , and use the widths of the Lorentzian MDC fits to obtain . These quantities are plotted in panel 1 (d). Not surprisingly, has a peak at -70 meV, which is very close to the phonon energy. rises rapidly with binding energy and has a mid-point of the step roughly located at the same energy as the peak in . The line shape of both curves is consistent with them being related by Kramers-Kronig. This is further verified by simulations presented in Supplemental Material.
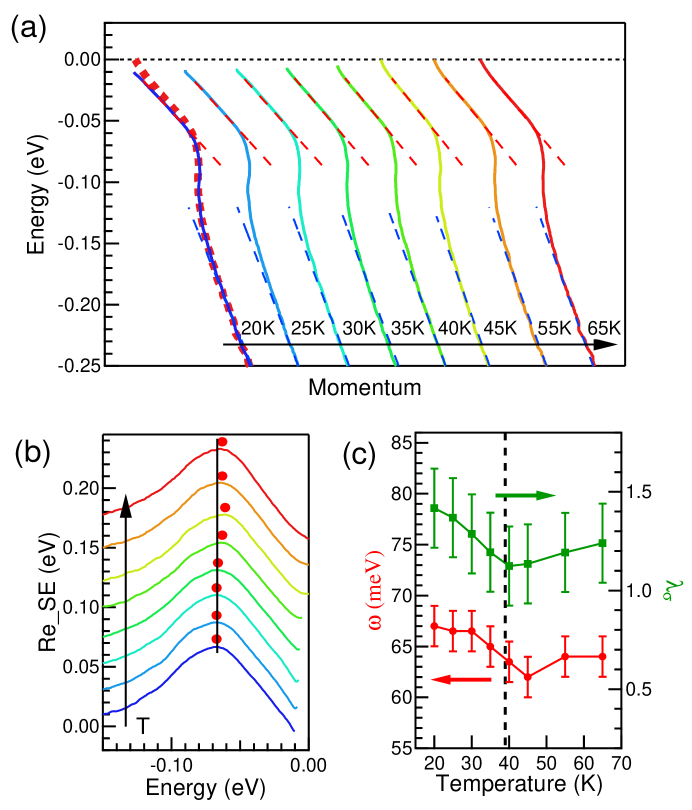
The dispersion data extracted by fitting the positions of the MDC peaks for several temperatures both below and above Tc are shown in Fig. 2(a). There are no significant changes to the kink structure across Tc as evident from overlay of the high temperature curve (dashed red line) onto the lowest temperature one. The only noticeable changes occur at low energies due to the opening of the superconducting gap. Following the procedure outlined above, we extract for each temperature, and plot these in Fig. 2(b). The peak position does move to lower energies as the temperature decreases, starting at Tc, consistent with the expectation that the peak frequency increases from . However, the magnitude of the shift, meV is significantly smaller than the expected meV. In fact, this shift should be even larger as the screening electrons are gapped out and E2g phonon hardens below Tc. This hardening was predicted to be or meV AYLiu , but Raman measurements find that it only shifts by meV Mialitsin . So the overall shift below Tc is naively expected to be meV. However, this analysis neglects the multi-gap nature, which may account for shifts as small as meV by allowing scattering into the band.
In addition to extracting the energy of the collective mode, we also can estimate the electron-phonon coupling , where and are the bare and renormalized Fermi velocity respectively. is estimated from the dispersion at high energy and is obtained from the dispersion above the kink (as illustrated in Fig. 2a by red dashed and blue dotted lines). For cut #2 in Fig. 1c, 3.77 and 1.56, which implies =1.42. The electron-phonon coupling can be calculated numerically, where it results from scattering between the and -bands, or from intra--band scattering, , for a total of Mazin ; AYLiu , which is slightly smaller, but within error bars of our results given uncertainty of estimating .
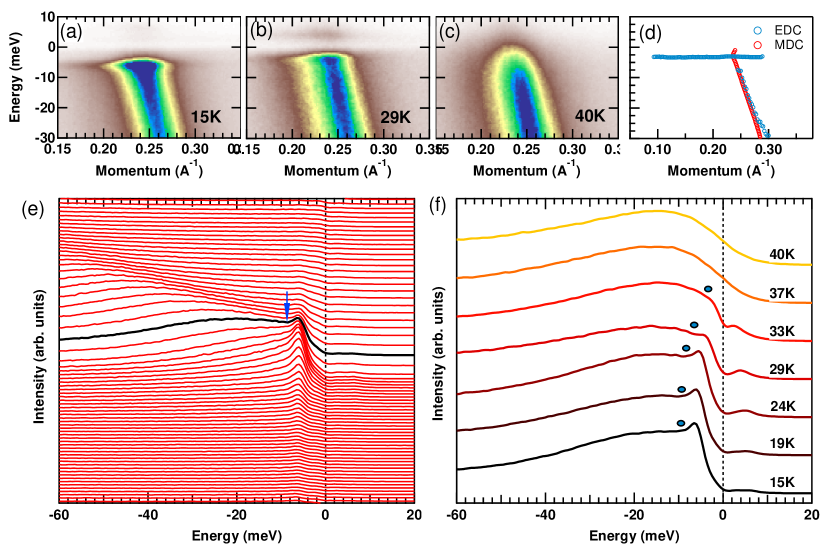
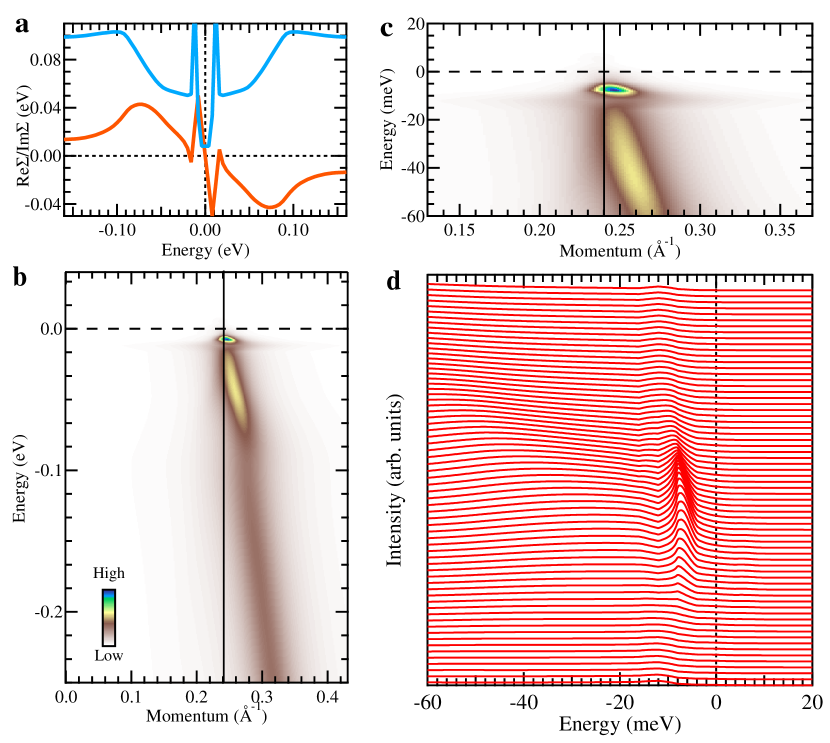
We now turn to describe the second, low energy excitation present only below the superconducting transition. In Fig. 3 (a-c) we plot the dispersion of the -band in close proximity to EF below and above Tc. At low temperature, well below Tc, the shape of the dispersion is rather unusual for a superconductor. Instead of back bending of the band as it reaches the energy of the superconducting gap, a sharp streak of intensity is present at the gap energy on either side of kF. At 29K (panel b) this feature is also above EF due to increased thermal excitation. All of these features vanish just above Tc (panel c), where the ordinary conduction band is present. In panel (d) we plot the dispersion of the low temperature features extracted using EDC and MDC fits. The sharp peak of intensity is almost dispersionless and persists over k of 0.2 Å-1 unlike what is expected for Bogolubov quasiparticles Campuzano ; Matsui . The EDCs for low temperature data are plotted in panel (e). Here again we observe a sharp, dispersion less quasiparticle peak centered at the energy of the SC gap and separated from the rest of the spectral weight by a dip at 10 meV (marked by an arrow). The temperature dependence of the EDCs slightly off kF are shown in panel (f). A clear dip in the spectrum is observed, which vanishes as the temperature approaches Tc. All of these features are due to abrupt changes in the self energy (i. e. onset of resonant scattering) and are very characteristic of an interaction between the electrons and a collective excitation. It should be noted that opening of the SC gap can lead to suppression of scattering within energy of 3=19.5 meV for intra-band and +2= 9.5 meV for inter-band electron channels. We do not observe signatures of suppression of intra-band scattering (i. e. line shape features at 19.5 meV) which are deemed to be stronger than inter-band onesMazin2002 . Further more, strong suppression of scattering and reduction of below certain energy alone cannot produce a spectral dip and non-dispersive peaks. That requires a resonant process such as interaction with a collective mode that causes a peak in . An illustration of this in form of simulations of the spectral function for various scenarios of are presented in the Supplementary Material. The lowest energy of an optical phonon in MgB2 is 35 meV and there are no other obvious low energy excitations that could couple strongly to the electrons other than the Leggett mode. Whereas Raman spectroscopy has found the Leggett mode at 9.4meV Blumberg , the similarity of this value to the dip energy of 10 meV is coincidental, as the dip occurs at the frequency where electrons above the gap may scatter into the collective mode plus quasiparticles above the superconducting gap. Therefore we extract the value of the mode energy from ARPES data of 3.5 meV, which is the difference between energy location of sharp peak and dip in the spectrum. We stress that this is an estimate as the dip location is slightly affected by functional form of the self energy. The vertex corrections for Raman spectroscopyBlumberg ; LMtheory and ARPES are almost certainly different and can potentially explain the the difference between the Leggett mode energy measured by the two techniques. Previous electron spectroscopy studies reported the value of the Leggett mode energy of 3.9-4.0 meV, consistent with our results. While the bare mode was calculated to have a frequency of 5.1-6.2meVBlumberg ; LMtheory , if the experimentally measured meV is used, the calculated frequencies decrease to 3.8-4.5meV. More theoretical efforts will be required to fully understand the origin of the difference.
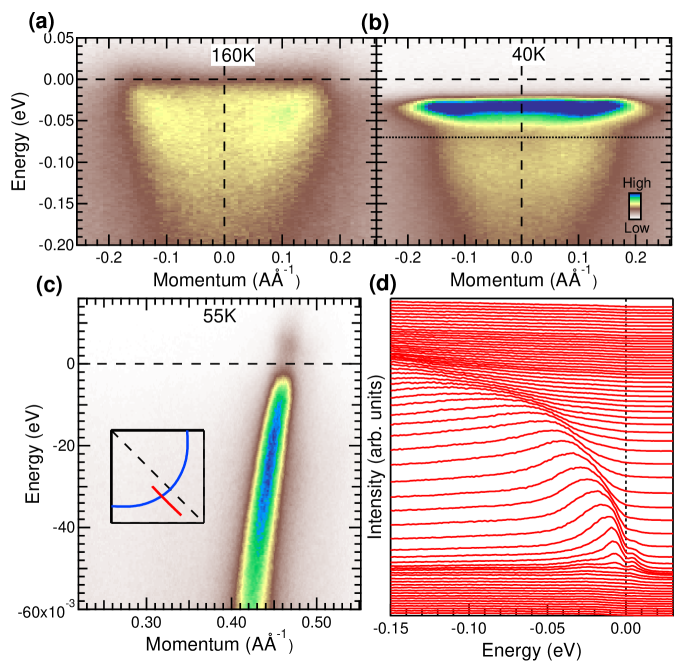
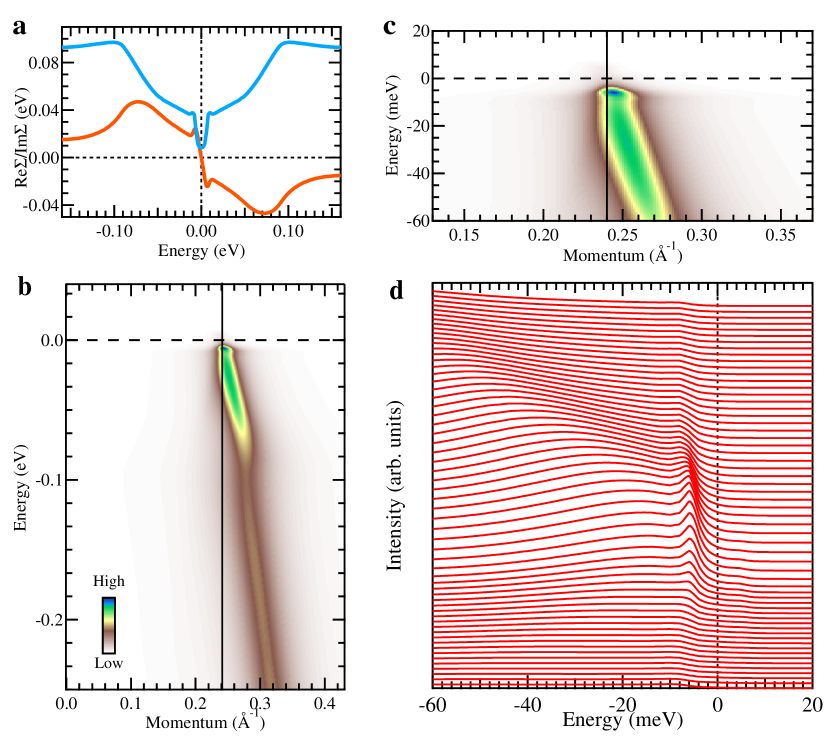
We also note that spectral characteristics reported in Fig. 3 (non-dispersive sharp peak and presence of a dip) closely resemble features observed at antinode in the cuprates that are attributed to strong coupling of electrons to a collective mode. The single order parameter of the cuprates does not support a Leggett mode, but these properties are characteristic of any collective mode developing only below the superconducing transition. In Fig. 4 we show data from optimally doped Bi2212 for comparison. Panels a and b show data at the antinode where electrons couple strongly to a collective mode below Tc. In SC state a very sharp, weakly dispersing peak emerges at the energy of the SC gap followed by a dip of intensity. These two features - lack of substantial dispersion of the sharp quasiparticle peak and presence of a dip are key signatures of the interaction with a collective mode. The data close to the node (=8 meV) where the coupling to low energy modes in Bi2212 is very weakKondoLowKink in SC state display Bogoliubov-like dispersion and sharp, non-dispersive peaks are absent. This is in stark contrast to antinodal direction and present data from MgB2.
Our results demonstrate that in a prototypical, conventional superconductor MgB2, the coupling of the conduction electrons to phonon mode is not significantly affected by the SC transition. This is in contrast to behavior of the collective mode at antinode in cuprates, which disappears upon transition to normal state. We also discovered a signature of second collective mode in MgB2 with energy 3.5 meV that exists only below Tc. All characteristic of this mode are consistent with Leggett mode which arises due to the relative oscillation of the phases of two superconducting condensates present in this material.
We thank Andrey Chubukov, Mohit Randeria, Rafael Fernandes, Ilya Eremin and Mike Norman for very useful discussions. Research was supported by the US Department of Energy, Office of Basic Energy Sciences, Division of Materials Sciences and Engineering. Ames Laboratory is operated for the US Department of Energy by the Iowa State University under Contract No. DE-AC02-07CH11358. Work at Brookhaven (Bi2212 sample growth and characterization) is supported by the US DOE under Contract No. DE-AC02-98CH10886. JSW and ZJX are supported by the Center for Emergent Superconductivity, an Energy Frontier Research Center funded by the US DOE, Office of Science.
∗Corresponding author kaminski@ameslab.gov
References
- (1) J. Bardeen, L. N. Cooper, and J. R. Schrieffer, Phys. Rev. 108, 1175 (1957).
- (2) N. W. Ashcroft and N. Mermin “Solid State Physics”, Saunders College Publishing, pp 521 (1976)
- (3) T. Valla, A. V. Fedorov, P. D. Johnson, and S. L. Hulbert, Phys. Rev. Lett. 83, 2085 (1999).
- (4) M. R. Norman et al., Phys. Rev. Lett. 79, 3506 (1997); M. R. Norman and H. Ding, Phys. Rev. B 57, R11089 (1998).
- (5) J.C. Campuzano et al., Phys. Rev. Lett. 83, 3709 (1999).
- (6) T. Valla et al., Science 285, 2110 (1999).
- (7) P. V. Bogdanov et al., Phys. Rev. Lett. 85, 2581(2000)
- (8) A. Kaminski et al., Phys. Rev. Lett. 86, 1070 (2001)
- (9) T. Kondo, Y. Nakashima, W. Malaeb, Y. Ishida, Y. Hamaya, T. Takeuchi, and S. Shin, Phys. Rev. Lett. 110, 217006, (2013).
- (10) H. A. Mook, M. Yethiraj, G. Aeppli, T. E. Mason and T. Armstrong, Phys. Rev. Lett. 70 3490 (1993); H. Fong et al., Nature 398 588 (1999).
- (11) T. Cuk et al., Phys. Rev. Lett. 93, 117003 (2004).
- (12) T. P. Devereaux, T. Cuk, Z. X. Shen, N. Nagaosa,, Phys. Rev. Lett. 93, 117004 (2004).
- (13) D. J. Rahn, S. Hellmann, M. Kallane, C. Sohrt, T. K. Kim, L. Kipp, and K. Rossnagel, Phys. Rev. B 85, 224532 (2012).
- (14) W. Meevasana, N. J. C. Ingle, D. H. Lu, J. R. Shi, F. Baumberger, K. M. Shen, W. S. Lee, T. Cuk, H. Eisaki, T. P. Devereaux, N. Nagaosa, J. Zaanen, and Z.-X. Shen, Phys. Rev. Lett. 96, 157003 (2006).
- (15) J. Nagamatsu et al., Nature (London) 410, 63 (2001).
- (16) S. L. Bud’ko et al., Phys. Rev. Lett. 86, 1877 (2001).
- (17) J. Kortus, I. I. Mazin, K. D. Belashchenko, V. P. Antropov, L. L. Boyer, Phys. Rev. Lett. 86, 4656 (2001).
- (18) J. M. An and W. E. Pickett, Phys. Rev. Lett. 86, 4366 (2001).
- (19) A.Y. Liu, I. I. Mazin, and J. Kortus, Phys. Rev. Lett. 87, 087005 (2001).
- (20) H. J. Choi et al., Nature (London) 418, 758 (2002).
- (21) A. J. Leggett, Prog. Theor. Phys. 36, 901 (1966).
- (22) D. F. Agterberg, E. Demler, and B. Janko, Phys. Rev. B 66, 214507 (2002).
- (23) A. Brinkman and J. M. Rowell, Physica C: Superconductivity and Its Applications 456, 188 (2007).
- (24) Y. G. Ponomarev, S. A. Kuzmichev, M. G. Mikheev, M. V. Sudakova, S. N. Tchesnokov, H. H. Van, B. M. Bulychev, E. G. Maksimov, and S. I. Krasnosvobodtsev, Jetp Letters 85, 46 (2007).
- (25) G. Blumberg, A. Mialitsin, B. S. Dennis, M. V. Klein, N. D. Zhigadlo, and J. Karpinski, Phys. Rev. Lett. 99, 227002 (2007)
- (26) P. Szabo, P. Samuely, J. Kacmarcik, T. Klein, J. Marcus, D. Fruchart, S. Miraglia, C. Marcenat, and A. G. M. Jansen, Phys. Rev. Lett. 87, 137005 (2001).
- (27) S. Souma et al., Nature 423, 65 (2003).
- (28) R. Osborn, E. A. Goremychkin, A. I. Kolesnikov, and D. G. Hinks, Phys. Rev. Lett. 87, 017005 (2001).
- (29) J. W. Quilty, S. Lee, A. Yamamoto, and S. Tajima, Phys. Rev. Lett. 88, 087001 (2002).
- (30) M. V. Klein, Phys. Rev. B 82, 014507(2010); F. J. Burnell, J. Hu, M. M. Parish, and B. A. Bernevig, Phys. Rev. B 82, 144506 (2010); S.-Z. Lin and X. Hu, Phys. Rev. Lett. 108, 177005 (2012); M. Marciani, L. Fanfarillo, C. Castellani, and L. Benfatto, Phys. Rev. B 88, 214508 (2013).
- (31) H. Uchiyama et al., Phys. Rev. Lett. 88, 157002 (2002).
- (32) S. Tsuda et al., Phys. Rev. Lett. 91,127001 (2003) .
- (33) J. Karpinski et al., Physica C 456, 3 (2007).
- (34) R. Jiang et al., Rev. Sci. Instrum. 85, 033902 (2014).
- (35) L. Petaccia et al., New Journal of Physics 8, 12 (2006).
- (36) E. A. Yelland et al., Phys. Rev. Lett. 88, 217002 (2002); A. Carrington et al., Phys. Rev. Lett. 91, 037003 (2003).
- (37) A. Mialitsin, B. S. Dennis, N. D. Zhigadlo, J. Karpinski, G. Blumberg, Phys. Rev. B75, 020509(R) (2007).
- (38) I.I. Mazin, V.P. Antropov, Physica C 385, 49 (2003).
- (39) H. Matsui, T. Sato, T. Takahashi, S. C. Wang, H. B. Yang, H. Ding, T. Fujii, T. Watanabe, and A. Matsuda, Phys. Rev. Lett. 90, 217002 (2003).
- (40) J. C. Campuzano, H. Ding, M. R. Norman, M. Randeria, A. F. Bellman, T. Yokoya, T. Takahashi, H. Katayama-Yoshida, T. Mochiku, and K. Kadowaki, Phys. Rev. B 53, R14737 (1996).
- (41) I.I. Mazin et al, Phys. Rev. Lett. 89, 107002 (2002).
Supplemental materials for Strong interaction between electrons and collective excitations in multiband superconductor MgB2
I Simulation procedure
ARPES is an ideal tool with which to examine electron-boson coupling, as both the real, and imaginary, parts of the self-energy can be straightforwardly extracted from momentum distribution curves (MDCs). is the shift away from the bare dispersion, as extrapolated from high energy data, while the scattering rate is proportional to the width of the MDC. For interactions with a collective mode at a single frequency, , is peaked close to , while exhibits a step-like increase with the mid point close to , as quasiparticles can now decay into the mode. The electron-boson coupling strength, for each band depends on the renormalization of the effective mass, . For a more complicated phonon spectrum, both parts of the self-energy can simply be calculated from the Eliashberg coupling function, , which can be calculated numerically, allowing for a precise comparision. The temperature dependence of should be weak for . However, as superconductivity gaps out the quasiparticles, the peak/step is expected to shift to , at least within a simple BCS picture. Superconductivity can similarly affect the energy of the dispersion anomalies, as phonons with energies above (below) the gap are expected to harden (soften) when the material is cooled through the transition. Strong electron-electron interactions can also strongly renormalize the bandstructure, however, these effects should be small in MgB2.
Below we illustrate the impact of features in the self energy on ARPES spectra by performing simulations of the ARPES intensity for several scenarios of self energy. We start with an assumed form of the imaginary part of the self energy. We then calculate the real part of the self energy using a Kramer-Kronig transformation, using a reasonable value of the cut-off frequency of 1eV. The spectral function is then calculated using the following, well established formula:
where k is momentum, is binding energy, and are the real and imaginary parts of the self energy respectively, is the magnitude of the superconducting gap, =vFk is assumed linear band dispersion with Fermi velocity of 4 eV. Coefficients uk and vk are standard BCS coherence factors:
The ARPES intensify is then calculated by multiplying the spectral function by the Fermi function: .
II Results
II.1 Normal state
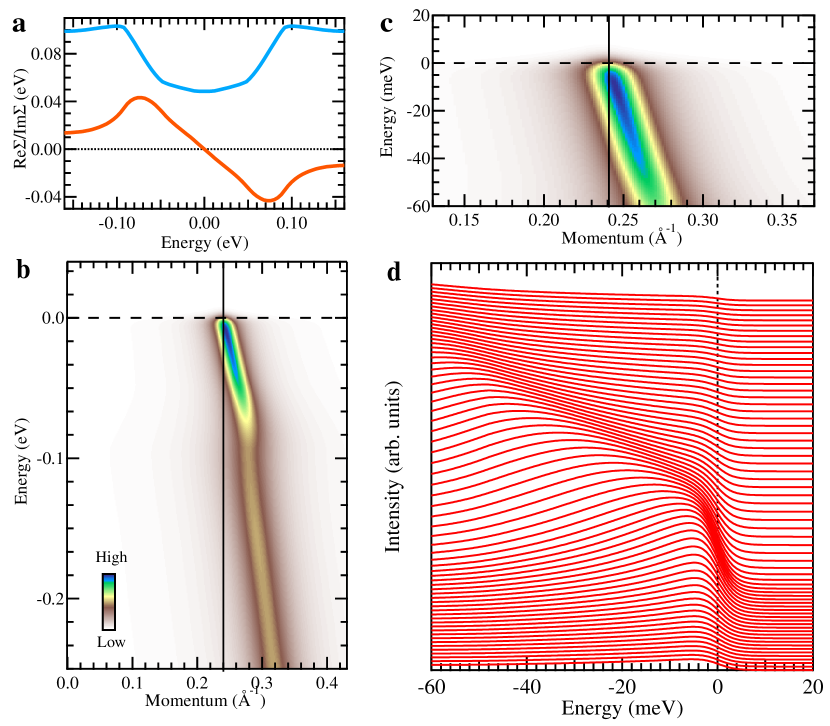
We begin by plotting in Fig. S1 the calculated ARPES intensity and EDCs for the normal state assuming the form of self energy based on the data in Fig. 1 of the main text. The resulting dispersion is very similar to what is observed in the actual data, with a well pronounced kink due the changes in the real part of the self energy. Such changes in the real system are usually caused by the onset of scattering.
II.2 Superconducting state
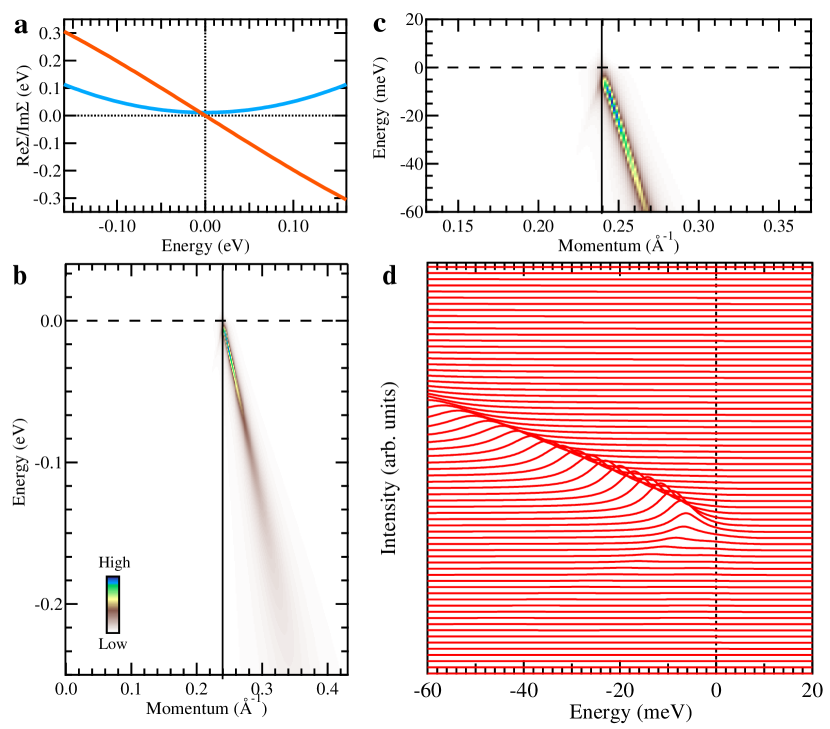
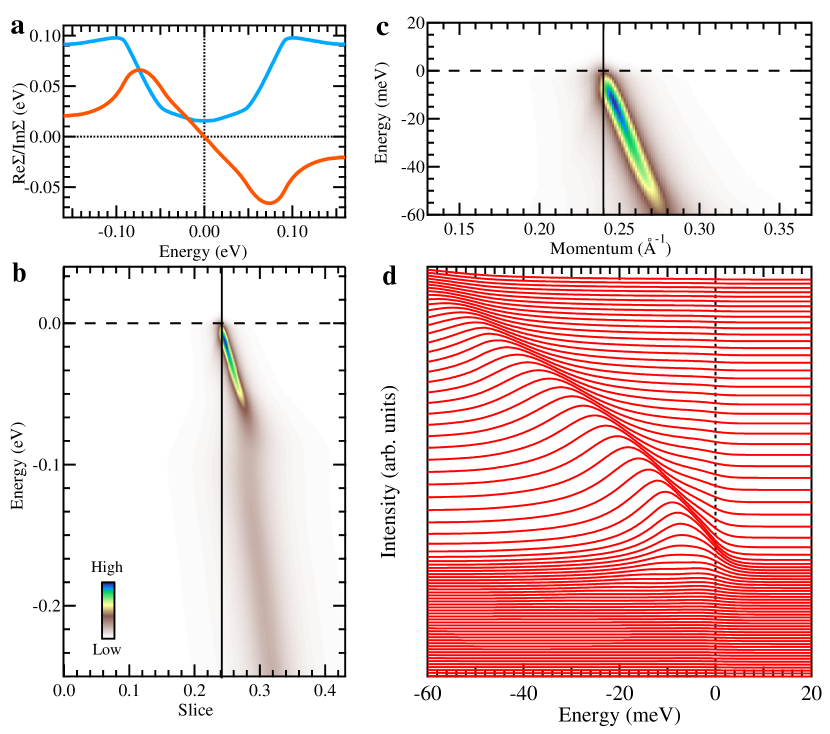
In Fig. S2 we plot the ARPES intensity and dispersion calculated with a 6 meV superconducting gap and self energy of a Fermi liquid (”=a+b). The back bending of the band close to the Ef is clearly observed, which is a characteristic signature of Bogolyubov quasiparticles. In Fig. S3 we plot the band dispersion and EDCs in the presence of a 6 meV superconducting gap for a more realistic model of the self energy (similar to Fig. S1 but with a reduced offset in the imaginary part to better show the features in the proximity of Ef). The Bogolliubov-like dispersion can be still observed even though the peaks remain rather broad close to EF.
II.3 Dispersing vs non-dispersing quasiparticle peaks
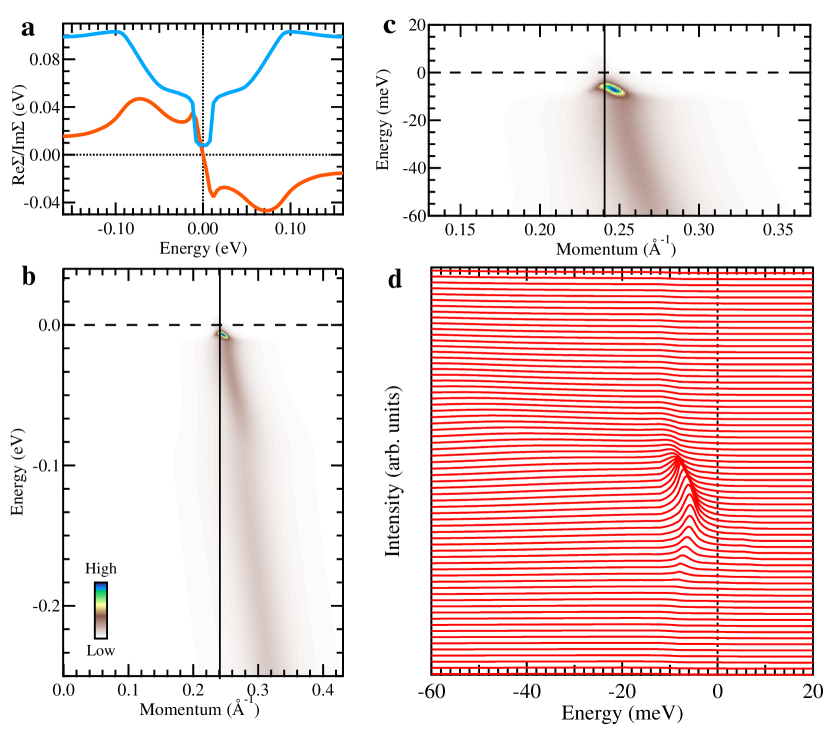
The appearance of a sharp quasiparticle peak in the data upon cooling below Tc (Fig. 3 of the manuscript) signifies a suppression of the scattering rate below a certain energy. We attempt to simulate this in Fig. S4, where we include a 6 meV superconducting gap and a simple suppression of the scattering rate below 10 meV. This results in a rather abrupt sharpening of the quasiparticle peak, but the peaks still display Bogoliubov dispersion, unlike what is observed in the experimental data where the sharp peak at the edge of the gap does not disperse. This lack of the dispersion requires a ”resonant” feature in the scattering i. e. a peak in the imaginary part, in addition to the suppression of scattering. We illustrate this in Fig. S5, which is based on a similar self energy to Fig. S4, but with an additional peak in the imaginary part. This peak causes a more rapid change in the real part of the self energy, which in turn confines the sharp peak to a small energy range and significantly reduces its dispersion. This is of course a grossly exaggerated picture just to demonstrate the effect of peaks in the imaginary part of the self energy on the dispersion of the quasiparticles. A more realistic model is shown in Fig. S6, where we use the normal state self energy (from Fig. S1) that is suppressed below 10 meV and add a small gaussian peak at that energy. The resulting APRES intensity and EDC’s very closely resemble the experimental data of Fig. 3 in main text. The band dispersion reaches an energy of -10 meV, above which only a sharp non-dispersing feature is observed. EDCs show a characteristic sharpening of the line shape with the sharp quasiparticle peak sitting at the superconducting gap energy. This peak is almost non-dispersing, just like in the data of Fig. 3. The line shape close to kF displays a characteristic hump-dip-peak structure, with a dip located close to 10 meV where the imaginary part of self energy changes rapidly.