Resolving the stellar activity of the Mira AB binary with ALMA
Abstract
Aims. We present the size, shape and flux densities at millimeter continuum wavelengths, based on ALMA science verification observations in Band 3 ( GHz) and Band 6 ( GHz), from the binary Mira A ( Ceti) and Mira B.
Methods. The Mira AB system has been observed with ALMA at a spatial resolution of down to mas. The extended atmosphere of Mira A and the wind around Mira B sources are resolved and we derive the size of Mira A and of the ionized region around Mira B. The spectral indices within Band 3 (between 89–100 GHz) and between Band 3 and Band 6 are also derived.
Results. The spectral index of Mira A is found to change from 1.710.05 within Band 3 to between Band 3 and 6. The spectral index of Mira B is 1.30.2 in Band 3, in good agreement with measurements at longer wavelengths. However it rises to between the bands. For the first time the extended atmosphere of a star is resolved at these frequencies and for Mira A the diameter is AU in Band 3 (with brightness temperature K) and AU in Band 6 ( K). Additionally, a bright hotspot AU and with K is found on the stellar disc of Mira A. The size of the ionized region around the accretion disk of Mira B is found to be AU.
Conclusions. The emission around Mira B is consistent with that from a partially ionized wind of gravitationally bound material from Mira A close to the accretion disk of Mira B. The Mira A atmosphere does not fully match predictions, with brightness temperatures in Band 3 significantly higher than expected, potentially due to shock heating. The hotspot is likely due to magnetic activity and could be related to the previously observed X-ray flare of Mira A.
Key Words.:
Stars: Binaries, Stars: atmospheres, Stars: AGB and post-AGB, Stars: Individual: Mira AB1 Introduction
Mira is the closest symbiotic binary star (at 92 pc, van Leeuwen (2007)) consisting of a regularly pulsating, mass-losing Asymptotic Giant Branch (AGB) primary, Mira A ( Cet), and a companion, Mira B (VZ Cet), believed to be a white dwarf. Resolved UV observations of the two components were first published in Karovska et al. (1997) and revealed material flowing from Mira A to Mira B.
A soft X-ray outburst was detected from Mira A in 2003 (Karovska et al., 2005). Since then, the system has been closely monitored at different wavelengths to further understand the cause and effects of the X-ray outburst. The OH maser emission is also varying and the most recently observed OH maser flare occured in 2009 (Etoka et al., 2010). Although the OH flaring can be correlated with variations in the optical lightcurve and the UV line emission occuring on the same time scales, a consistent model explaining the transient phenomena detected by different probes is still missing.
The submm emission from the Mira AB system around the CO(=32) line at 345 GHz was observed with ALMA in Cycle 1 (Ramstedt et al., 2014). The CO maps show that the circumstellar gas has been shaped by several different dynamical processes during the evolution of the star. In the continuum emission centered on 338 GHz, the binary pair is marginally resolved. In this paper, we present new ALMA continuum observations of the system taken as part of the ALMA long-baseline science verification campaign (ALMA partnership, 2015).
2 Observations and analysis
Mira was observed on 17 and 25 October 2014 (Band 3) and 29 October and 1 November 2014 (Band 6). Here we present results from the dual polarization continuum spectral windows. In Band 3, three continuum spectral windows were observed with 128 channels over 2 GHz bandwidth centered on 89.176 GHz, 91.234 GHz and 99.192 GHz. In Band 6, one continuum 2 GHz spectral window with 128 channels was centered at 228.558 GHz. We used the data products provided by the ALMA observatory except that the two epochs for each observing band were treated separately as the sources are strongly detected in each epoch, allowing for the study of structural and flux changes. Self-calibration was performed on the continuum spectral windows that were averaged from 128 to 8 channels across the 2 GHz bandwidth. Flux density calibration was performed using a number of different quasars for the two bands and epochs. The calibrators are listed in Appendix A. Based on the uncertainty of the catalog values due to quasar variability and the flux densities measured for the phase and bandpass calibrators in the different data sets, we conservatively estimate an absolute flux density calibration uncertainty of in both observing bands.
Most of the data analysis was performed directly on the -data in order to avoid image deconvolution artifacts, but images were also created using the CASA task clean with Briggs weighing of the visibilities. This resulted in a beam of mas and a position angle of on October 17 and mas at a position angle of on October 25 for Band 3. For Band 6 both days reached the same resolution of mas with a position angle of on October 29 and on November 1. The rms sensitivity was Jy beam-1 in both epochs of the Band 3 and Jy beam-1 in both epochs of the Band 6 observations. The images in Band 3, with fractional bandwidth coverage, were made using a the multi-frequency synthesis option in clean with two Taylor coefficients to model the frequency dependence. This allowed us to determine the spectral index at the GHz representative frequency.
To analyze the -data directly, we used the UVMULTIFIT code (Martí-Vidal et al., 2014). We find that the observations of October 25 in Band 3 are likely affected by a marginally resolved quasar flux calibrator, producing systematically smaller sizes, and do not consider this epoch in our analysis.
3 Results
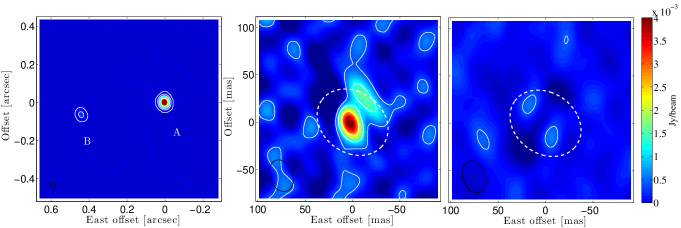
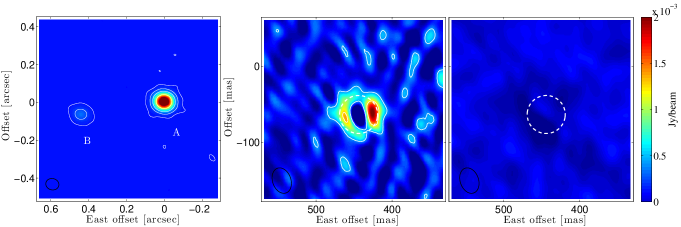
We present a representative image at the two frequencies in Fig. 1 (left, band 6) and Fig. 2 (left, band 3). The relative astrometry of the observations is discussed in Appendix B. In order to determine the size and shape of both Mira A and Mira B, we performed -fitting. For both sources we attempted fits to unresolved delta functions, elliptical and circular Gaussians and elliptical and circular discs. The best fit parameters for Mira A and B at each epoch and observing band are presented in Table 1. As indicated in Fig. 2 (right), the emission from Mira B is clearly extended and the best fits were obtained using a circular Gaussian with a spectral index of . Within the fitted errors and estimated absolute flux density uncertainties, the flux density of Mira B is roughly constant at the two epochs in both bands, although in Band 3 there might be a hint of variability at the level. Between Band 3 and Band 6, the spectral index is , taking into account all flux density uncertainties. Ignoring the observations of October 25, the size is consistent between the different frequencies with a full-width half-maximum (fwhm) of mas, which corresponds to AU.
For Mira A, the best fits to the Band 3 data were produced with an elliptical disc with . The flux density is nearly constant during both days at each observing frequency. The spectral index between Band 3 and Band 6 however, is shallower with . The disc is clearly elongated, with a major axis of mas ( AU), axis ratio of and position angle . However, in Band 6, we found as indicated in Fig. 1, a significant component remaining after subtracting the best fit disc model. This component, consistently at both epochs, could be fit by an additional compact gaussian offset by mas from the disc center. Fitting both disc and gaussian simultaneously signicantly reduced the residuals in the image. The size of the disc is larger at Band 6 compared to Band 3, with an average size of mas (3.99 AU) and an axis ratio of .
| epoch | shape | major axis / fwhm | axis ratio | position angle | spectral index | ||
|---|---|---|---|---|---|---|---|
| [GHz] | [mJy] | [mas] | major/minor | [∘] | |||
| Mira A | |||||||
| 17 Oct 2014 | 94.2 | Disc | 35.030.04 | 41.80.4 | 1.200.01 | 542 | 1.730.09 |
| 25 Oct 2014a | 94.2 | Disc | 34.520.04 | 38.60.4 | 1.280.01 | 541 | 1.700.04 |
| 29 Oct 2014 | 228.67 | Disc | 137.80.2 | 43.280.07 | 1.130.02 | 51.00.5 | … |
| 228.67 | Gaussian | 10.130.07 | 4.60.5 | 1.0 | … | … | |
| 01 Nov 2014 | 228.67 | Disc | 140.00.2 | 43.360.06 | 1.120.02 | 50.80.6 | … |
| 228.67 | Gaussian | 8.980.07 | 4.70.5 | 1.0 | … | … | |
| Mira B | |||||||
| 17 Oct 2014 | 89.06 | Gaussian | 2.500.04 | 242 | 1.0 | … | 1.30.2 |
| 25 Oct 2014a | 89.06 | Gaussian | 2.250.04 | 182 | 1.0 | … | 1.30.3 |
| 29 Oct 2014 | 228.67 | Gaussian | 12.160.09 | 25.70.3 | 1.0 | … | … |
| 01 Nov 2014 | 228.67 | Gaussian | 11.980.09 | 26.20.3 | 1.0 | … | … |
| a The size of both Mira A and B are likely underestimated at the second epoch due to a marginally extended flux calibrator J2258-2758 | |||||||
4 Discussion
4.1 Mira A
4.1.1 Size and shape
Mira A has long been known to have an asymmetric stellar disc (e.g. Karovska et al., 1991; Haniff et al., 1992; Wilson et al., 1992; Quirrenbach et al., 1992). The position angle and axis ratio however, has been shown to be quite variable across the stellar phase. Most observations taken around maximum phase are found to have a position angle of the major axis between . Closer to the phase of the ALMA observations (phase ) the observations of Karovska et al. (1991) (at phase ) find a position angle of . The elongation itself varies with wavelength and phase from none to , consistent with our observations. The wavelength dependence of the elongation is likely due to opacity effects. The apparent variation of position angle with stellar phase could indicate that stable non-radial pulsations shape the extended atmosphere.
The diameter of Mira A also varies with phase by about and was measured to be mas at m wavelength (Woodruff et al., 2004). This corresponds to a Rosseland radius of AU. The radius derived from the major axis we measure at Band 3 would thus corresponds to R∗ while at Band 6 it corresponds to R∗. Previous observations at 43 GHz resolved the radio photosphere of Mira A and derived a uniform disc diameter of mas, corresponding to R∗ Reid & Menten (2007). The fact that the Band 6 observations appear to probe a larger radius than the Band 3 observations likely requires different opacity sources throughout the atmosphere.
4.1.2 Emission process
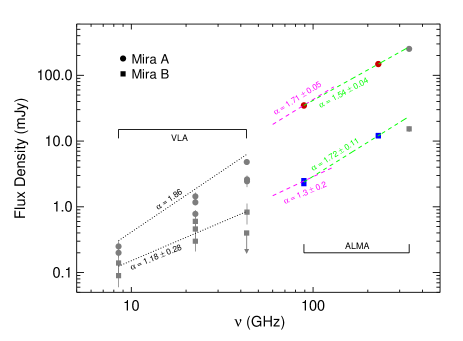
Reid & Menten (1997) analyze different centimeter-wavelength continuum emission processes and conclude that the detected emission at 8.5–22 GHz originates in a radio photosphere reaching unity optical depth at around 2 R⋆, predicting spectral index of =1.86 at centimeter wavelengths. Matthews & Karovska (2006) published resolved images of the Mira system at 8.5–43.3 GHz. The system was monitored with the VLA over 80% of the pulsational cycle and showed flux density variability 30% below 22 GHz. The lower frequency data is consistent with the model from Reid & Menten (1997). At 43 GHz the flux density appears to show larger variability based on the observations by Reid & Menten (2007) who found a flux density almost a factor of two higher than that reported in Matthews & Karovska (2006). The VLA values, the ALMA values from this work and the flux density at 345 GHz (Ramstedt et al., 2014) are presented in Fig. 3. The most striking result is that the spectral index between the ALMA Band 3 and Band 6 observations () appears significantly more shallow than that within Band 3 itself (). The shallower slope agrees with the observations in ALMA Band 7 though the steeper slope would be required to fit the radio observations. Both spectral indexes are not quite in agreement with the model prediction by Reid & Menten (1997), indicating that at millimeter wavelengths the sources of opacity change. Our observations yield significantly higher brightness temperature than expected from the VLA observations. For a uniform disc we find K at Band 3 ( R∗) and K at Band 6 ( R∗), compared to the K at 43 GHz ( R∗). Only part of this difference could be explained by variability and especially the higher temperatures in Band 3 might require shock heating of the atmosphere close to the stellar surface.
4.1.3 Stellar Activity
As shown in Fig.1, the Band 6 data require the presence of a strong compact component with a flux density of mJy offset by mas from the stellar disc center. A gaussian component of mas ( AU) produces a good fit, though cannot rule out a cluster of delta functions. We have thus detected the presence of a significant hotspot, or a compact cluster of spots, on the Mira A stellar disc at mm wavelength. We have investigated if the same spot could be detected in the Band 3 observations at mm. Fits including a gaussian component up to mJy produced equally good results, but the worse angular resolution did not allow us to confidently distinguish between a fit of a stellar disc plus compact component or a stellar disc alone.
The flux density measurements allow us to determine the brightness temperature. With a size of mas, we find K, above the brightness temperature of K measured for the stellar disc in Band 6. The upper limit in Band 3, assuming a 4.7 mas area, gives K. Bright hotspots at millimeter wavelenghts could be caused by shock heating due to pulsations or convection. However, the high brightness temperature of the hotspots at R∗ is more readily explained by magnetic activity as seen on our Sun. Similar magnetic flares were also suggested to be the cause of the soft X-ray outburst observed on Mira A in December 2003 (Karovska et al., 2005) but this is the first direct detection of such magnetic activity of an AGB star in the long wavelength regime. The observed hotspot could be related with the strongly polarized elongated SiO maser ejections that appear aligned with a radial magnetic field (Cotton et al., 2006). Karovska et al. (2005) crudely estimated the lifetime of such magnetic flares to be of order several weeks. We notice a significant difference of almost 15% within 2 days. This would be consistent with the lifetime estimate of a few weeks, but could also indicate significant short term variability.
4.2 Mira B
The accreting companion Mira B has a time-varying accretion-driven wind ( yr km s-1, Wood & Karovska 2006) and recently ALMA showed the impact of this fast and tenuous wind on the much slower and denser outflow ( yr km s-1) of Mira A (Ramstedt et al., 2014). Even if fully ionized, the expected flux density of Mira B’s wind would be at least 4 orders of magnitude smaller than that we observe at 89 and 229 GHz, and would also be optically thin (i.e., ). We therefore rule out any significant contribution from Mira B’s wind at ALMA frequencies. The steep spectral index of Mira B () also rules out any significant non-thermal component, while the symmetric nature of the resolved emission makes it unlikely that the emission is being produced from a collision of the two winds. Our derived diameter for Mira B is AU which is 2 orders of magnitude greater than the size of the accretion disk detected by Reimers & Cassatella (1985) and so we do not directly detect the accretion disk at ALMA frequencies.
Matthews & Karovska (2006) treated the centimeter emission from Mira B to emanate from an ionized cavity in Mira A’s wind, formed by the UV radiation field of the hot accretion disk. They approximated a diameter of AU for Mira B, which is consistent with our findings. However, following Taylor & Seaquist (1984) and assuming a gas temperatures of K, the spectral energy distribution for such an ionized cavity should have turned over to a spectral index of well below our ALMA frequencies. Instead we find that at 89 GHz, which is consistent with the value of Matthews & Karovska (2006) at lower frequencies. The absence of a turnover in the spectral index up to 89 GHz implies that the gas density at the location of Mira B is at the very least an order of magnitude greater than the gas density of Mira A’s wind at that location. It is therefore likely that we are detecting a gravitationally bound partially ionized gas at centimeter and (sub-)millimeter wavelengths and not an ionized cavity of Mira A’s wind. We also find that the spectral index steepens to between 89 and 229 GHz, which could be due to additional dust emission at a few tens of K.
5 Conclusions
With the longest ALMA baselines we have, for the first time, been able to resolve both the extended atmosphere of Mira A and the partially ionized region around Mira B at millimeter wavelengths. The partially ionized region of AU around Mira B requires a density at least an order of magnitude higher than expected from the Mira A wind. This supports the suggestion that the region is made up from gravitationally captured material from the AGB wind that will be accreted on Mira B through its accretion disk. The elongation and wavelength dependent size of Mira A point to strong changes of opacity source throughout the extended envelope and possible non-radial pulsations. The brightness temperature at 3 mm is significantly higher than predicted in the radio photosphere model from Reid & Menten (1997). At 1.3 mm wavelength we also find a hotspot with an area of of the stellar disc. The hotspot has K. This indicates an origin likely connected to magnetic activity and potentially related to the process responsible for the previously observed X-ray outburst and other recorded transient phenomena. The stellar activity could also explain the hot layers of the atmosphere probed by the 3 mm observations.
Acknowledgements.
This paper makes use of the following ALMA data: ADS/JAO.ALMA#2011.0.00014.SV . ALMA is a partnership of ESO (representing its member states), NSF (USA) and NINS (Japan), together with NRC (Canada) and NSC and ASIAA (Taiwan), and KASI (Republic of Korea), in cooperation with the Republic of Chile. The Joint ALMA Observatory is operated by ESO, AUI/NRAO and NAOJ. This research is supported by Marie Curie Career Integration Grant 321691, the Swedish Research Council (VR) and the European Research Council through ERC consolidator grant 614264.References
- ALMA partnership et al. (2015) ALMA partnership, Fomalont, E., Vlahakis, C., et al. 2015, ApJ, submitted
- Cotton et al. (2006) Cotton, W. D., Vlemmings, W., Mennesson, B., et al. 2006, A&A, 456, 339
- Etoka et al. (2010) Etoka, S., Gérard, E., Richards, A., et al. 2010, in 10th European VLBI Network Symposium and EVN Users Meeting: VLBI and the New Generation of Radio Arrays, 6
- Haniff et al. (1992) Haniff, C. A., Ghez, A. M., Gorham, P. W., et al. 1992, AJ, 103, 1662
- Karovska et al. (1997) Karovska, M., Hack, W., Raymond, J., & Guinan, E. 1997, ApJ, 482, L175
- Karovska et al. (1991) Karovska, M., Nisenson, P., Papaliolios, C., & Boyle, R. P. 1991, ApJ, 374, L51
- Karovska et al. (2005) Karovska, M., Schlegel, E., Hack, W., Raymond, J. C., & Wood, B. E. 2005, ApJ, 623, L137
- Martí-Vidal et al. (2014) Martí-Vidal, I., Vlemmings, W. H. T., Muller, S., & Casey, S. 2014, A&A, 563, A136
- Matthews & Karovska (2006) Matthews, L. D. & Karovska, M. 2006, ApJ, 637, L49
- Prieur et al. (2002) Prieur, J. L., Aristidi, E., Lopez, B., et al. 2002, ApJS, 139, 249
- Quirrenbach et al. (1992) Quirrenbach, A., Mozurkewich, D., Armstrong, J. T., et al. 1992, A&A, 259, L19
- Ramstedt et al. (2014) Ramstedt, S., Mohamed, S., Vlemmings, W. H. T., et al. 2014, A&A, 570, L14
- Reid & Menten (1997) Reid, M. J. & Menten, K. M. 1997, ApJ, 476, 327
- Reid & Menten (2007) Reid, M. J. & Menten, K. M. 2007, ApJ, 671, 2068
- Reimers & Cassatella (1985) Reimers, D. & Cassatella, A. 1985, ApJ, 297, 275
- Taylor & Seaquist (1984) Taylor, A. R. & Seaquist, E. R. 1984, ApJ, 286, 263
- van Leeuwen (2007) van Leeuwen, F. 2007, A&A, 474, 653
- Wilson et al. (1992) Wilson, R. W., Baldwin, J. E., Buscher, D. F., & Warner, P. J. 1992, MNRAS, 257, 369
- Wood & Karovska (2006) Wood, B. E. & Karovska, M. 2006, ApJ, 649, 410
- Woodruff et al. (2004) Woodruff, H. C., Eberhardt, M., Driebe, T., et al. 2004, A&A, 421, 703
Appendix A Flux density calibrators
Several quasars were used for flux density calibration at the different epochs and bands. In Table.2 we present the calibrators, and their adopted flux densities and spectral indices from the ALMA calibrator catalog.
| epoch | calibrator | reference freq. | flux density | spectral index |
|---|---|---|---|---|
| [GHz] | [Jy] | |||
| 17 Oct 2014 | J0334-4008 | 86.23 | 1.66 | -0.71 |
| 25 Oct 2014 | J2258-2758 | 86.23 | 1.21 | -0.73 |
| 29 Oct 2014 | J0334-4008 | 229.55 | 0.83 | -0.70 |
| 01 Nov 2014 | J0238+1636 | 229.55 | 1.39 | -0.20 |
Appendix B Relative astrometry
The binary pair Mira AB is fully resolved in the observations, with a representative image at the two frequencies presented in Fig. 1 (left) and Fig. 2 (left). Using -fitting we determine the separation and position angle with milliarcsecond accuracy as indicated in Table 3. The average separation of 0.472″corresponds to AU at a distance of pc. These values fit well with the predictions made by Prieur et al. (2002), although the authors note that their derived binary orbit is still poorly constrained. It is interesting to note that the data already show a (not yet significant) sign of a decrease in separation over two weeks of observing at a rate of as day-1. Futher epochs of observations with ALMA will be thus be able to constrain the binary orbit to high precision.
| epoch | separation | position angle |
|---|---|---|
| [″] | [∘] | |
| 17 Oct 2014 | 0.47220.0005 | 98.790.07 |
| 25 Oct 2014 | 0.47210.0005 | 98.590.06 |
| 29 Oct 2014 | 0.47190.0002 | 98.640.02 |
| 01 Nov 2014 | 0.47090.0001 | 98.530.02 |