First direct determination of the superallowed -decay -value for 14O
Abstract
We report the first direct measurement of the superallowed Fermi -decay -value, the last of the so-called “traditional nine” superallowed Fermi -decays to be measured with Penning trap mass spectrometry. 14O, along with the other low- superallowed -emitter, 10C, is crucial for setting limits on the existence of possible scalar currents. The new ground state value, 5144.364(25) keV, when combined with the energy of the daughter state, keV [Nucl. Phys. A 523, 1 (1991)], provides a new determination of the superallowed -decay value, keV, with an order of magnitude improvement in precision, and a similar improvement to the calculated statistical rate function . This is used to calculate an improved -value of 3073.8(2.8) s.
pacs:
37.10.Ty, 07.75.+h, 23.40.-s, 27.20+nThe study of superallowed Fermi -decays, those occurring between nuclear analogue states with nuclear spin and parity and isospin , provide a powerful tool for testing the foundation of the standard model of the electroweak interaction. An important feature of these decays is that they can provide a test of the conserved-vector-current (CVC) hypothesis and set limits on the existence of scalar currents. Furthermore, the decay energies are employed for the most stringent test of the unitarity of the Cabibbo-Kobayashi-Maskawa (CKM) matrix, by their contribution to the value of , used in investigations of physics beyond the standard model Hardy and Towner (2015).
The CVC hypothesis asserts that the weak vector coupling constant, , is not renormalized in the nuclear medium. As such, the experimental -value for superallowed Fermi -decay should be the same for all such transitions, independent of the nucleus. However, small modifications must be included to account for radiative corrections and the fact that isospin is not an exact symmetry. Hence, the corrected -value should be the same for all superallowed -decays:
| (1) |
where is the transition-independent part of the radiative correction, and are the transition-dependent parts of the radiative correction, and is the isospin-symmetry-breaking correction. The corrected -value can also be expressed in terms of a constant (), , and , the weak vector coupling constant. The value for determined from the -value can, when combined with , the weak-interaction constant determined from purely leptonic muon decays Hardy and Towner (2015), be used to calculate and thus provide a test of the unitarity of the CKM matrix.
The -value is the product of the statistical rate function, , and the partial half-life of the decay, . Three experimental quantities contribute to its determination: the half-life of the parent state and the branching ratio of the -decay, which are used to obtain , and the decay transition energy , which is used to calculate Hardy and Towner (2015). depends on the fifth power of the -value Towner and Hardy (2015), hence, it is essential to have a precise and accurate determination of .
On-line Penning trap mass spectrometry has provided significant contributions to the compilation of data by providing high-precision direct -value measurements Hardy and Towner (2005). Of the “traditional nine” superallowed -decay isotopes, those with stable daughter nuclei, 10C Eronen et al. (2011); Kwiatkowski et al. (2013), 26Alm Eronen et al. (2006); George et al. (2008), 34Cl Eronen et al. (2009), 38Km Eronen et al. (2009), 42Sc Eronen et al. (2006), 46V Savard et al. (2005); Eronen et al. (2006, 2011), 50Mn Eronen et al. (2008) and 54Co Eronen et al. (2008) have all had their -values determined with a Penning trap; only 14O remains to be determined, despite multiple attempts at other facilities.
Low-, superallowed -emitters like 14O are particularly significant for setting limits on the existence of scalar currents. While the CVC hypothesis states that should be the same for all superallowed -decays, if there is a scalar interaction, an additional term approximately inversely proportional to would be present in . As -values are smaller for lower- isotopes, these isotopes would show the largest deviation in from a constant value.
The -value of given in the current compilation of data Hardy and Towner (2015) is determined from a weighted average of threshold energy measurements of the , , and Butler and Bondelid (1961); Bardin et al. (1962); Roush et al. (1970); White and Naylor (1977); Tolich et al. (2003) reactions. This ensemble of data has one of the largest statistical spreads among all transitions, resulting in a reduced- of 4.4. Therefore, the uncertainty has been inflated by a factor of 2.1 to 280 eV in its evaluation Hardy and Towner (2015). Previous comparisons of reaction threshold energy measurements to Penning trap measurements for other isotopes have shown as much as a 6 difference Savard et al. (2005); Eronen et al. (2006, 2008). Hence, a direct measurement of the -value of the 14O superallowed Fermi -decay is necessary.
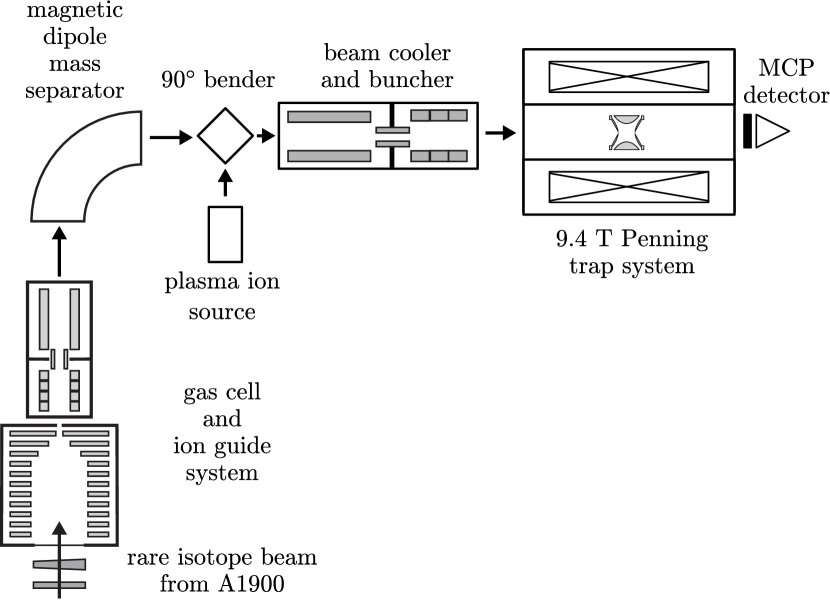
In this Letter, we report on the first direct ground state -decay -value measurement of 14O, carried out at the National Superconducting Cyclotron Laboratory (NSCL) using the 9.4T Penning trap mass spectrometer at the Low-Energy Beam and Ion Trap (LEBIT) facilityRingle et al. (2013). The LEBIT facility is unique among Penning trap mass spectrometry facilities in being able to perform high-precision measurements on rare isotopes produced by projectile fragmentation. A schematic diagram of the gas cell and LEBIT facility is shown in Fig. 1. The radioactive 14O was produced by impinging a 150 MeV/ primary beam of 16O on a 2233 m thick beryllium target at the Coupled Cyclotron Facility at the NSCL. The products were passed through the A1900 fragment separator Morissey et al. (2003), to separate the secondary beam, consisting of fully-stripped , , and ions.
The secondary beam then passed through the momentum compression beamline, where it was decelerated with aluminum degraders at several points before passing through a fused silica wedge. The thickness of the degraders was selected to stop the ; the remainder of the beam then entered the gas cell with an energy of less than 1 MeV/ Cooper et al. (2014). The ions in the gas cell were stopped by collisions with high-purity helium gas at a pressure of about 93 mbar; during this process, the highly-charged ions recombined to their singly-charged state. These ions were transported in the gas cell by a combination of RF and DC fields as well as gas flow. They were then extracted into a radiofrequency quadrupole (RFQ) ion-guide and transported through a magnetic dipole mass separator with a resolving power greater than , which was used to separate from the other contaminants in the beam. A beta detector located after the mass separator was used to confirm the identity of the by measuring the average half-life of the isotope. The measured s is consistent with a recent more-precise measurement for , s Laffoley et al. (2013). Following the mass separator, the ions were transported to the LEBIT facility.
In the LEBIT facility, the ions first entered a cooler-buncher, a two-staged helium-gas-filled RFQ ion trap Schwarz et al. (2003). In the first stage, moderate pressure helium gas was used to cool the ions in a large diameter RFQ ion guide; in the second, the ions were accumulated, cooled, and released to the LEBIT Penning trap in pulses of approximately 100 ns Ringle et al. (2009). To further purify the beam, a fast kicker in the beam line between the cooler-buncher and the Penning trap was used as a time-of-flight mass gate.
The LEBIT 9.4T Penning trap features a high-precision hyperbolic electrode system inside a 9.4T actively-shielded magnet Ringle et al. (2013). Retardation electrodes upstream of the Penning trap were used to decelerate the ion pulses to low energy before entering the trap. The last section of these electrodes are quadrisected radially to form a “Lorentz steerer” Ringle et al. (2007a) that forces the ion to enter the trap off-axis and to perform a magnetron motion with frequency once the trapping potential is applied.
After capture, the trapped ions were purified using dipole cleaning. The ions to be cleaned, and , were identified and then excited using azimuthal RF dipole fields at their reduced cyclotron frequency and driven to a large enough radius that they did not interfere with the measurement. The time-of-flight cyclotron resonance technique (TOF-ICR) Bollen et al. (1990); König et al. (1995) was then used to determine the ions’ cyclotron frequency. In the TOF-ICR technique, the ions are excited with an azimuthal quadrupole RF field with . When , there is a periodic conversion between the initial magnetron motion and reduced cyclotron motion. The conversion process results in a significant change in the ions’ radial energy, which can be detected when ions are ejected from the trap and the radial energy is converted to axial energy that is measured via the time of flight to a microchannel plate (MCP) detector. Maximal change in radial energy, and thus in time of flight, occurs when , so the time-of-flight resonance can be built by measuring multiple bunches of ions and varying around . From a fit of the theoretical line shape to this resonance one can determine the cyclotron frequency , where is the mass, is the charge, and is the magnetic field strength.
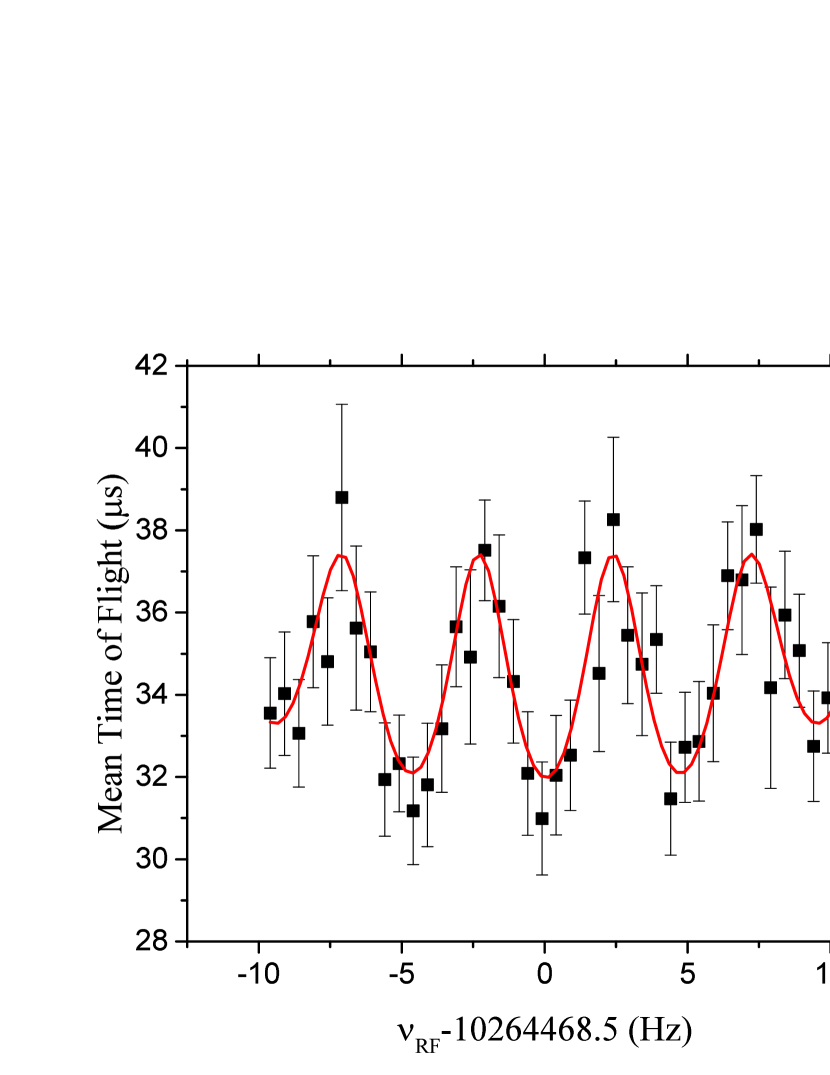
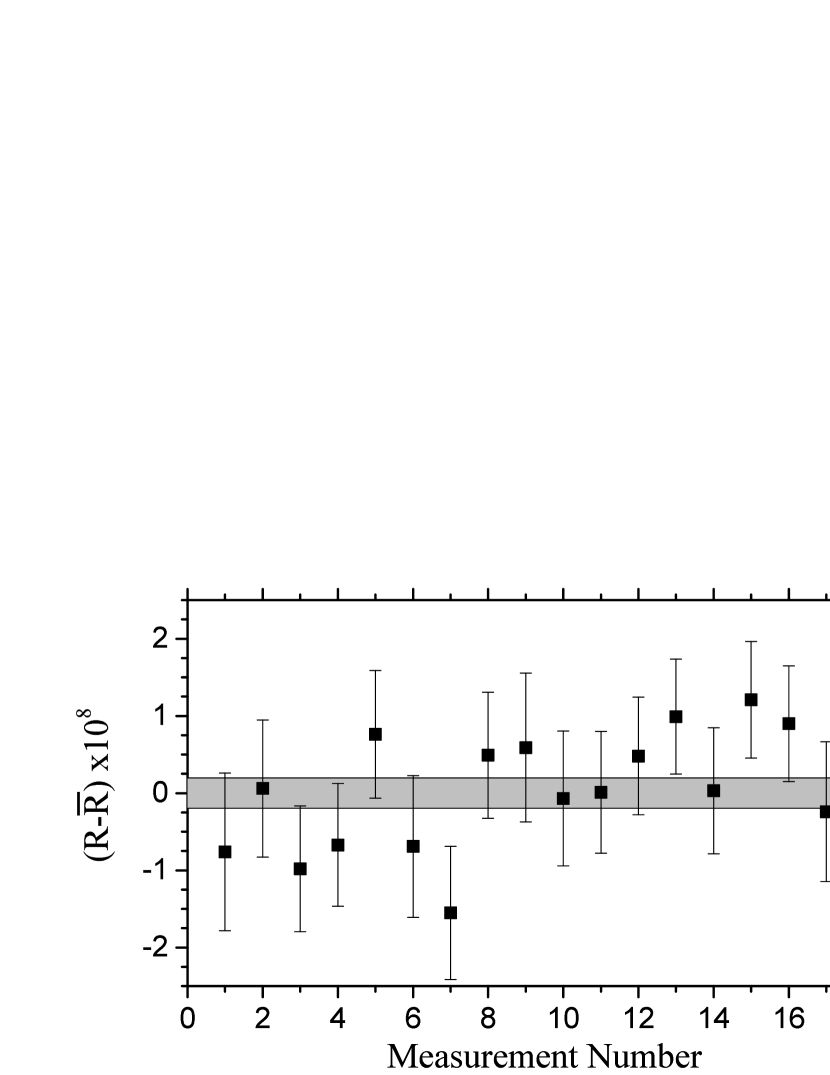
In these measurements, a 250-ms Ramsey excitation scheme Bollen et al. (1992a); George et al. (2007) was used; a 50-ms burst of RF was applied, followed by a 150-ms waiting period, and then a final 50-ms burst of RF. The Ramsey resonances were fitted to the theoretical line shape Kretzschmar (2007), and the cyclotron frequency was thus determined; a sample resonance for can be seen in Fig. 2. Measurements of the reference ion cyclotron frequency were conducted between measurements of the cyclotron frequency. ions were produced in a plasma ion source located upstream of the cooler-buncher (see Fig. 1) and otherwise treated the same as the . The experimental result is the cyclotron frequency ratio , where is the interpolated cyclotron frequency from the measurements bracketing each measurement. A series of eighteen measurements of the cyclotron frequency were taken over a 24-hour period. The weighted average of these measurements is 1.000 394 407 5 (19), where the statistical uncertainty is given; the individual values of relative to the average can be seen in Fig. 3.
Previous work has shown that the effect of nonlinear magnetic field fluctuations on the ratio should be less than per hour, which was our measurement time Ringle et al. (2007b). The presence of isobaric contaminants in the trap during a measurement could lead to a systematic frequency shift Bollen et al. (1992b); this effect was minimized by ensuring no contaminants were present at a level exceeding a few percent and by limiting the total number of ions in the trap. This was done by only analyzing events with five or fewer ions detected; as our measured MCP efficiency is 63%, this corresponds to eight or fewer ions in the trap. As and form an isobaric doublet, most of the systematic effects, such as relativistic shifts in the measured masses due to differences in velocity and additional shifts due to trap field imperfections and special relativity caused by differences in orbital radius in the trap are negligible, as the masses and orbital radii are practically identical. The specific shifts to the ratio due to a possible mismatch in the radii are calculated Brown and Gabrielse (1986) to be less than ,which is negligible compared to the statistical uncertainty. The Birge ratio Birge (1932) for the measurement was 1.02(11), which indicates that the fluctuations are statistical in nature.

The possibility of additional unknown systematic effects was investigated through a measurement of the ratio of a second mass doublet, . This value can also be calculated as using the Ame2012 masses of 14N, 12C, 1H and the electron, the first ionization energies of and nitrogen, and the heat of formation of Wang et al. (2012); Willitsch et al. (2002); NIS ; Kramida et al. (2014). The measured value agrees with the literature value to within , with an uncertainty of , as shown in Fig. 4. Thus, any mass dependent shifts in the present measurement of a doublet at mass 14 would be smaller than the statistical uncertainty in the measurement.
The ground state -value and atomic mass can then be calculated from:
| (2) | ||||
| and: | ||||
| (3) | ||||
respectively, where is the electron mass, and are the first ionization energy of nitrogen and oxygen, respectively, and the Ame2012 mass of is used NIS ; Wang et al. (2012). The resulting ground state -value and mass excess are reported in Table 1, as well as the currently-accepted values. The new ground state -value measurement agrees well with the accepted values, but is an order of magnitude more precise. The new mass excess differs by 3– from the Ame2012 value, which is based on threshold energy measurements of the and reactions Wang et al. (2012).
| Measurement | Value (keV) | Ref. |
|---|---|---|
| (g.s.) | 5144.32(28) | Hardy and Towner (2015) |
| (g.s.) | 5144.364(25) | This work |
| ME(14O) | 8007.457(110) | Wang et al. (2012) |
| ME(14O) | 8007.781(25) | This work |
The -value was calculated using Eq. (1). The values for partial half-life (calculated from the average measured half-life and the branching ratio) and theoretical corrections and were taken from Laffoley et al. (2013); Hardy and Towner (2015). The superallowed -value can then be calculated from , where keVAjzenberg-Selove (1991) is the energy of the daughter state in . The statistical rate function was calculated with and the parametrization presented in Towner and Hardy (2015). Compared with the value published in Hardy and Towner (2015), the uncertainty in is reduced by an order of magnitude. The uncertainty in our calculated -value is also reduced compared to Hardy and Towner (2015). The contribution of the -value to the uncertainty in is now 0.2 s, compared to the 1.7 s in Hardy and Towner (2015). These results are presented in Table 2.
| Calculation | Value | Ref. |
|---|---|---|
| 2831.23(23) keV | Hardy and Towner (2015) | |
| 2831.566(28) keV | This work | |
| 42.771(23) | Hardy and Towner (2015) | |
| 42.8055(28) | This work | |
| 3071.4(3.2) s | Hardy and Towner (2015) | |
| 3073.8(2.8) s | This work |
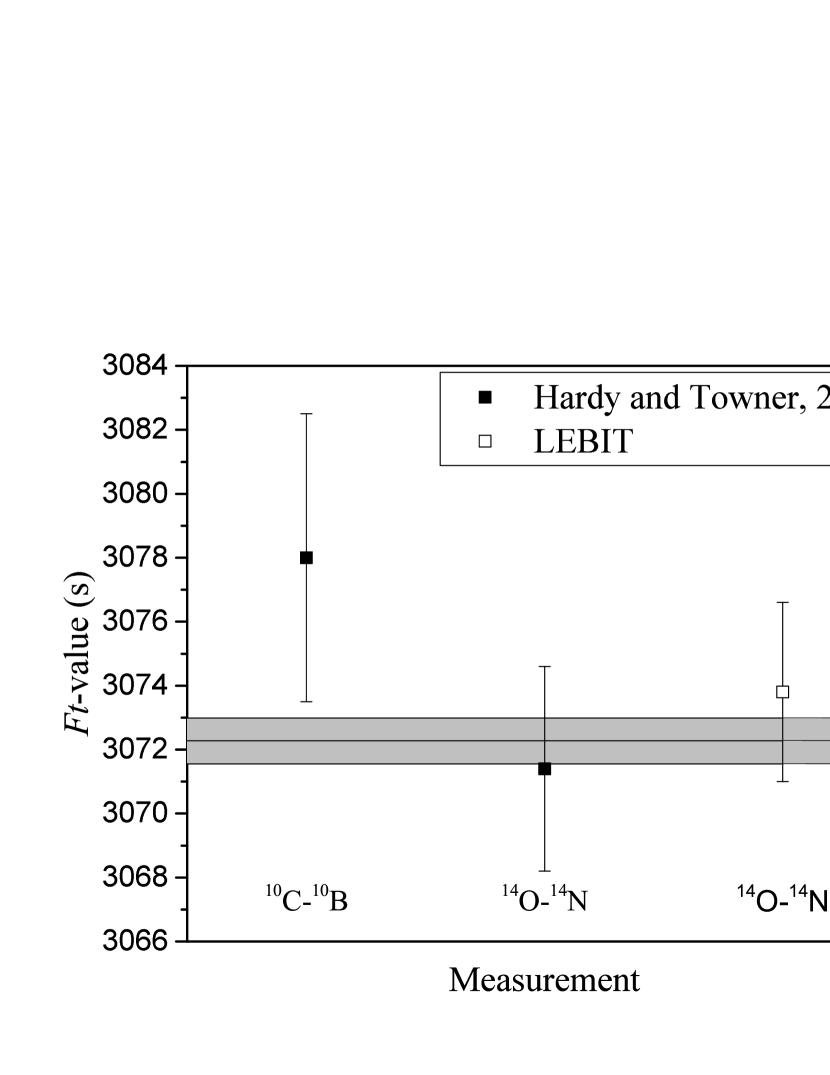
In summary, the first direct determination of the -value of the last remaining of the “traditional nine” superallowed Fermi transitions was carried out to a precision of 25 eV, making it the most precisely-known -value for determining an -value used in testing the CVC hypothesis. The uncertainty in is now dominated by the uncertainty in the experimentally-measured branching ratio, and the theoretical correction . The increase in value results in a slight increase to the -value; while this does not raise it outside the error bars of the average -value for superallowed transitions, the direction of the shift is consistent with the shift in -value observed for 10C after its -value was determined via Penning trap mass spectrometry Eronen et al. (2011); Kwiatkowski et al. (2013), which could indicate the presence of a scalar current Hardy and Towner (2015), as shown in Fig. 5. In order to confirm or refute this, an improved measurement of the branching ratios for both nuclei is needed.
This work was conducted with the support of Michigan State University and the National Science Foundation under Contracts No. PHY-1102511 and PHY-1307233.
References
- Hardy and Towner (2015) J. C. Hardy and I. S. Towner, Phys. Rev. C 91, 025501 (2015).
- Towner and Hardy (2015) I. S. Towner and J. C. Hardy, Phys. Rev. C 91, 015501 (2015).
- Hardy and Towner (2005) J. C. Hardy and I. S. Towner, Phys. Rev. C 71, 055501 (2005).
- Eronen et al. (2011) T. Eronen, D. Gorelov, J. Hakala, J. C. Hardy, A. Jokinen, A. Kankainen, V. S. Kolhinen, I. D. Moore, H. Penttilä, M. Reponen, J. Rissanen, A. Saastamoinen, and J. Äystö, Phys. Rev. C 83, 055501 (2011).
- Kwiatkowski et al. (2013) A. A. Kwiatkowski, A. Chaudhuri, U. Chowdhury, A. T. Gallant, T. D. Macdonald, B. E. Schultz, M. C. Simon, and J. Dilling, Ann. Phys. (Leipzig) 525, 529 (2013).
- Eronen et al. (2006) T. Eronen, V. Elomaa, U. Hager, J. Hakala, A. Jokinen, A. Kankainen, I. Moore, H. Penttilä, S. Rahaman, J. Rissanen, A. Saastamoinen, T. Sonoda, J. Äystö, J. C. Hardy, and V. S. Kolhinen, Phys. Rev. Lett. 97, 232501 (2006).
- George et al. (2008) S. George, G. Audi, B. Blank, K. Blaum, M. Breitenfeldt, U. Hager, F. Herfurth, A. Herlert, A. Kellerbauer, H.-J. Kluge, M. Kretzschmar, D. Lunney, R. Savreux, S. Schwarz, L. Schweikhard, and C. Yazidjian, Europhys. Lett. 82, 50005 (2008).
- Eronen et al. (2009) T. Eronen, V.-V. Elomaa, J. Hakala, J. C. Hardy, A. Jokinen, I. D. Moore, M. Reponen, J. Rissanen, A. Saastamoinen, C. Weber, and J. Äystö, Phys. Rev. Lett. 103, 252501 (2009).
- Savard et al. (2005) G. Savard, F. Buchinger, J. A. Clark, J. E. Crawford, S. Gulick, J. C. Hardy, A. A. Hecht, J. K. P. Lee, A. F. Levand, N. D. Scielzo, H. Sharma, K. S. Sharma, I. Tanihata, A. C. C. Villari, and Y. Wang, Phys. Rev. Lett. 95, 102501 (2005).
- Eronen et al. (2008) T. Eronen, V.-V. Elomaa, U. Hager, J. Hakala, J. C. Hardy, A. Jokinen, A. Kankainen, I. D. Moore, H. Penttilä, S. Rahaman, S. Rinta-Antila, J. Rissanen, A. Saastamoinen, T. Sonoda, C. Weber, and J. Äystö, Phys. Rev. Lett. 100, 132502 (2008).
- Butler and Bondelid (1961) J. W. Butler and R. O. Bondelid, Phys. Rev. 121, 1770 (1961).
- Bardin et al. (1962) R. K. Bardin, C. A. Barnes, W. A. Fowler, and P. A. Seeger, Phys. Rev. 127, 583 (1962).
- Roush et al. (1970) M. Roush, L. West, and J. Marion, Nuclear Physics A 147, 235 (1970).
- White and Naylor (1977) R. White and H. Naylor, Nuclear Physics A 276, 333 (1977).
- Tolich et al. (2003) N. R. Tolich, P. H. Barker, P. D. Harty, and P. A. Amundsen, Phys. Rev. C 67, 035503 (2003).
- Ringle et al. (2013) R. Ringle, G. Bollen, and S. Schwarz, Int. J. Mass Spectrom. 349–350, 87 (2013).
- Morissey et al. (2003) D. J. Morissey, B. M. Sherrill, M. Steiner, A. Stolz, and I. Wiedenhoever, Nucl. Instrum. Methods Phys. Res., Sect. B 204, 90 (2003).
- Cooper et al. (2014) K. Cooper, C. S. Sumithrarachchi, D. J. Morrissey, A. Levand, J. A. Rodriguez, G. Savard, S. Schwarz, and B. Zabransky, Nucl. Instrum. Methods Phys. Res., Sect. A 763, 543 (2014).
- Laffoley et al. (2013) A. T. Laffoley, C. E. Svensson, C. Andreoiu, R. A. E. Austin, G. C. Ball, B. Blank, H. Bouzomita, D. S. Cross, A. Diaz Varela, R. Dunlop, P. Finlay, A. B. Garnsworthy, P. E. Garrett, J. Giovinazzo, G. F. Grinyer, G. Hackman, B. Hadinia, D. S. Jamieson, S. Ketelhut, K. G. Leach, J. R. Leslie, E. Tardiff, J. C. Thomas, and C. Unsworth, Phys. Rev. C 88, 015501 (2013).
- Schwarz et al. (2003) S. Schwarz, G. Bollen, D. Lawton, A. Neudert, R. Ringle, P. Schury, and T. Sun, Nucl. Instrum. Methods Phys. Res., Sect. B 204, 474 (2003).
- Ringle et al. (2009) R. Ringle, G. Bollen, A. Prinke, J. Savory, P. Schury, S. Schwarz, and T. Sun, Nucl. Instrum. Methods Phys. Res., Sect. A 604, 536 (2009).
- Ringle et al. (2007a) R. Ringle, G. Bollen, A. Prinke, J. Savory, P. Schury, S. Schwarz, and T. Sun, Int. J. Mass Spectrom. 263, 38 (2007a).
- Bollen et al. (1990) G. Bollen, R. B. Moore, G. Savard, and H. Stolzenberg, J. Appl. Phys. 68, 4355 (1990).
- König et al. (1995) M. König, G. Bollen, H.-J. Kluge, T. Otto, and J. Szerpo, Int. J. Mass Spectrom. 142, 95 (1995).
- Kretzschmar (2007) M. Kretzschmar, Int. J. Mass Spectrom. 264, 122 (2007).
- Bollen et al. (1992a) G. Bollen, H.-J. Kluge, T. Otto, G. Savard, and H. Stolzenberg, Nucl. Instrum. Methods Phys. Res., Sect. B 70, 490 (1992a).
- George et al. (2007) S. George, K. Blaum, F. Herfurth, A. Herlert, M. Kretzschmar, S. Nagy, S. Schwarz, L. Schweikhard, and C. Yazidjian, Int. J. Mass Spectrom. 264, 110 (2007).
- Ringle et al. (2007b) R. Ringle, T. Sun, G. Bollen, D. Davies, M. Facina, J. Huikari, E. Kwan, D. J. Morrissey, A. Prinke, J. Savory, P. Schury, S. Schwarz, and C. S. Sumithrarachchi, Phys. Rev. C 75, 055503 (2007b).
- Bollen et al. (1992b) G. Bollen, H.-J. Kluge, M. König, T. Otto, G. Savard, H. Stolzenberg, R. B. Moore, G. Rouleau, G. Audi, and I. Collaboration, Phys. Rev. C.. 46, R2140 (1992b).
- Brown and Gabrielse (1986) L. S. Brown and G. Gabrielse, Rev. Mod. Phys. 58, 233 (1986).
- Birge (1932) R. T. Birge, Phys. Rev. 40, 207 (1932).
- Wang et al. (2012) M. Wang, G. Audi, A. H. Wapstra, F. G. Kondev, M. MacCormick, X. Xu, and B. Pfeiffer, Chin. Phys. C 36, 1603 (2012).
- Willitsch et al. (2002) S. Willitsch, L. L. Imbach, and F. Merkt, The Journal of Chemical Physics 117, 1939 (2002).
- (34) NIST Chemistry webbook; NIST standard reference database No. 69 [Online]. Available http://webbook.nist.gov [2015, March 6]. National Institute of Standards and Technology, Gaithersburg, MD.
- Kramida et al. (2014) A. Kramida, Yu. Ralchenko, J. Reader, and the NIST ASD Team, NIST Atomic Spectra Database (ver. 5.2), [Online]. Available: http://physics.nist.gov/asd [2015, March 6]. National Institute of Standards and Technology, Gaithersburg, MD. (2014).
- Ajzenberg-Selove (1991) F. Ajzenberg-Selove, Nucl. Phys. A 523, 1 (1991).