Maximum information photoelectron metrology
Abstract
Photoelectron interferograms, manifested in photoelectron angular distributions (PADs), are a high-information, coherent observable. In order to obtain the maximum information from angle-resolved photoionization experiments it is desirable to record the full, 3D, photoelectron momentum distribution. Here we apply tomographic reconstruction techniques to obtain such 3D distributions from multiphoton ionization of potassium atoms, and fully analyse the energy and angular content of the 3D data. The PADs obtained as a function of energy indicate good agreement with previous 2D data and detailed analysis [Hockett et. al., Phys. Rev. Lett. 112, 223001 (2014)] over the main spectral features, but also indicate unexpected symmetry-breaking in certain regions of momentum space, thus revealing additional continuum interferences which cannot otherwise be observed. These observations reflect the presence of additional ionization pathways and, most generally, illustrate the power of maximum information measurements of coherent observables for quantum metrology of complex systems.
I Introduction
Interferometric measurements are the gold-standard in metrology, since they offer observables of high precision and information-content, which can be used to glean detailed understanding of underlying physical processes. In particular, interference patterns can be used to obtain the relative phase(s) of contributing waves, quantities which provide key physical insights in general, and in particular provide a window into underlying quantum mechanical phenomena. One specific and well-known example is the wave nature of a free electron, as verified by Young’s double-slit type experiments. In such experiments, a particle described by a plane-wave impinges on two slits in an otherwise opaque barrier, resulting in a more complex wave pattern described by two transmitted spherical wavefronts. These wavefronts interfere with each other, leading to a characteristic interference pattern. In this case, the relative phase of the spherical wavefronts depends on the distance from the slits, and this geometric phase manifests as a spatial dependence of the observed interferogram.
The process of atomic or molecular photoionization is conceptually similar, and has long been discussed in terms of interfering wavefronts Cohen1966 ; Cooper1968 , but is in general significantly more complex. An illustrative example is the photoionization of H2, the “simplest double slit” Akoury2007 . In this case, following single-photon absorption, the photoelectron wavefunction can be considered as a superposition of two indistinguishable spherical waves, launched from the two atomic sites upon photoabsorption. The observable photoelectron flux, determined by the coherent square of the continuum wavefunction, exhibits a characteristic angular interference pattern in very close analogy with Young’s double-slit Cohen1966 ; Akoury2007 . Another illustrative example is Young’s double slit in the time-domain, which has been demonstrated by atomic ionization via a coherent two pulse laser sequence, resulting in an interference pattern in the photoelectron energy distribution Wollenhaupt2002 ; Wollenhaupt2013 . In this case the temporal evolution of the interferogram responds to the relative phase of the laser pulses, which can be controlled via their temporal separation, and is ultimately transferred to the photoelectron wavefunction.
For more complex light-matter systems the continuum wavefunction is described by a superposition of many constituent partial-waves of differing character, correlated with the various ionization pathways accessed, and the simple analogy with Young’s double-slit fails. Despite this complexity, the resulting photoelectron flux, measured spatially, remains, in essence, a self-referencing angular interferogram of the continuum wavefunction. In this light, measurements of the energy and angle-resolved photoelectron flux, i.e. the 3D photoelectron momentum distribution, are particularly powerful, since they provide a phase-sensitive metrology of the continuum wavefunction and the scattering event (photoionization) which gave rise to this wave. For example, photoelectron interferograms have been used to obtain complete information on the scattering wavefunction for both atoms and molecules Duncanson1976 ; Leahy1991 ; Becker1998 ; Reid2003 ; Gesner2002 ; to investigate electron correlation and entanglement in multiple ionization Akoury2007 ; Schoffler2011 ; and in the related context of photoelectron diffraction Meckel2008 and photoelectron holography Huismans2011 ; Meckel2014 , wherein intense laser fields are used to drive re-scattering of continuum waves from the photoion and, in the case of holography, additional interferences between direct (reference) and the re-scattered continuum waves are observed. Furthermore, in time-dependent cases, the continuum wavefunction will respond to the underlying dynamics of the ionizing system, for instance evolving electronic or nuclear configurations Assion1996 ; Arasaki1999 ; Wollenhaupt2003 ; Hockett2011 ; Wang2014 , which may in turn depend on the properties of the laser pulse(s) applied and even allow for control Wollenhaupt2009a ; Hockett2014 . It is also of note that the scattering phase accumulated by the partial-waves is correlated, in the time-domain, with the relative ionization time-delay, often termed the Wigner delay Wigner1955 ; DeCarvalho2002 . In short, photoelectron interferograms are remarkably versatile and rich, with many existing and potential applications.
The last decade has seen a surge in “users” of photoelectron interferograms, and as many types of experimental study Reid2012 . While this popularity is in part due to the versatility of the measurement, it is largely due to the proliferation of photoelectron imaging techniques. In particular velocity-map imaging (VMI), since a basic VMI apparatus offers a robust and simple experimental configuration for measuring photoelectrons. However, in the majority of cases the use of standard VMI methodologies means that measurements are restricted to 2D projections of the full 3D momentum distribution Parker1997 ; Parker1997a ; Whitaker2003 . Although 2D projections of any arbitrary 3D distribution may be measured and interpreted phenomenologically, the resulting loss of dimensionality means that only cylindrically-symmetric distributions can be quantitatively analysed Whitaker2003 ; Garcia2004 . This further limits the information extractable from the 2D data and, more fundamentally, the type of experimental studies possible. While it is trivial to state that 3D measurements offer a higher information content than 2D measurements, the restrictions inherent to 2D measurements are highly detrimental to the understanding of the photoelectron interference pattern, and the concomitant ability to use subtle changes in this pattern as a probe of the underlying quantum mechanics. This statement becomes more applicable as the complexity of the light-matter interaction grows, and the number of interfering pathways increases; for instance ionization with polarization-shaped laser pulses, where highly-structured, non-cylindrically symmetric, photoelectron distributions are the norm Wollenhaupt2009a ; Hockett2014 .
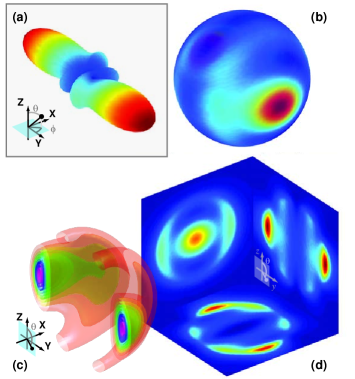
Figure 1 illustrates some of these concepts in photoelectron interferometry and imaging, with an example angular interferogram , representations in velocity space for (b) narrow and (c) broad energy distributions, and (d) 2D projections of (c) onto various image planes. The details of these calculations are discussed further below, but we note here that in this particular case only the 2D projection in the plane reveals the non-cylindrically symmetric nature of the distribution, and this key information is lost in the other projections. While the precise details of the information loss depend on the initial distribution, and the geometry of the measurement, this result is applicable to all cases in which the symmetry is broken in the plane of polarization, e.g. ionization with elliptically polarized or polarization-shaped laser pulses. Because this plane is orthogonal to the beam propagation direction it would not be possible to measure in a standard VMI configuration.
In recent work, refs. Hockett2014 ; Hockett2015a , we explored a relatively complex ionization process: a net 3-photon ionization of potassium atoms using moderately intense 800 nm light and a range of polarizations from linear to circular, and fully polarization-shaped pulses. We made use of measurements of 2D photoelectron momentum distributions, combined with the calculation of 2D photoelectron interferograms (including intra-pulse electronic dynamics, driven by the instantaneous pulse polarization) and a fitting procedure, in order to determine the full set of contributing partial-wave magnitudes and phases. Perhaps surprisingly, this analysis allowed for “complete” details of the photoionization event in terms of the contributing pathways to this particular photoelectron interferometer, despite the restrictions of the 2D data, but it was concluded that application to more complex cases would likely require the additional level of detail available from 3D data; in this work we explore the capabilities gained from measurement of full 3D photoelectron distributions created by the same ionization scheme. Measurements are made using a standard 2D VMI set-up, and combined with tomographic reconstruction to provide full 3D metrology. With the 3D measurements we are additionally able to (a) observe non-cylindrically symmetric distributions directly (sec. III.1) 111We note for completeness that there are other methods of obtaining 3D distributions, such as direct 3D imaging-type methods which combine spatial and time-of-flight measurements. Typically such measurements are more challenging for various reasons, although they are now routine for a few experimental groups and may offer additional measurement capabilities such as full photoion-photoelectron vector correlations depending on the experimental configuration, see for instance refs. Continetti2001 ; Reid2012 ; Hockett2013 and references therein. Non-imaging techniques, based on serial point-by-point measurements, have been in use for decades but are severely limited by the long collection times required to obtain high resolution 3D datasets, and may be further limited by the available energy (time-of-flight) resolution. Some further aspects of 1D, 2D and 3D measurement techniques, including resolution considerations, are discussed in ref. Chichinin2009 . In general we note that 2D imaging combined with tomographic reconstruction offers a significant reduction in measurement time as compared to direct 3D imaging techniques, and a simpler experimental set-up.; (b) quantitatively analyse these distributions as a function of energy (sec. III.3) and, consequently, (c) compare these results directly with calculations based on the previously determined photoionization dynamics (sec. III.4); (d) investigate novel symmetry-breaking which was obscured in the 2D measurements, but is clear in the 3D distributions, and directly reflects additional ionization pathways contributing to the photoelectron interferogram (sec. IV). All of these aspects serve to highlight the power of full 3D photoelectron interferograms and provide a general maximum information methodology for analysis of these measurements, as demonstrated by the new insights obtained into this complex light-matter interaction.
II Photoelectron metrology
In this work ionization of potassium atoms with a single 30 fs IR laser pulse was investigated. This provides the specific light-matter system we use to illustrate the concepts of maximum information photoelectron metrology. As noted above, interaction of moderately intense ( Wcm-2) light near 800 nm results in a net 3-photon ionization process. More specifically, the process can be considered in terms of a strongly-coupled, bound-bound transition at the 1-photon level, followed by a much weaker, 2-photon ionizing transition , where the continuum states are labelled by photoelectron energy and (orbital) angular momentum with projection on the -axis. Because the bound-bound transition is near resonant at 800 nm, and carries significant oscillator strength, Rabi oscillations are driven; these intra-pulse electronic population dynamics play a significant role in the final photoelectron interferogram. Furthermore, since the polarization of the laser pulse affects both the population dynamics and the ionization dynamics, the final continuum state populated is sensitive to the pulse polarization. In effect, the polarization of the light controls the photoionization interferometer, and finer control can be gained via the use of polarization shaped pulses, which have a polarization state that evolves over the pulse envelope. This process serves to represent a typical, complex, light-matter interaction in the sense discussed above: many partial-waves contribute to the final continuum state; electronic dynamics play a significant role; the interaction is sensitive to controllable experimental parameters, as well as the inherent physical properties of the ionizing system. As described above, in this work we are concerned with the additional insight available from 3D measurements, so the reader is referred to papers 1 & 2 for full details of the ionization process, including the ionization pathways, angular momentum coupling diagrams and the full theoretical treatment.
In order to develop a maximum information methodology for photoelectron interferograms we make use of three key elements: (1) sets of 2D VMI measurements, (2) tomographic reconstruction techniques, (3) detailed analysis of the radial and angular content of the resulting 3D data, with a particular focus on the angular photoelectron flux. Each of these aspects is detailed below, and the data presented in section III.
II.1 Experimental set-up
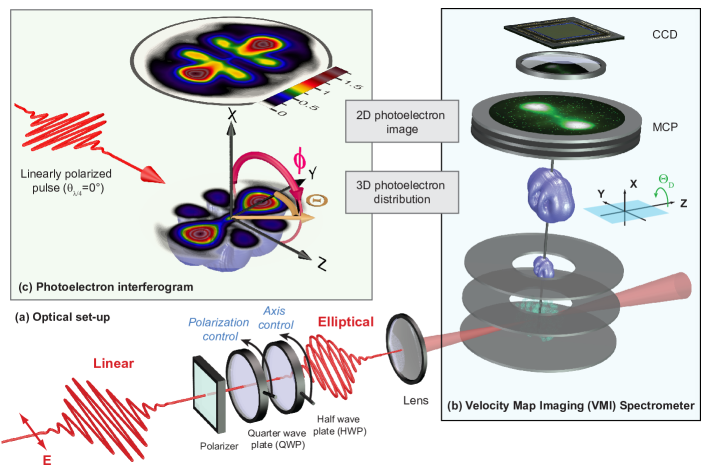
The experimental set-up is illustrated in figure 2. Herein we describe the salient details, and the reader is referred to refs. Wollenhaupt2009a and Lux2015 for a more detailed description. In brief, femtosecond laser pulses of pulse duration (full width at half maximum (FWHM) of the intensity profile) centered at with a pulse energy of are provided by an amplified Ti:sapphire laser system (Femtolasers Femtopower Pro). The laser beam is focussed with a lens of 200 mm focal length into potassium vapor supplied by an alkali metal dispenser source. A mean focal spot size radius of about ( of intensity profile) was obtained and measured with a beam profiling CCD camera. At a pulse energy of this leads to a peak intensity of about Wcm-2 assuming Gaussian profiles in time and space.
We use a home-built velocity map imaging (VMI) spectrometer Parker1997 to record 2D photoelectron images, illustrated in figure 2. The imaging assembly consists of a chevron micro-channel plate (MCP) detector with a phosphor screen deposited on a fiber optic (SI-Instruments GmbH model S3075-10-I60-PS-FM). A CCD-camera with 1.4 million pixels (Lumenera Corporation model Lw165m) is used to image the signals on the phosphor screen. The energy resolution of the VMI spectrometer in the present measurements is better than (FWHM) at an energy of about .
The polarization of the initial laser pulses is linear with the polarization axis perpendicular to the spectrometer axis and coplanar to the detector surface, as shown in figure 2. We use a dichroitic VIS-IR-polarizer (CODIXX) to clean up the linear polarization. An achromatic quarter-wave plate (QWP) (B. Halle Nachfl.) is placed after this polarizer to generate different polarization states with an adjustable amount of circularity. The polarization states are therefore defined by the QWP rotation angle , where corresponds to linearly polarized light, to circularly polarized light, and all values in between to elliptically polarized pulses. The ellipticities of the laser pulses are defined as the ratio of the minor to major axes of the polarization ellipse, hence for linearly polarized light and for pure circularly polarized light. Herein we present data for three polarization states defined by (linear polarization), and (elliptically polarized states). The corresponding Stokes vectors, denoted , and ellipticities , are given in table 1, where the Stokes parameters were measured experimentally using the method of ref. Schaefer2007 (further details can be found in ref. Lux2015 ). In this work only the ellipticities are of fundamental importance, and hereafter the three polarization states are denoted , and respectively. Although the Stokes parameters indicate a slight rotation of the polarization ellipse as a function of (relative to the lab. frame -axis defined in figure 3), this rotation does not affect the photoelectron distributions beyond a trivial frame rotation, and was removed during data processing (although is present in the raw data shown in figure 3).
| Label | QWP | Stokes | Ellipticity |
|---|---|---|---|
| 0∘ | (1, 1.00, 0.04, 0.00) | 0 | |
| 15∘ | (1, 0.76, 0.43, 0.49) | 0.27 | |
| 30∘ | (1, 0.28, 0.39, 0.88) | 0.58 |
To record different 2D projections of the photoelectron distribution, an achromatic half-wave plate (HWP) (B. Halle Nachfl.) is utilized after the QWP. This HWP provides control over the polarization axes of the incoming light, hence the rotation of the 3D photoelectron distribution relative to the detector plane. This rotation angle is defined as , where for the case shown in figure 2, with the plane parallel to the detector plane, and for the case where the plane is parallel to the detector (see also figure 3). Photoelectron images are measured for a range of , and this series of projections is used to reconstruct the initial 3D distribution for each polarization state , as detailed in sec. II.2. For each images are integrated for approx. laser pulses; under the conditions described above approx. electrons are measured per pulse, resulting in a total electron count of approx. per 2D projection. Overall, each tomographic measurement includes approx. laser pulses and approx. electrons, and takes around 50 minutes. Due to the large number of electron counts in each measurement, statistical (Poissonian) uncertainties are negligible in this data, and are consequently not shown on the plots presented herein.
II.2 Tomographic reconstruction
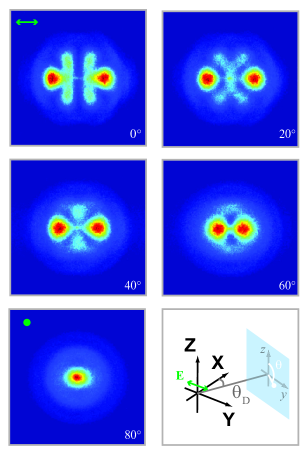
For each polarization state, photoelectron images were recorded for a set of projection angles , as described above. As illustrated in figure 1(c) & (d), each image is a 2D projection of the original 3D velocity space, , where the lower-case coordinates are defined in the detector plane and the upper-case coordinates in the ionization frame, where the -axis is chosen to coincide with the laser propagation axis. Raw experimental images are shown in figure 3 for a few values of . In this case, as distinct from the example shown in figure 1, the ionizing light was linear, and the full 3D distribution is cylindrically-symmetric. Here the symmetry is clear for the case, which shows a distribution with two intense poles aligned with the -axis, and band structure of lower intensity. As this distribution is rotated the poles, in 2D projection, appear to come closer to one another, and ultimately align for . The band structure initially becomes more complex in projection, and at appears as a weak, radially dependent feature dropping off from the central spot. (The reconstructed 3D distribution from this data is shown in figure 4.)
In the tomographic reconstruction procedure the images were stacked to form a data cube of dimensions , and an inverse Radon transform performed on each plane in the image stack to recreate the original space. This procedure is equivalent to those detailed in refs. Wollenhaupt2009 ; Smeenk2009 ; Hockett2010 , although the numerical details are slightly different. In this case, the reconstruction was performed in Matlab (R2010a), using the built-in iRadon function. The input images were cropped and down-sampled by a factor of two before reconstruction, yielding raw velocity space images of 251x251 pixels, and the inverse Radon transform included a Ram-Lak frequency filter with Hann windowing to remove high-frequency noise. Sets of images for to 90∘, in 2∘ steps, were used, resulting in image sets of 45 projections for each polarization state. Combined with the down-sampling, this resulted in a data cube of dimension 251x251x45, and a reconstructed velocity space volume of dimension 251x251x251 voxels.
II.3 Information content of 3D data
In the following we determine and discuss the details of the radial and angular components obtained from the 3D momentum data. Most generally the distributions, in spherical polar coordinates, can be described by:
| (1) |
Here the are spherical harmonic functions and the are the anisotropy parameters, explicitly given as a function of energy. The experimental volumetric data can be expressed in terms of this characteristic expansion by defining a coordinate origin, converting the Cartesian volume to a spherical-polar coordinate system , then extracting radial slices and, finally, determining the by fitting the radial slices with eqn. 1. Note that since the raw radial spectrum recorded via a VMI experiment is linear in velocity space, it is non-linear in energy space (because ). For simplicity of data analysis we therefore work primarily in this linear space, defined in practice by CCD pixels and labelled by the arbitrary radial coordinate , but use the notation in all cases. The thus determined constitute the full information content of the measurement, and fully characterize distributions such as the one shown in figure 1(c).
The radial spectrum, summed over all angles, corresponds to the photoelectron velocity (or energy) spectrum. This component is given by the parameters, or equivalently can be obtained by direct angular integration of the data:
| (2) |
The angular photoelectron interferograms at any given , hence the set of at any given , depend on the composition of the continuum wavefunction, defined by the partial-waves . Although the nature of the interferences and coupling is complicated (see papers 1 & 2), in general the limits on and in this expansion depend directly on the continuum states populated, which depend in turn on both the characteristics of the ionizing radiation and the intrinsic properties of the ionizing system. These properties effectively determine the ionization pathways accessible, via the symmetry of the problem and coupling to the partial-waves Yang1948 ; Reid2003 ; Reid2012 ; for example, and, in the case of linearly polarized light, only terms are allowed. The resulting interference pattern, at a single energy, is often termed the photoelectron angular distribution (PAD), as distinct from the radial component which reflects the photoelectron energy spectrum. It is important to note that the parameters cannot be determined from 2D images in general, due to the loss of information which occurs with projection of the full distribution on a 2D plane.
The exception to this is cylindrically symmetric (-invariant) distributions, for which Abel-type inversion techniques can be employed Whitaker2003 . Since cylindrical symmetry is only maintained for linear or pure circularly polarized light (0 or 1), this stipulation corresponds in practice to a restriction on the experiments possible and, ultimately, on the partial-wave interferences which can be observed Leahy1992 ; Reid2003 . This latter consideration provides a fundamental limit to the information content which can be quantitatively obtained from a 2D measurement.
III Results & analysis
III.1 3D photoelectron momentum images
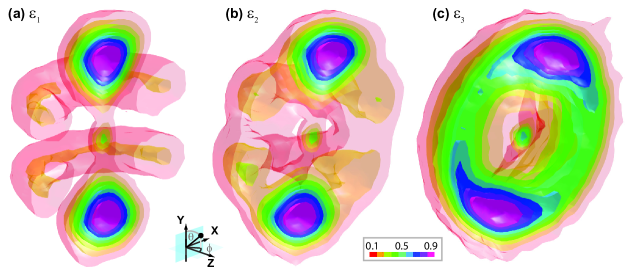
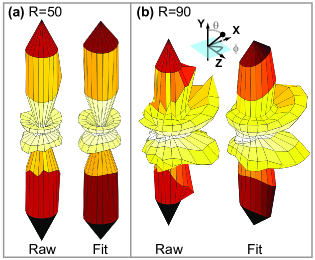
The images obtained experimentally are shown in figure 4. In the figure we show 3D iso-surface renderings of the tomographically reconstructed distributions, equivalent to the computational result shown in figure 1(c). The distributions are sliced in the plane to reveal details of the radial (velocity) spectrum, and highlight the angular structure of the signal in the polarization plane. The radial component of the images shows two features: a central spot, and a main radial feature which appears to have a Gaussian-like envelope. The angular component shows little clear structure for the central spot, and a complex multi-lobed structure over the main radial feature.
Broadly, the results over the main feature show the expected behaviour as the polarization state of the light is changed, evolving from a distribution with primarily structure (or -like structure in the language of atomic orbitals 222For clarity it is important to note here that while the observed angular structure may be conveniently labelled with such terms - -like, -like etc. - the terminology is used in this context only to apply to the observable angular interferogram, and does not imply any knowledge about the contributing continuum wavefunction.) in fig. 4(a), to a more ring-like structure in fig. 4(c). This general evolution with the laser polarization matches that seen in the 2D photoelectron images recorded at lower laser intensities, and predicted theoretically (see papers 1 & 2). There is little apparent change in the radial distribution with polarization, also as expected, although more careful analysis (see below) indicates this is not entirely true. The central spot was not observed in the previous 2D images, although such a feature is quite typical of VMI measurements and is usually assumed to indicate photoelectrons generated via many possible pathways to low-eKE continuum states (e.g. field ionization of high-lying excited states). Such pathways may be laser intensity and VMI parameter dependent, and have been exploited in “photoionization microscopy” studies Nicole2000 ; Lepine2004a , and more recently investigated in the context of strong-field atomic and molecular ionization Wolter2014 ; Dimitrovski2014 . In the former case, near threshold ionization is analysed in a joint atom-electric field potential, leading to the formation of complex quasi-bound states; in the latter case, low and zero-energy photoelectrons are associated with electron tunnelling, followed by scattering and Coulomb focussing or recapture into high-lying Rydberg states, with subsequent field ionization of these states. Effectively, the same processes operate in both regimes, but the precise details vary with the strength of the laser field and the applied static fields. We do not consider these low-energy contributions further in this work.
In detail, the full 3D data begins to reveal additional information which can be inferred, but not observed directly, in 2D projections. As noted above, this is particularly true for any structure in the plane - the plane of polarization of the laser pulse - which cannot be observed in a 2D image in standard VMI configurations (see figures 1 and 3). For the linearly polarized light the distribution is cylindrically symmetric so, as described above, there is nominally no loss of information in the 2D projections. This case does, however, serve as a good test of the tomographic reconstruction and an intuitive example, since the distribution is relatively simple and can be readily checked by eye against the 2D images. It is clear how the -like structure, with intense polar lobes and two radial bands, can form the various projections shown in figure 3.
For the elliptically polarized cases the distributions are more interesting; of particular note is the rotation in the plane, which appears in the 2D images as a smearing of the features in the equatorial plane. In this case the rotation is somewhat trivial in origin, and simply due to the optical set-up (as detailed in section II.1) which results in a slight reference frame rotation for the elliptically polarized cases relative to the linear case. In the 3D data this effect can be clearly observed, understood, and removed in data analysis. However, it is clear that in a 2D measurement this kind of overlap or blurring will be present in any case where features overlap in projection, regardless of the experimental or physical origin of this overlap. This general effect was illustrated in detail above for the linear case (figure 3), where the effects of frame rotations on 2D projections are observed as the approach and overlap of the polar features as is increased. Obviously the magnitude of this effect, and the loss of detailed structure in the projections, will depend on the complexity and, especially, the width of the features. Similarly, the loss of structure away from the plane can be inferred from a 2D projection as a narrowing of the observed distribution, but in the 3D case the persistence of the lobe pattern in plane can be observed. In all cases, the potential for the conflation of (trivial) experimental with physically interesting effects is high, and detrimental to detailed analysis and fundamental insight.
Although visually arresting and phenomenologically useful, direct consideration of the iso-surface plots provides only a cursory overview of the data, and does not clearly reveal minor contributions to the photoelectron interferograms. In the following sections, a more careful quantitative analysis of this data is reported in order to provide more detail, and ultimately provide physical insight into these 3D interferograms.333A similar analysis of 3D photoelectron interferograms from a time-resolved case can be found in ref. Hockett2013 , along with a more detailed discussion of the dimensionality of the observables.
III.2 Radial spectra
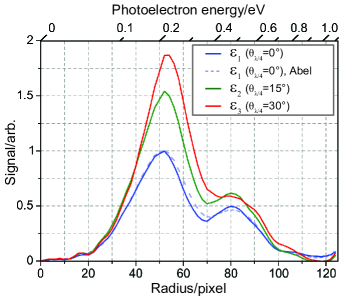
The radial spectra extracted from the volumetric data are shown in figure 5. As expected from the full 3D plots of fig. 4, there is little difference in the overall structure of the distributions with polarization state. However, there is a clear double-peak, with a splitting of 270 meV. The ratio of the peaks forming this doublet varies as a function of polarization, with a slight dominance of the lower-energy feature observed for which evolves smoothly with ellipticity to a more significant dominance at . This trend is not obvious from fig. 4, nor was it observed in previous 2D images.
The double-peaked structure of the spectrum is due to the Autler-Townes (AT) effect, and has been studied in detail in previous work Wollenhaupt2003b ; Wollenhaupt2005 ; Wollenhaupt2009a . The dependence of this structure on polarization has not been systematically explored before; however, since the splitting depends on the time-dependent Rabi frequency, given by the dipole operator times the (complex) laser electric field, one might expect it to respond to pulse polarization due to the dependence of the AT features on the details and ratios of the various ionization pathways, which are sensitive to the pulse polarization (see ref. Hockett2014 ). As discussed further below, there is some evidence for interferences between ionization paths of different photon-order in the PADs, and this may also contribute to the differences observed in the radial distributions.
As a further cross-check of the tomographic procedure the radial spectrum obtained for the cylindrically symmetric case can be compared to the spectrum determined using standard Abel-based methods. Here an adapted version of the pBasex algorithm Garcia2004 ; Lux2015 was used, which makes use of a forward Abel transform of a set of polar basis functions combined with a fitting routine in order to determine the original, -invariant, photoelectron distribution from a single image (with ). It is clear that the methods are in good agreement.
III.3 Angular distributions and anisotropy parameters
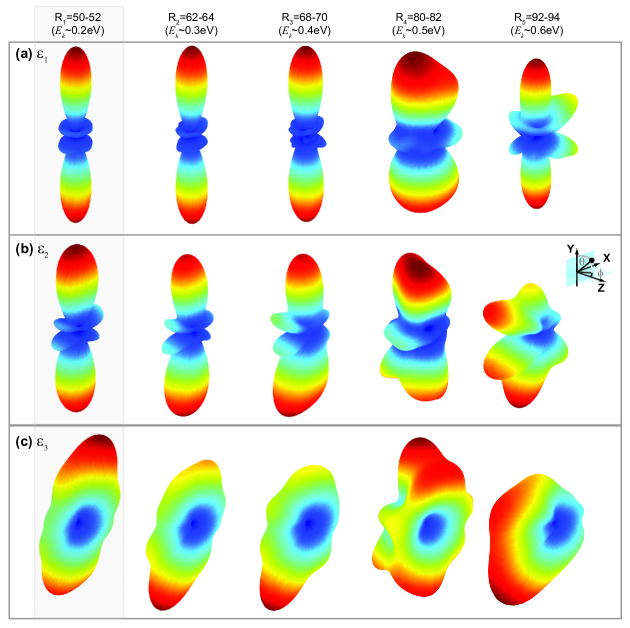
Photoelectron angular distributions (PADs), , were extracted from the 3D data as defined in section II.3. Figure 6 shows some examples of the raw data and the fitted interferograms, plotted in spherical polar space as a function of energy. A radial step size of was used in this procedure, and the fitting can be considered as both a means to determine the parameters and a data smoothing procedure. From these two examples it is apparent that the spherical harmonic expansion describes the experimental data very well. Furthermore, it is immediately clear that the PADs have quite complex angular and energy structure, where only the former aspect was expected from the previously obtained 2D images (ref. Hockett2014 ) and visual inspection of the 3D data (sect. III.1). Figure 6(a) corresponds to the main spectral peak. Here the structure matches that observed directly in the volumetric plots of figure 4, and indicates the expected cylindrical-symmetry. However, figure 6(b), which corresponds to the high velocity wing of the spectrum, shows that the form of the PADs changes and, most interestingly, symmetry breaking is observed, with asymmetries appearing in the plane of polarization.
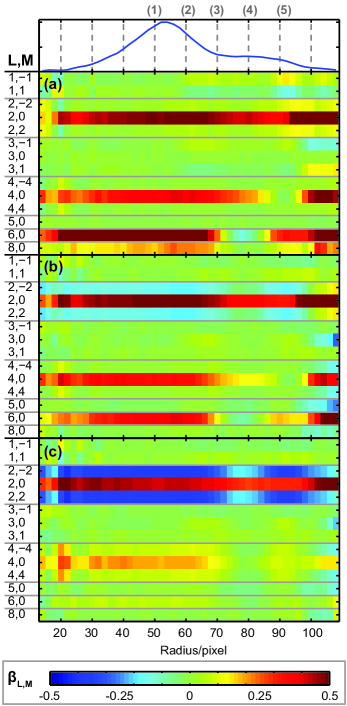
A more detailed view of this behaviour is presented in figures 7 and 8. The former shows PADs for all polarization states and a range of , while the latter shows the which provided the full information content of the data. Although not as evocative as the spherical polar representations shown in figure 7, this reduced dimensionality representation allows for a more detailed overall view of the energy-resolved interferograms. To reduce the complexity of the presentation slightly, the plots here show only the major parameters, defined in this case by for any polarization state . To maintain consistency the same set of parameters is shown for all polarization states, and the colour mapping is similarly maintained for all datasets. Note that the polar coordinate space used is defined such that the polar axis is parallel to the -axis (same convention as figures 3, 6 and 7). This allows for the linear case to take its simplest form, with terms only, and matches the frame definition used for the calculations of refs. Hockett2014 ; Hockett2015a .
In both figures 7 and 8 the evolution of the interferograms with is clear: over the main spectral feature () the are almost invariant, but away from this feature there are significant - but smooth - changes. In particular, the wings of the peaks (, ) show significant evolution of the , as does the region of overlap of the major and minor spectral features (). In general the results show fairly smooth evolution of the with energy, with faster evolution as a function of energy in the regions of peak overlap. The symmetry breaking noted above corresponds to the highest energy regions, in terms these are regions where significant odd- and odd- values are present. This symmetry breaking is particularly clear for cases and , which both have lobes along the -axis in the positive or negative directions only, corresponding to significant and contributions in the spectra. Additionally, figure 8(a) also shows significant terms are present. The interpretation of these observations is discussed in section IV.
Overall, the results clearly show the benefits of a maximum information metrology approach. In particular the clear symmetry-breaking within the plane of polarization is a signature of the presence of additional interfering channels in the photoionization interferometer. These signatures are not observable in the current or previous 2D images, nor allowed by the theoretical treatment, and indicate additional complexities in the light-matter interaction beyond the net 3-photon ionization framework previously established (section II, and refs. Hockett2014 ; Hockett2015a ), details which were otherwise lost.
III.4 Comparison with theoretical results
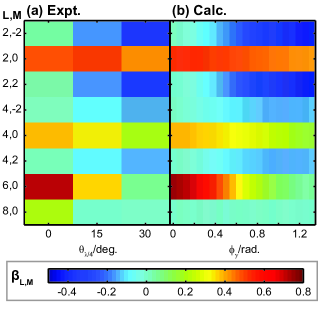
In ref. Hockett2014 , a comparison of 3D distributions based on ionization matrix elements determined from 2D experimental data were compared qualitatively to tomographically reconstructed experimental distributions. While qualitatively in good agreement, a more quantitative comparison at the level of the can now be made. This comparison is shown in figure 9. In the theory, the energy-dependence of the is neglected, hence they are assumed to be constant over the observed radial spectrum. From the analysis above, it is clear that this assumption is valid over the FWHM of the main feature in the spectrum, but does not hold in other regions. Figure 9 therefore compares the theoretical results with the experimental averaged over the FWHM of the main spectral feature. In the theoretical results the polarization state of the light is parametrized by , the spectral phase of the -component of the electric field, where spans all polarization states from linear () to circular (). The experimental results for polarization states , and correspond to , 0.5 and 1.2 rad. respectively. (For further details of the theory and a complementary presentation of the theoretical and tomographic results see ref. Hockett2015a .)
It is clear, as expected from the previous qualitative comparison, that the agreement is good - but not exact. More specifically, the results show that the tomographic data, as a function of , is close to the theoretical results, plotted as a function of , over the main spectral peak, and both smoothly evolve with the pulse polarization. In a general sense this indicates that the theory results, based solely on 2D data, are validated by this comparison with more detailed 3D data. It also suggests, however, that some refinement could be made of the previously obtained ionization matrix elements based on this more detailed data, in particular via the inclusion of the radial dependence of the in the fitting methodology. This is a clear potential offered by the 3D data, and is discussed further in section IV.
There are also additional experimental issues which may play a role here. In this case the exact expansion depends fairly sensitively on the frame-of-reference definition applied, which includes both the definition of the image centre and the choice of the plane. Appropriate frame-rotations were applied during data analysis, but small inaccuracies may still be present. Any processing inaccuracies or artefacts of this type would appear as systematic errors in the extracted , but would not show a clear or smooth energy dependence, so would not affect the results or conclusions presented herein more generally. There is also the assumption that the polarization state of the light is identical over the pulse bandwidth, which may also not be rigorously true. In this case, an apparent energy dependence would be observed in the , but would be caused by this polarization state drift rather than any inherent energy dependence of the photoionization dynamics. Again any effects here are likely to be small, but may be noticeable at this quantitative level of comparison. As observed in the previous section, there are also additional terms which appear in the experimental data, but are not allowed by the current theoretical treatment. Over the main spectral feature there is no symmetry-breaking, but significant terms are present and, as shown in figure 9(b), do not appear in the theoretical results. The possible origin of these features is discussed in the following section.
IV Discussion & Conclusions
In the preceding section the benefits of a full 3D photoelectron measurement were discussed in terms of the quantitative analysis of the observed angular interferograms, facilitated by the parameters. While this treatment is experimentally rigorous, and represents the full information content of the observable, the complexity of the coupling of the continuum wavefunction into the observable necessitates further phenomenological discussion and theoretical analysis in order to understand the physical significance of these observations, and draw firmer conclusions about the light-matter interaction.
Firstly, it is important to reiterate that the good agreement of the current results with the previous model over the main spectral feature suggest that the dominant channels are identical to the 2D data analysed in that case (at a lower peak intensity of 1012Wcm-2) and, therefore, the observation of additional interferences in the 3D data are a direct benefit of the maximum information measurement. It is this enhanced metrology which allows for minor contributions to the interferogram to be cleanly resolved. The ability to directly and quantitatively compare the theoretical results from the previous analysis with experimentally obtained interferograms also provides a rigorous benchmark against which to validate the previous analysis, including the accuracy of the ionization matrix elements determined and the limitations of the theory developed.
In order to understand the additional insights gained from the maximum information measurements, one can approach from a purely experimental perspective. In this case, there are two key observations to consider: the general evolution of the angular interferograms over the energy spectrum or, equivalently, over the Autler-Townes structure of the spectrum,444It is of note here that, in the absence of resonance effects, the ionization matrix elements themselves would not be expected to show a strong energy dependence over the 300 meV span of the main spectral feature considered here. See, for instance, ref. Park1996 for discussion. and the strong symmetry-breaking observed in certain energy regions. These observations are already enough to provide a phenomenological understanding of the interferences observed. The AT structure is a direct result of the AC Stark effect, which causes a dynamic shifting of the energy levels of the ionizing system and continuum as a function of the laser field. In the frequency-domain, this effect results in an effective level splitting defined by the time-average of the laser field, defining a quasi-static “dressed state” level structure. In this picture the photoelectron wavepacket will gain an additional (energy-dependent) phase due to the level splitting, and interferences from different components of the AT structure will occur in regions where photoelectron wavepackets correlated with different quasi-static levels overlap energetically. Analogous behaviour can be seen in energy-domain cases where different ionizing transitions are made to interfere via, for example, multi-colour ionization schemes Yin1992 , which similarly allow the creation of new interferences in the continuum. A similar effect has also been considered in energy-domain work probing intensity effects, for instance refs. Dixit1983 and Ohnesorge1984 , which investigated the high-intensity nano-second pulse regime where AC Stark shifted levels may be tuned in and out of resonance with the excitation pulse, yielding a strong intensity dependence in the angular interferograms according to the number and nature of the states which were coupled by the multi-photon ionization scheme at a given intensity. Due to the the additional laser bandwidth present in the femto or atto-second regime, and consequent broad photoelectron bands, this type of effect might be expected to be very general, and has indeed recently been explored in theory for atto-second ionization in strong fields Yuan2014 .
A more appropriate framework in this case is that of a time-domain interferometer. Here, there is an additional time-dependent phase, and additional interferences will appear in the measurement - which is integrated over the pulse duration - providing that the instantaneous contributions to the continuum wavefunction remain coherent. Examples of this type of effect include the time-domain interferometer discussed in ref. Wollenhaupt2002 , and the “atomic phase-matching” in the two-pulse control scheme of ref. Trallero-Herrero2006 . In this picture, the additional interferences observed are analogous to those which appear with polarization-shaped pulses, in which the coherent temporal interferences are correlated with the instantaneous polarization state of the pulse, allowing for “polarization multiplexing” in the time-integrated measurement (see refs. Hockett2014 ; Hockett2015a ). Here, the additional interferences are associated with the instantaneous pulse intensity, but are otherwise analogous. These types of interferences can be generally termed dynamic, since they depend on the details of the laser pulse and the driven dynamics of the ionizing system. This phenomenology readily explains a strong dependence of the photoelectron interferograms on the AT structure, and is in fact implicit in the band structure of the photoelectron energy spectrum which results from these same dynamical interferences Wollenhaupt2005 ; Bayer2008 , and have also recently been explored in the context of intense XUV pulses Demekhin2013 . However, this phenomenology does not obviously account for the observed symmetry breaking which requires -state dependent phase contributions. This latter effect may, however, be a result of the polarization dependence of the temporal phase, either in terms of the bound or continuum states. For instance, the populations of the and bound states accessed by the left and right circularly polarized components of the field will correlate with the instantaneous electric field polarization, hence ionize at different parts of the field cycle and accumulate different temporal phases.555It is, however, of note that this effect should not be present for pure linearly polarized pulses, unless some other source of symmetry breaking is present. In the dressed state (energy-domain) picture this would be manifested as exactly the required symmetry breaking of the positive and negative states, with a time-dependent superposition of the dressed states created - effectively a manifestation of the electronic ring currents discussed in the current context in ref. Wollenhaupt2009a , in terms of high-harmonic generation in ref. Xie2008 and more recently in the atto-second XUV regime in ref. Yuan2014 .666The spin-orbit components of the manifold (with ) may also play a role here Bayer2008 . Although these were neglected in previous work (refs. Hockett2014 ; Hockett2015a ), since the ionization dynamics will be identical in both cases aside from the overall coupling strength into the continuum, the further dynamic splitting of these states could also allow for the accumulation of different temporal phases and contribute to the observed -level symmetry-breaking. Conceptually this is identical to the spin-neglected case, but results in a more complex 4-state picture. In principle this is again similar to the energy-domain work of ref. Dixit1983 . This phase would be directly mapped into the ionization continuum, again analogously to the polarization multiplexed case previously explored. Similar considerations may also apply to the continuum states, in the case where the ionization cannot be considered in the perturbative regime.
To further investigate the specifics of the light-matter interaction, and the additional minor contributions to the photoelectron interferograms, a more quantitative analysis of the observations can be made by considering the results within our existing theoretical framework. This treatment assumes a single active electron, dipole coupling and perturbative ionization (see papers 1 & 2 for further details). In this scheme strict limits are placed on the allowed angular momenta and symmetries of the final continuum states. Any breaking of these limits therefore indicates additional physical complexities not included in the modelling of the light-matter coupling, for instance the dynamical phase discussed above, other non-perturbative effects, multi-electron effects and so forth. For the 3-photon absorption process outlined in section II, i.e. , treated within this scheme, the final states are restricted to and odd- terms only. This, in turn, places limits on observable interferogram: only with even- and even- are allowed, and are further restricted to . Therefore, the appearance of additional terms in the experimental data indicates the presence of additional partial-waves in the continuum wavefunction. The dynamic interferences descried above do not involve angular momentum exchange, so cannot be responsible for the appearance of new terms, although they may be implicated in symmetry breaking if states are split and accumulate different phases as suggested above.
The appearance of additional angular momentum rather indicates additional interactions - either (a) additional photon absorption and/or (b) photoelectron (re)scattering. The former could lead to angular momentum ladder climbing if additional bound or dressed-states were accessible at the 1 or 2-photon level (e.g. high-lying Rydbergs), although it is not clear which specific states could be coupled in this way, and result in ensemble polarization; a similar effect could result from multiple, cascaded Raman transitions (ultimately equivalent to a field-mediated picture), in which atomic orbitals align with the strong laser field thus creating ensemble alignment. In the case of elliptically polarized light, such effects could drive electronic wavepackets with ring-current like behaviour, as suggested above, and this effect could indeed be responsible for the observed symmetry-breaking depending on the time-averaged ionization of the ring-current density. The latter effect essentially describes any other core-photoelectron interactions, such as angular momentum exchange during ionization, or field-mediated effects at longer range. In this case the single active electron picture (essentially a hydrogenic light-matter interaction) breaks down, and additional electron-electron scattering occurs. Such processes can be treated with more complex angular momentum coupling schemes, and experimentally would be indicated by the creation of electronically excited ions.
A final, but less likely, possibility is the breakdown of the dipole approximation. This would also result in the creation of high-order continuum states, but due to direct multi-polar light-matter couplings. Since the dipole approximation relies on the wavelength of the electric field being large compared to the target, it is expected to hold at 800 nm and low photoelectron energies, although it has previously been observed that relatively low-energy processes may still require multipole couplings Hemmers2003 ; Lepine2004 . However, such effects break the interferogram symmetry along the photon propagation axis, so would not explain the main observations here. Finally it should be noted that additional macroscopic effects may also play a role here, including intensity averaging over the laser pulse and the static electric fields present in the VMI chamber (which are known to influence states near threshold as mentioned in sect. III.1); any irregularities in the laser pulse could also affect the minor channels observed, such as non-uniform spectral phase and polarization state, although such effects are expected to be negligible in this case.
From these considerations it appears that both dynamical interferences, resulting from the mapping of the AT effect onto the photoelectron spectral phase and resulting in a strong energy dependence to the interferograms, and angular momentum couplings, resulting in the terms observed in the interferograms, must both be present. Although a more sophisticated theoretical treatment, and possibly additional experiments to consider the intensity dependence, is needed in order to asses the exact nature of these possibilities, and the precise details of the symmetry-breaking interactions, from the experimental perspective the ability to resolve these effects is a uniquely powerful result of maximum information methods. The 3D data, reflecting the complex set of interfering ionization channels through the observable dissected in terms of angular interferograms and associated anisotropy parameters, reveals a wealth of detailed information on the fundamental physics of the light-matter interaction, and scattering of the outgoing electron, and requires no a priori assumptions regarding the symmetry of the light-matter interaction. This high level of detail necessitates careful analysis but, ultimately, provides the most complete picture of such interactions possible, whether the goal is quantum metrology or quantum control.
Financial support by the State Initiative for the Development of Scientific and Economic Excellence (LOEWE) in the LOEWE-Focus ELCH is gratefully acknowledged.
References
- [1] Howard Cohen and U. Fano. Interference in the Photo-Ionization of Molecules. Physical Review, 150(1):30–33, October 1966.
- [2] J. Cooper and Richard N. Zare. Angular Distribution of Photoelectrons. The Journal of Chemical Physics, 48(2):942, 1968.
- [3] D Akoury, K Kreidi, T Jahnke, Th Weber, A Staudte, M Schöffler, N Neumann, J Titze, L Ph H Schmidt, A Czasch, O Jagutzki, R A Costa Fraga, R E Grisenti, R Díez Muiño, N A Cherepkov, S K Semenov, P Ranitovic, C L Cocke, T Osipov, H Adaniya, J C Thompson, M H Prior, A Belkacem, A L Landers, H Schmidt-Böcking, and R Dörner. The simplest double slit: interference and entanglement in double photoionization of H2. Science, 318(5852):949–952, 2007.
- [4] M. Wollenhaupt, A. Assion, D. Liese, Ch. Sarpe-Tudoran, T. Baumert, S. Zamith, M A Bouchene, B. Girard, A. Flettner, U. Weichmann, and G. Gerber. Interferences of ultrashort free electron wave packets. Physical review letters, 89(17):173001, October 2002.
- [5] Matthias Wollenhaupt, Christian Lux, Marc Krug, and Thomas Baumert. Tomographic reconstruction of designer free-electron wave packets. Chemphyschem : a European journal of chemical physics and physical chemistry, 14(7):1341–9, May 2013.
- [6] J. Duncanson, M. Strand, A. Lindgå rd, and R. Berry. Angular Distributions of Electrons from Resonant Two-Photon Ionization of Sodium. Physical Review Letters, 37(15):987–990, October 1976.
- [7] DJ Leahy, KL Reid, and RN Zare. Complete description of two-photon (1+1’) ionization of NO deduced from rotationally resolved photoelectron angular distributions. The Journal of chemical physics, 95(August):1757–1767, 1991.
- [8] Uwe Becker. Complete photoionisation experiments. Journal of Electron Spectroscopy and Related Phenomena, 96(1-3):105–115, November 1998.
- [9] Katharine L Reid. Photoelectron angular distributions. Annual review of physical chemistry, 54(19):397–424, January 2003.
- [10] O. Geßner, Y. Hikosaka, B. Zimmermann, a. Hempelmann, R. Lucchese, J. Eland, P.-M. Guyon, and U. Becker. 4-1 Inner Valence Photoionization Dynamics of NO Derived from Photoelectron-Photoion Angular Correlations. Physical Review Letters, 88(19):193002, April 2002.
- [11] M S Schöffler, T Jahnke, J Titze, N Petridis, K Cole, L Ph H Schmidt, a Czasch, O Jagutzki, J B Williams, C L Cocke, T Osipov, S Lee, M H Prior, a Belkacem, a L Landers, H Schmidt-Böcking, R Dörner, and Th Weber. Matter wave optics perspective at molecular photoionization: K-shell photoionization and Auger decay of N 2. New Journal of Physics, 13(9):095013, September 2011.
- [12] M Meckel, D Comtois, D Zeidler, a Staudte, D Pavicic, H C Bandulet, H Pépin, J C Kieffer, R Dörner, D M Villeneuve, and P B Corkum. Laser-induced electron tunneling and diffraction. Science, 320(5882):1478–82, June 2008.
- [13] Y Huismans, A Rouzée, A Gijsbertsen, J H Jungmann, A S Smolkowska, P S W M Logman, F Lépine, C Cauchy, S Zamith, T Marchenko, J M Bakker, G Berden, B Redlich, A F G van der Meer, H G Muller, W Vermin, K J Schafer, M Spanner, M Yu Ivanov, O Smirnova, D Bauer, S V Popruzhenko, and M J J Vrakking. Time-resolved holography with photoelectrons. Science, 331(6013):61–4, January 2011.
- [14] M. Meckel, a. Staudte, S. Patchkovskii, D. M. Villeneuve, P. B. Corkum, R. Dörner, and M. Spanner. Signatures of the continuum electron phase in molecular strong-field photoelectron holography. Nature Physics, 10(8):594–600, July 2014.
- [15] A. Assion, M. Geisler, J. Helbing, V. Seyfried, and T. Baumert. Femtosecond pump-probe photoelectron spectroscopy: Mapping of vibrational wave-packet motion. Physical Review A, 54(6):R4605–R4608, 1996.
- [16] Yasuki Arasaki, Kazuo Takatsuka, Kwanghsi Wang, and Vincent McKoy. Femtosecond energy- and angle-resolved photoelectron spectra. Chemical Physics Letters, 302(5-6):363–374, March 1999.
- [17] M. Wollenhaupt, A. Assion, O. Graefe, D. Liese, C. Sarpe-Tudoran, M. Winter, and T. Baumert. Changes of the electronic structure along the internuclear coordinate studied by ultrafast photoelectron spectroscopy: The 21Su+ Na2 double-minimum state. Chemical Physics Letters, 376:457–464, 2003.
- [18] Paul Hockett, Christer Z. Bisgaard, Owen J. Clarkin, and Albert Stolow. Time-resolved imaging of purely valence-electron dynamics during a chemical reaction. Nature Physics, 7(8):612–615, April 2011.
- [19] Kwanghsi Wang, Vincent McKoy, Paul Hockett, and Michael S. Schuurman. Time-Resolved Photoelectron Spectra of CS2: Dynamics at Conical Intersections. Physical Review Letters, 112(11):113007, March 2014.
- [20] M. Wollenhaupt, M. Krug, J. Köhler, T. Bayer, C. Sarpe-Tudoran, and T. Baumert. Photoelectron angular distributions from strong-field coherent electronic excitation. Applied Physics B, 95(2):245–259, February 2009.
- [21] P. Hockett, M. Wollenhaupt, C. Lux, and T. Baumert. Complete Photoionization Experiments via Ultrafast Coherent Control with Polarization Multiplexing. Physical Review Letters, 112(22):223001, June 2014.
- [22] Eugene Wigner. Lower Limit for the Energy Derivative of the Scattering Phase Shift. Physical Review, 98(1):145–147, April 1955.
- [23] C.A.A. de Carvalho and H.M. Nussenzveig. Time delay. Physics Reports, 364(2):83–174, June 2002.
- [24] Katharine L. Reid. Photoelectron angular distributions: developments in applications to isolated molecular systems. Molecular Physics, 110(3):131–147, February 2012.
- [25] André T. J. B. Eppink and David H Parker. Velocity map imaging of ions and electrons using electrostatic lenses: Application in photoelectron and photofragment ion imaging of molecular oxygen. Review of Scientific Instruments, 68(9):3477, 1997.
- [26] D. H. Parker and A. T. J. B. Eppink. Photoelectron and photofragment velocity map imaging of state-selected molecular oxygen dissociation/ionization dynamics. The Journal of Chemical Physics, 107(7):2357, 1997.
- [27] Benjamin J. Whitaker, editor. Imaging in Molecular Dynamics Technology and Applications. Cambridge University Press, 2003.
- [28] Gustavo a. Garcia, Laurent Nahon, and Ivan Powis. Two-dimensional charged particle image inversion using a polar basis function expansion. Review of Scientific Instruments, 75(11):4989, 2004.
- [29] Paul Hockett, Matthias Wollenhaupt, Christian Lux, and Thomas Baumert. Complete Photoionization Experiments via Ultrafast Coherent Control with Polarization Multiplexing II: Numerics and Analysis Methodologies. In preparation, 2015.
- [30] We note for completeness that there are other methods of obtaining 3D distributions, such as direct 3D imaging-type methods which combine spatial and time-of-flight measurements. Typically such measurements are more challenging for various reasons, although they are now routine for a few experimental groups and may offer additional measurement capabilities such as full photoion-photoelectron vector correlations depending on the experimental configuration, see for instance refs. [59, 24, 60] and references therein. Non-imaging techniques, based on serial point-by-point measurements, have been in use for decades but are severely limited by the long collection times required to obtain high resolution 3D datasets, and may be further limited by the available energy (time-of-flight) resolution. Some further aspects of 1D, 2D and 3D measurement techniques, including resolution considerations, are discussed in ref. [61]. In general we note that 2D imaging combined with tomographic reconstruction offers a significant reduction in measurement time as compared to direct 3D imaging techniques, and a simpler experimental set-up.
- [31] Christian Lux, Matthias Wollenhaupt, Cristian Sarpe, and Thomas Baumert. Photoelectron Circular Dichroism of Bicyclic Ketones from Multiphoton Ionization with Femtosecond Laser Pulses. ChemPhysChem, 16(1):115–137, January 2015.
- [32] Beth Schaefer, Edward Collett, Robert Smyth, Daniel Barrett, and Beth Fraher. Measuring the Stokes polarization parameters. American Journal of Physics, 75(2):163, 2007.
- [33] M. Wollenhaupt, M. Krug, J. Köhler, T. Bayer, C. Sarpe-Tudoran, and T. Baumert. Three-dimensional tomographic reconstruction of ultrashort free electron wave packets. Applied Physics B, 95(4):647–651, April 2009.
- [34] C Smeenk, L Arissian, a Staudte, D M Villeneuve, and P B Corkum. Momentum space tomographic imaging of photoelectrons. Journal of Physics B: Atomic, Molecular and Optical Physics, 42(18):185402, September 2009.
- [35] Paul Hockett, Michael Staniforth, and Katharine L. Reid. Photoelectron angular distributions from rotationally state-selected NH 3 (B 1 E"): dependence on ion rotational state and polarization geometry. Molecular Physics, 108(7-9):1045–1054, April 2010.
- [36] C. Yang. On the Angular Distribution in Nuclear Reactions and Coincidence Measurements. Physical Review, 74(7):764–772, October 1948.
- [37] David J Leahy, Katharine L Reid, Hongkun Park, and Richard N Zare. Measurement of circular dichroism in rotationally resolved photoelectron angular distributions following the photoionization of NO A 2+. The Journal of Chemical Physics, 97(7):4948, 1992.
- [38] For clarity it is important to note here that while the observed angular structure may be conveniently labelled with such terms - -like, -like etc. - the terminology is used in this context only to apply to the observable angular interferogram, and does not imply any knowledge about the contributing continuum wavefunction.
- [39] Céline Nicole, Ingrid Sluimer, Florentina Rosca-Pruna, Marcel Warntjes, Marc Vrakking, Christian Bordas, Frederic Texier, and Francis Robicheaux. Slow Photoelectron Imaging. Physical Review Letters, 85(19):4024–4027, November 2000.
- [40] F. Lépine, Ch. Bordas, C. Nicole, and M. Vrakking. Atomic photoionization processes under magnification. Physical Review A, 70(3):033417, September 2004.
- [41] Benjamin Wolter, Christoph Lemell, Matthias Baudisch, Michael G. Pullen, Xiao-Min Tong, Michaël Hemmer, Arne Senftleben, Claus Dieter Schröter, Joachim Ullrich, Robert Moshammer, Jens Biegert, and Joachim Burgdörfer. Formation of very-low-energy states crossing the ionization threshold of argon atoms in strong mid-infrared fields. Physical Review A, 90:063424, 2014.
- [42] D. Dimitrovski, J. Maurer, H. Stapelfeldt, and L. B. Madsen. Low-Energy Photoelectrons in Strong-Field Ionization by Laser Pulses with Large Ellipticity. Physical Review Letters, 113(10):103005, September 2014.
- [43] A similar analysis of 3D photoelectron interferograms from a time-resolved case can be found in ref. [60], along with a more detailed discussion of the dimensionality of the observables.
- [44] M Wollenhaupt, A Assion, O Bazhan, Ch. Horn, D Liese, Ch. Sarpe-Tudoran, M Winter, and T Baumert. Control of interferences in an Autler-Townes doublet: Symmetry of control parameters. Phys. Rev. A, 68(1):15401, July 2003.
- [45] M Wollenhaupt, a Präkelt, C Sarpe-Tudoran, D Liese, and T Baumert. Strong field quantum control by selective population of dressed states. Journal of Optics B: Quantum and Semiclassical Optics, 7(10):S270–S276, October 2005.
- [46] It is of note here that, in the absence of resonance effects, the ionization matrix elements themselves would not be expected to show a strong energy dependence over the 300 meV span of the main spectral feature considered here. See, for instance, ref. [62] for discussion.
- [47] Yi-Yian Yin, Ce Chen, D. Elliott, and A. Smith. Asymmetric photoelectron angular distributions from interfering photoionization processes. Physical Review Letters, 69(16):2353–2356, October 1992.
- [48] S. Dixit and P. Lambropoulos. Theory of photoelectron angular distributions in resonant multiphoton ionization. Physical Review A, 27(2):861–874, February 1983.
- [49] W. Ohnesorge, F. Diedrich, G. Leuchs, D. Elliott, and H Walther. Influence of the dynamic Stark effect on photoelectron angular distributions in multiphoton ionization. Physical Review A, 29(3):1181–1187, March 1984.
- [50] Kai-Jun Yuan, Zhigang Sun, and André D Bandrauk. Autler-Townes Effects in Attosecond Circular Polarization Molecular Photoionization. Journal of Physics: Conference Series, 529:012004, August 2014.
- [51] Carlos Trallero-Herrero, J. L. Cohen, and Thomas Weinacht. Strong-field atomic phase matching. Physical Review Letters, 96(February):063603, 2006.
- [52] Tim Bayer, Matthias Wollenhaupt, and Thomas Baumert. Strong-field control landscapes of coherent electronic excitation. Journal of Physics B: Atomic, Molecular and Optical Physics, 41(7):074007, April 2008.
- [53] Philipp V. Demekhin and Lorenz S. Cederbaum. ac Stark effect in the electronic continuum and its impact on the photoionization of atoms by coherent intense short high-frequency laser pulses. Physical Review A, 88(4):043414, October 2013.
- [54] It is, however, of note that this effect should not be present for pure linearly polarized pulses, unless some other source of symmetry breaking is present.
- [55] Xinhua Xie, Armin Scrinzi, Marlene Wickenhauser, Andrius Baltuška, Ingo Barth, and Markus Kitzler. Internal momentum state mapping using high harmonic radiation. Physical Review Letters, 101(JULY):1–4, 2008.
- [56] The spin-orbit components of the manifold (with ) may also play a role here [52]. Although these were neglected in previous work (refs. [21, 29]), since the ionization dynamics will be identical in both cases aside from the overall coupling strength into the continuum, the further dynamic splitting of these states could also allow for the accumulation of different temporal phases and contribute to the observed -level symmetry-breaking. Conceptually this is identical to the spin-neglected case, but results in a more complex 4-state picture. In principle this is again similar to the energy-domain work of ref. [48].
- [57] O. Hemmers, R. Guillemin, E. Kanter, B. Krässig, D. Lindle, S. Southworth, R. Wehlitz, J. Baker, a. Hudson, M. Lotrakul, D. Rolles, W. Stolte, I. Tran, a. Wolska, S. Yu, M. Amusia, K. Cheng, L. Chernysheva, W. Johnson, and S. Manson. Dramatic Nondipole Effects in Low-Energy Photoionization: Experimental and Theoretical Study of Xe 5s. Physical Review Letters, 91(5):053002, August 2003.
- [58] F. Lépine, S. Zamith, a. de Snaijer, Ch. Bordas, and M. Vrakking. Observation of Large Quadrupolar Effects in a Slow Photoelectron Imaging Experiment. Physical Review Letters, 93(23):233003, November 2004.
- [59] R E Continetti. Coincidence spectroscopy. Annual review of physical chemistry, 52:165–92, January 2001.
- [60] Paul Hockett, Enrico Ripani, Andrew Rytwinski, and Albert Stolow. Probing ultrafast dynamics with time-resolved multi-dimensional coincidence imaging: butadiene. Journal of Modern Optics, 60(17):1409–1425, October 2013.
- [61] A. I. Chichinin, K.-H. Gericke, S. Kauczok, and C. Maul. Imaging chemical reactions - 3D velocity mapping. International Reviews in Physical Chemistry, 28(4):607–680, October 2009.
- [62] Hongkun Park and Richard N. Zare. Molecular-orbital decomposition of the ionization continuum for a diatomic molecule by angle- and energy-resolved photoelectron spectroscopy. I. Formalism. The Journal of Chemical Physics, 104(12):4554, 1996.