IC 3599 did it again: A second outburst of the X-ray transient Seyfert 1.9 Galaxy
Abstract
We report on the Swift discovery of a second high-amplitude (factor 100) outburst of the Seyfert 1.9 galaxy IC 3599, and discuss implications for outburst scenarios. Swift detected this active galactic nucleus (AGN) again in February 2010 in X-rays at a level of (1.500.11) W (0.2-2.0 keV), which is nearly as luminous as the first outburst detected with ROSAT in 1990. Optical data from the Catalina sky survey show that the optical emission was already bright two years before the Swift X-ray high-state. Our new Swift observations performed between 2013 and 2015 show that IC 3599 is currently again in a very low X-ray flux state. This repeat optical and X-ray outburst, and the long optical duration, suggest that IC 3599 is likely not a tidal disruption event (TDE). Instead, variants of AGN-related variability are explored. The data are consistent with an accretion disk instability around a black hole of mass on the order 106–107 M⊙; a value estimated using several different methods.
Subject headings:
galaxies: active — galaxies: individual (IC 3599) — galaxies: Seyfert1. Introduction
The highest amplitudes of X-ray variability recorded so far among galaxies have been detected from the cores of a few quiescent galaxies, and have been interpreted as the tidal disruption and accretion of stars by dormant supermassive black holes (SMBHs; review by Komossa, 2012). These events happen when a star gets too close to the central SMBH and is disrupted due to tidal forces. Part of the stellar debris will form an accretion disk and will be swallowed by the SMBH (e.g., Rees, 1988), producing a luminous accretion flare. One of the most spectacular of these events, Swift J1644+57, was discovered in March 2011 by Swift (Bloom et al., 2011; Burrows et al., 2011). Before Swift (Gehrels et al., 2004), one of the most successful surveys to discover TDEs was the ROSAT All-Sky Survey (RASS), during which several events were found (Bade et al., 1996; Grupe et al., 1999; Komossa & Greiner, 1999; Komossa & Bade, 1999).
The Seyfert 1.9 galaxy IC 3599 (Zw 159.034; 1RXS J123741.2; = , = , z=0.0215; Grupe et al., 1995; Brandt et al., 1995; Komossa & Bade, 1999) was noticed in the RASS due to its very bright X-ray emission. However, when ROSAT re-observed IC 3599 again about a year later its flux (0.1-2.4 keV) had dropped by a factor of more than 60 (Grupe et al., 1995; Brandt et al., 1995), and continued to fade, implying a total amplitude of variability larger than a factor 100. Its X-ray spectrum was very soft, and the high-state X-ray emission was accompanied by strong, broad emission lines from hydrogen, helium, and iron (Brandt et al., 1995), which faded significantly in subsequent years (Grupe et al., 1995; Komossa & Bade, 1999). This kind of emission-line flaring is very rare, and has only recently been observed in a few other galaxies (e.g., Komossa et al., 2008). A broad H line component was still present 7 years after the high-state of IC 3599 (and still is in a recent SDSS spectrum; see below), which led to a Seyfert 1.9 classification of the galaxy (Komossa & Bade, 1999). The classification of IC 3599 as an AGN is consistent with its radio detection (Bower et al., 2013) and with its AGN-dominated MIR spectrum (Sani et al., 2010). The cause for the outburst of IC 3599 remained unknown, and several possibilities were considered: high-amplitude Narrow-line Seyfert 1 (NLS1) variability111Note, however, that IC 3599 is very likely not a NLS1 galaxy, since it does not show any FeII emission, neither at outburst nor quiescence, and since its Seyfert 1.9 classification indicates that the inner, high-velocity BLR is obscured, an accretion disk instability, or a TDE. Its bright high-ionization iron lines were successfully modeled by photoionization of high-density gas with the properties of a CLR (coronal line region), illuminated by a flare with a strong EUV – soft X-ray bump (Komossa & Bade, 1999). The faint coronal lines still present years after the outburst did not vary further, indicating that they are permanent, and similar to those seen in other Seyfert galaxies.
When Swift observed IC 3599 for the first time in 2010 February, it detected a new outburst. The luminosity level of 1.5 W (0.2-2.0 keV band) was only a factor of 2 below the value seen during the RASS (Grupe et al., 1995, 2001). After we noticed the high-state, we triggered new Swift follow-ups of IC 3599 which are reported here, along with other multi-wavelength data and a re-discussion of outburst scenarios. Results of our study were first presented by Komossa et al. (2015), and independently by Campana et al. (2015), who explored the possibility that IC 3599 is experiencing repeat tidal stripping of an orbiting star.
Throughout this paper spectral indices are denoted as . Luminosities are calculated assuming a CDM cosmology with =0.286, =0.714 and a Hubble constant of =70 km s-1 Mpc-1. This results in a luminosity distances =91.4 Mpc using the cosmology calculator by Wright (2006). All errors are 1 unless stated otherwise.
2. Observations and Data Reduction
2.1. Swift Data
A full list of the Swift observations of IC 3599 is given in Table 1. The Swift X-ray telescope (XRT) was operating in photon counting mode and the data were reduced by the task xrtpipeline version 0.12.6., which is included in the HEASOFT package 6.12. Source counts were selected in a circle with a radius of 70.7 for the 2010 February and May observations, and 47.1 for all others. The larger source extraction radius during the 2010 observations was chosen because the source was brighter. The background counts were collected in a nearby circular region with a radius of 247.5. Only the 2010 February and May data had enough counts to allow for a spectral analysis of each individual observation. The data of 2013 and 2014 were merged to allow for a spectral analysis. For all spectra we used the most recent response file swxpc0to12s6_20130101v014.rmf, and XSPEC version 12.7.1 for analysis. Due to the small number of counts used in the spectra, the counts were not binned.
The UV-optical telescope (UVOT) data of each segment were coadded in each filter with the UVOT task uvotimsum. Except for 2013 November, all observations were performed in all 6 UVOT filters. Source counts in all 6 UVOT filters were selected in a circle with a radius of 3 and background counts in an annulus around the source extraction region, with radii of and , in order to subtract the contribution of star light from the host galaxy. UVOT magnitudes and fluxes were measured with the task uvotsource and aperture corrected by setting the parameter apercorr=CURVEOFGROWTH based on the most recent UVOT calibration as described in Breeveld et al. (2010). The UVOT data were corrected for Galactic reddening (; Schlegel et al., 1998), using equation (2) in Roming et al. (2009).
2.2. XMM-Newton Slew Survey
The field of IC 3599 was covered during the XMM-Newton slew 9137800003 (Saxton et al., 2008), on 2007-June-19. No photons from the source were detected and the EPIC pn, 2-sigma, upper limits of 0.8 and 0.7 counts s-1, imply flux upper limits of 1.2 and 9.6 W m2 in the 0.2-12 keV and 0.2-2 keV bands respectively, assuming a spectrum with slope =2.5 and Galactic absorption of cm-2.
3. Results
3.1. X-ray Spectral Analysis
The X-ray spectrum during the outburst in 2010 February can be fitted with a simple absorbed power law model with a X-ray spectral index =2.630.30 and the absorption column density fixed to the Galactic value. The flux in the 0.2-2.0 keV band assuming this model is (1.410.11) W m-2. This is about half the flux that was detected during the RASS (Grupe et al., 1995, 2001). The 0.3-10 keV flux was 9.26 W m-2. The spectral slope is similar to that measured during the RASS. Alternatively, the X-ray spectrum can also be fitted by an absorbed blackbody plus power law model (with fixed to 1.0) which results in a blackbody temperature equivalent of = 9116 eV. This is the same value as measured during the original outburst during the RASS (Grupe et al., 1995).
The Seyfert 1.9 classification of IC 3599 does suggest that we should expect to see excess absorption above the Galactic value. Although there is some hint of excess absorption when the spectrum is fitted by a single power law model, there is no evidence for excess absorption when the data are fitted by a blackbody model. However, the quality of the relatively short-exposed spectrum during the high state in February 2010 does not allow final conclusions on the intrinsic column density.
In order to obtain an X-ray low state spectrum, we combined the data from the Swift observations of 2013 and 2014 which resulted in a total exposure time of 16.9 ks with a total of 50 source counts. The spectral analysis was performed applying Cash statistics (Cash, 1979). This spectrum can be modeled with a harder spectrum with an X-ray spectral index of =1.400.70 with fixed to the Galactic value. There is no indication of excess absorption beyond that. The 0.3-10 keV flux of this combined spectrum is (9.671.62) W m-2 – a factor 100 lower than during the 2010 February outburst. Note that when applying the absorbed blackbody plus power law model mentioned above during the high state, the black body component has disappeared in the low state spectrum.
3.2. Long-term Light Curve
The fluxes in X-rays and in the UV/optical obtained by Swift are listed in Table 1. The ROSAT observations have already been published in Grupe et al. (1995, 2001) and Brandt et al. (1995), and the Chandra measurements were discussed in Vaughan et al. (2004). The long-term light curve including our latest Swift observations is shown in the left panel of Figure 1 (see also Komossa et al., 2015; Campana et al., 2015), together with the XMM-Newton slew-survey upper limit.
3.3. Catalina Sky Survey Optical Light Curve
While we do not have X-ray observations between the Chandra and XMM-Newton slew survey observations in 2002 and 2007, respectively, IC 3599 was monitored in the optical by the Catalina sky survey (Drake et al., 2009). The Catalina light curve is shown together with the Swift XRT and UVOT W2 light curves in the right panel of Figure 2. According to the Catalina light curve, IC 3599 was already optically bright in 2008, and the outburst must have happened around MJD 54570 which translates to 2008 April 14. Then, either a second optical outburst occurred in 2010, or else the outburst lasted for roughly two years with the peak at around MJD 55260 (2010 March 05) which was about a week after the Swift observation on 2010 February 25. These observations provide potentially tight constraints on outburst scenarios.
3.4. Spectral Energy Distributions
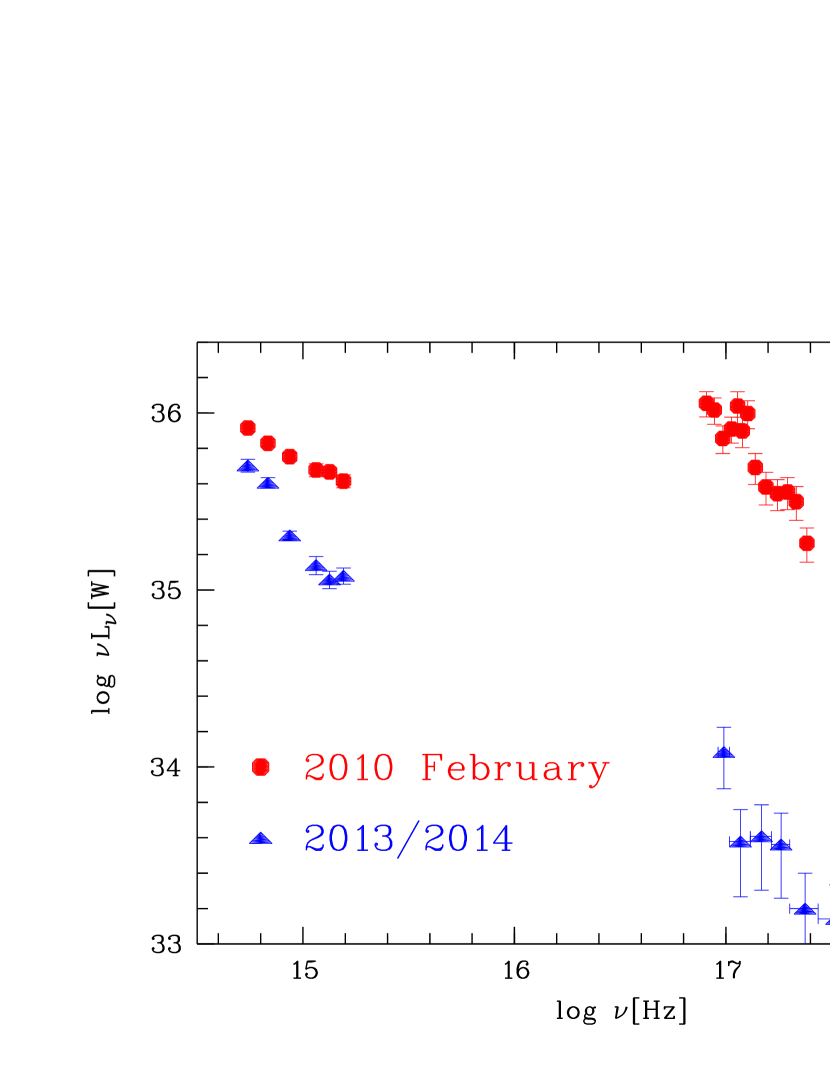
The spectral energy distributions during the February 2010 high state and the 2013/2014 low state are displayed in Figure 3. The drop seen in X-rays is significantly larger than in the optical/UV (note, however, that the optical emission may still be affected by host galaxy contribution. If so, these values are upper limits for the core emission). Under these constraints, and assuming a black hole mass of (see below), the Eddington ratios during these two epochs were =0.04 and 0.003, respectively.
3.5. The Optical SDSS Spectrum
A new optical spectrum of IC 3599 was taken in the course of the Sloan Digital Sky Survey (SDSS, York et al., 2000) in 2005-December-25 (MJD 53729). We have used this spectrum for a SMBH mass estimate, and in order to check, whether emission lines have flared again, as previously observed (Brandt et al., 1995). We find that narrow emission lines including [FeVII] transitions are at their low emission levels, as seen in previous low-state optical spectra from 1995 (Grupe et al., 1995) and 1997 (Komossa & Bade, 1999), and emission-line ratios are consistent with little or no variability since then. An analysis of the H emission line complex shows, that the spectrum is still consistent with the presence of a faint broad emission line component, with FWHM(H) km s-1, similar to the value measured before (Brandt et al. 1995, Grupe et al. 1995, Komossa & Bade 1999). Because of the Seyfert 1.9 classification, we do not use this line width to estimate the SMBH mass of IC 3599, since application of the well-established width – luminosity relation (e.g. Peterson et al., 2004) requires an unobscured view on the bulk of the broad-line region (BLR). Instead, we use the width of [OIII]5007 as a proxy for velocity dispersion (e.g. Nelson, 2000), and then use the scaling relation with SMBH mass as given by Tremaine et al. (2002). First, we have fit the [OIII] emission with a Gauss profile, and have carefully checked that [OIII] is well represented by a single component, and does not show a strong asymmetry, or an extra blue wing. We then obtain a line width of FWHM([OIII]) = 280 km/s (corrected for instrumental resolution), well consistent with the value of 260 km/s reported by Komossa & Bade (1999). Applying the relation of Tremaine et al. (2002) then gives = 1.2 M⊙.
4. Discussion
We have detected, and followed up, a second outburst in the Seyfert galaxy IC 3599 with Swift. This has important implications for outburst scenarios of this unusual source, because some of those initially considered, did not predict repeat flaring. Since the value is important for the further discussion, we first comment on several estimates of the SMBH mass of IC 3599, and then proceed with discussing outburst scenarios.
4.1. Black Hole Mass Determination
We have followed several different approaches of estimating the SMBH mass of IC 3599. First, applying scaling relations between velocity dispersion and SMBH mass, we obtain = 1.2 (Sect. 3.5). Second, from the relationship of black hole mass to bulge K-band luminosity (Marconi & Hunt, 2003) we find , with a systematic error of 0.3 dex, from the 2MASX magnitude of , after subtracting 25% contributed by the central AGN-dominated point source and correcting for the bulge ratio of 0.42 (Simard et al., 2011). Third, an order of magnitude estimate of the SMBH mass can also be derived from the temperature of the accretion disk measured from the high-state spectrum in 2010, eV. Following Peterson (1997, equation 3.20), we obtain .
4.2. Outburst Scenarios
4.2.1 Repeat Tidal Disruption Events
At first glance, the detection of repeated flaring is unexpected, if the TDE interpretation of IC 3599 was correct, because classical TDEs are rare events, at a rate of about 10-4–10-5 per year and per galaxy (Alexander, 2012; Komossa, 2012, for reviews of theory and observations, respectively). However, recent work has shown that recurrent outbursts or high states may also occur in TDE scenarios, for instance when one of the following conditions is met: (1) If IC 3599 hosts a binary black hole or recoiling black hole, tidal disruption rates are temporarily strongly boosted (e.g. Chen et al., 2009; Komossa & Merritt, 2008; Stone & Loeb, 2011), and a new disruption event can occur within decades. (2) If a TDE in IC 3599 happened in a binary SMBH, its light curve would show characteristic recurrent dips, since the presence of the secondary temporarily interrupts the accretion stream on the primary (Liu et al., 2014). However, in both cases it is unlikely that they produce a peak luminosity very similar to the earlier one in 1990. (3) A third possibility was studied by Campana et al. (2015), who suggested that the flaring is due to repeat tidal stripping of an orbiting star. However, this scenario, which predicts a rapid rise to maximum (their Fig. 2) may be difficult to reconcile with the optical high-state already seen in 2008.
4.2.2 Variability Related to a Supermassive Binary Black Hole
If the outbursts of IC 3599 continue repeating, the behavior is reminiscent of the blazar OJ 287 (e.g. Sillanpää et al., 1988; Valtonen et al., 2008), and a binary SMBH might be responsible; i.e., a secondary BH impacting the accretion disk around the primary while orbiting. The two optical high-states in 2008 and 2010 are then similar to the double-peaked optical high-states of OJ 287, which have been interpreted as the two disk impacts of the secondary BH during its orbit. Another mechanism which produces repeat outbursts is episodic stream-feeding of one of the black holes in a binary SMBH system (Tanaka, 2013) which recurs every orbit. Ongoing monitoring with Swift is required in order to test these scenarios further.
4.2.3 A Disc Instability
Given the evidence that IC 3599 hosts a long-lived AGN, extreme processes in its accretion disk are a likely cause of the repeat outbursts. These are suggestive of a recurrent regular process. Similar large flares have been seen in a small number of accreting Galactic sources (e.g. GRS 1915+105, GRO J1744-28, and IGR 17091-3624; Belloni et al., 1997a; Cannizzo, 1996; Pahari et al., 2013, respectively). In these cases the fast rise and decay in flux has been attributed to an instability in a radiation-pressure dominated inner disk (Lightman & Eardley, 1974). Recently, Saxton et al. (2015) have applied the instability to a single flare seen in the nucleus of the galaxy NGC 3599. In this mechanism, the inner disc is initially empty or filled with tenuous gas out to a truncation radius, . During the quiescent phase the inner disc is filled by diffusion from the outer disc without significantly increasing the X-ray flux. At some point, the internal radiation pressure of the disc becomes greater than the gas pressure causing a heating wave, that increases the local viscosity, scale height and accretion rate, to propagate from the inner radius back to the truncation radius. In this phase the luminosity increases quickly. Later, as the inner disc is accreted more rapidly than it is replenished, the flare decays back to the quiescent level, a new hole is left in the central region and the cycle begins again.
The repeat time for flares is given by the filling time of the inner disc (Saxton et al., 2015) as
| (1) |
in units of months where is the black hole mass in units of M⊙ and , the gravitational radius. Assuming that the infill rate is Eddington limited (), the viscosity and the inner radius then for a flare repeat time of 19.5 years and we find =5–45 . This is comparable to the value of 4–22 (depending on spin) which was inferred in GRS 1915+105 (Belloni et al., 1997a, b).
A lower limit for the rise time is given by the time taken to fully heat the inner disc (Belloni et al., 1997a; Saxton et al., 2015):
| (2) |
For the flare in IC 3599, days, consistent with the months inferred from the Catalina curve. 222Several mechamisms which could extent the flare duration have been explored (Nayakshin, et al., 2000; Janiuk & Czerny, 2005) This scenario is supported by the X-ray spectra which can be explained by a weak power-law component augmented by a highly variable thermal component.
References
- Alexander (2012) Alexander, T., 2012, EPJ Web of Conf., 39, 05001
- Bade et al. (1996) Bade, N., Komossa, S., & Dahlem, M., 1996, A&A, 309, L35
- Breeveld et al. (2010) Breeveld, A.A., Curran, P.A., Hoversten, E.A., et al., 2010, MNRAS, 406, 1687
- Belloni et al. (1997a) Belloni, T., Mendez, M., King, A., van der Klis, M., & van Paradijs, J. 1997a, ApJ, 479, L145
- Belloni et al. (1997b) Belloni, T., Mendez, M., King, A., van der Klis, M., & van Paradijs, J., 1997b, ApJ, 488, 109
- Bloom et al. (2011) Bloom, J.S., Giannios, D., Metzger, B.D., et al., 2011, Science, 333, 203
- Bower et al. (2013) Bower, G.C., Metzger, B.D., Cenko, B.S., Silverman, J.M., & Bloom, J.S., 2013, ApJ, 763, 84
- Brandt et al. (1995) Brandt, W.N., Pounds, K.A., & Fink, H., 1995, MNRAS, 273, L47
- Burrows et al. (2011) Burrows, D.N., Kennea, J.A., Ghisellini, G., et al., 2011, Nature, 476, 203
- Campana et al. (2015) Campana, S., Mainetti, D., Colpi, M., Lodato, G, D’Avanzo, P., Evans, P.A., & Moretti, A., 2015, A&A, submitted, ArXiv:1502.07184v1
- Cannizzo (1996) Cannizzo, J. 1996, ApJ, 466, L31
- Cash (1979) Cash, W., 1979, ApJ, 228, 939
- Chen et al. (2009) Chen, X., Madau, P., Sesana, A., & Liu, F.K., 2009, ApJ, 697, L149
- Drake et al. (2009) Drake, A.J., Djorgovski, S,G., Mahabal, A., et al., 2009, ApJ, 696, 870
- Gehrels et al. (2004) Gehrels, N., et al., 2004, ApJ, 611, 1005
- Grupe et al. (1995) Grupe D., Beuermann K., Mannheim K., et al., 1995, A&A, 299, L5
- Grupe et al. (1999) Grupe, D., Thomas, H.-C., & Leighly, K.M., 1999, A&A, 350, L31
- Grupe et al. (2001) Grupe, D., Thomas, H.-C., & Beuermann, K., 2001, A&A, 367, 470
- Grupe et al. (2013) Grupe, D., Komossa, S., Scharwächter, J., Dietrich, M., Leighly, K.M., Lucy, A., & Barlow B.N., 2013, AJ, 146, 78
- Janiuk & Czerny (2005) Janiuk A., & Czerny B., 2005, MNRAS, 356, 205
- Komossa (2012) Komossa, S., 2012, EPJ Web of Conf., 39, 02001
- Komossa & Bade (1999) Komossa, S., & Bade, N., 1999, A&A, 343, 775
- Komossa & Greiner (1999) Komossa, S., & Greiner, J., 1999, A&A, 349, 45
- Komossa & Merritt (2008) Komossa, S., & Merritt, D. 2008, ApJ, 683, L21
- Komossa et al. (2008) Komossa, S., Zhou, H., Wang, T., et al., 2008, ApJ, 678, L13
- Komossa et al. (2015) Komossa, S., Grupe, D., Saxton, R., & Gallo, L.C., 2015, PoS(Swift 10), submitted, arXiv:1502.06946
- Kraft et al. (1991) Kraft, R.P., Burrows, D.N., & Nousek, J.A., 1991, ApJ, 374, 344
- Lightman & Eardley (1974) Lightman, A. P., & Eardley, D. M. 1974, ApJ, 187, L1
- Liu et al. (2014) Liu, F.K., Li, S., & Komossa, S. 2014, ApJ, 786, 103
- Marconi & Hunt (2003) Marconi, A., & Hunt, L., 2003, ApJ, 589, L21
- Nelson (2000) Nelson, C.H., 2000, ApJ, 544, 91
- Nayakshin, et al. (2000) Nayakshin, S., Rappaport, S.,& Melia, F., 2000, ApJ, 535, 798
- Pahari et al. (2013) Pahari, M., Misra, R., Mukherjee, A., Yadav, J., & Pandey, S., 2013, MNRAS, 436, 2334
- Peterson et al. (2004) Peterson, B.M., Ferrarese, L., Gilbert, K.M., et al., 2004, ApJ, 613, 682
- Peterson (1997) Peterson, B.M., 1997, An Introduction to Active Galactic Nuclei, Cambridge University Press, Cambridge, UK.
- Rees (1988) Rees, M.J., 1988, Nature, 333, 523
- Roming et al. (2009) Roming, P.W.A., Koch, T.S., Oates, S.R., et al., 2009, ApJ, 690, 163
- Sani et al. (2010) Sani, E., Lutz, D., Risaliti, G, et al., 2010, MNRAS, 403, 1246
- Saxton et al. (2008) Saxton, R., Read, A.M., Esquej, P., Freyberg, M.J., Altieri, B., & Bermejo, D., 2008, A&A, 480, 611
- Saxton et al. (2015) Saxton, R. et al. 2015, A&A, submitted
- Schlegel et al. (1998) Schlegel, D. J., Finkbeiner, D. P., & Davis, M. 1998, ApJ, 500, 525
- Sillanpää et al. (1988) Sillanpää, A., et al. 1988, ApJ, 325, 628
- Simard et al. (2011) Simard, L., Trevis-Mendel, J., Patton, D.R., Ellison, S.L, & McConnachie, A.W, 2011, ApJS, 196, 11
- Stone & Loeb (2011) Stone, N., & Loeb, A. 2011, MNRAS, 412, 75
- Tanaka (2013) Tanaka, T.L. 2013, MNRAS, 434, 2275
- Tremaine et al. (2002) Tremaine, S., Gebhardt, K., Bender, R., et al., 2002, ApJ, 574, 740
- Vaughan et al. (2004) Vaughan, S., Edelson, R., & Warwick, R.S., 2004, MNRAS, 349, L1
- Valtonen et al. (2008) Valtonen, M., Lehto, H.J., Nilsson, K., et al. 2008, Nature, 452, 851
- Wright (2006) Wright, E.L., 2006, PASP, 118, 1711
- York et al. (2000) York, D.G., Adelman, J., Anderson, J.E., et al., 2000, AJ, 120, 1579
| 11Start times are given in UT | MJD | 22Observed 0.3-10 keV flux in units of W m-2. Fluxes from the observations of 2013 and 2015 were based on an energy conversion factor derived from the 2010-05-17 data and the uncertainties were determined using the method described in Kraft et al. (1991). Upper limits are 3 as described in Kraft et al. (1991). | 33The reddening corrected fluxes in the UVOT filters are given in units of W m-2. | 33The reddening corrected fluxes in the UVOT filters are given in units of W m-2. | 33The reddening corrected fluxes in the UVOT filters are given in units of W m-2. | 33The reddening corrected fluxes in the UVOT filters are given in units of W m-2. | 33The reddening corrected fluxes in the UVOT filters are given in units of W m-2. | 33The reddening corrected fluxes in the UVOT filters are given in units of W m-2. |
|---|---|---|---|---|---|---|---|---|
| 2010-02-25 07:46 | 55252.365 | (9.26 | 8.190.40 | 6.720.33 | 5.640.34 | 4.730.40 | 4.630.28 | 4.100.35 |
| 2010-05-17 00:58 | 55333.049 | (4.770.82) | 7.390.46 | 6.110.33 | 5.010.37 | 4.170.43 | 4.390.31 | 3.950.35 |
| 2013-10-30 00:34 | 56595.160 | (1.05 | 4.670.27 | 3.850.20 | 2.040.15 | 1.540.14 | 1.260.10 | 1.310.11 |
| 2013-11-06 02:24 | 56602.208 | (1.01 | 1.260.07 | |||||
| 2014-03-26 07:50 | 56742.583 | (7.12 | 4.940.39 | 4.110.27 | 2.240.20 | 1.560.18 | 1.440.09 | 1.360.14 |
| 2014-08-08 07:07 | 56877.306 | 4.910.37 | 4.000.25 | 2.210.19 | 1.730.18 | 1.470.14 | 1.330.13 | |
| 2014-11-15 04:12 | 56976.188 | (1.51 | 5.030.42 | 4.020.28 | 2.030.12 | 1.380.16 | 1.140.13 | 1.200.13 |
| 2014-11-23 08:57 | 56984.375 | 2.100.15 | ||||||
| 2015-03-29 21:37 | 57110.969 | (4.7 | 4.840.28 | 3.750.21 | 2.020.15 | 1.320.13 | 1.200.10 | 1.080.10 |