Membrane-Mediated Repulsion between Gramicidin Pores
Abstract
We investigated the X-ray scattering signal of highly aligned multilayers of the zwitterionic lipid 1,2-dilauroyl-sn-glycero-3-phosphatidylcholine containing pores formed by the antimicrobial peptide gramicidin as a function of the peptide/lipid ratio. We are able to obtain information on the structure factor of the pore fluid, which then yields the interaction potential between pores in the plane of the bilayers. Aside from a hard core with a radius close to the geometric radius of the pore, we find a repulsive exponential lipid-mediated interaction with a decay length of 2.5 Å and an amplitude that decreases with the pore concentration, in agreement with the hydrophobic matching hypothesis. In dilute systems, the contact value of this interaction is about . Similar results are obtained for gramicidin pores inserted within bilayers formed by the nonionic surfactant pentaethylene glycol monododecyl ether.
keywords:
Gramicidin , Small-angle x-ray scattering , In-plane interaction , Hydrophobic mismatchPACS:
61.05.cf , 87.16.dt , 87.15.kt1 Introduction
In the last decades, much effort has been dedicated to the understanding of biological membranes, in particular to the interaction between membrane proteins and the host lipid bilayer. While the fluid mosaic model [1] described the proteins as free to diffuse in this environment, it was perceived very early on [2] that, far from being a neutral background, the lipid bilayer can influence protein organization in the plane of the membrane and hence many aspects of their activity (such as cell signaling and membrane trafficking). In particular, cholesterol content was recognized as an important variable. For instance, it was put forward as a regulating parameter for protein partitioning between the plasma membrane and the Golgi complex [3]. More generally, the homogeneity of cholesterol-containing membranes and the biological relevance of the so-called lipid rafts [4] has been the subject of extensive research [5].
Interestingly enough, the mechanisms involved in protein-lipid interaction and in the resulting protein-protein interaction mediated by the lipid membrane are non-specific, in that no chemical bond is formed between a protein and a small number of definite lipid molecules. Thus, a detailed understanding and a quantitative characterization of the interaction between lipids and proteins in membranes require that one considers the membrane as a many-particle system whose properties are collectively determined by the assembly and not only by the chemical properties of the individual lipids and proteins [6]. This justifies the hope that –notwithstanding the complexity of the system– the concepts developed in soft matter physics for the understanding of self-assembled systems are operative in this context and that ’simplified’ models can yield valuable information. For this reason, a considerable body of work dealing with the theoretical modelling and numerical simulation of protein-lipid systems appeared in the last decades, see [7] for a recent review. These efforts are either continuum-elasticity theories or more detailed models taking into account the molecular structure of the lipid bilayer.
However, very few experiments attempted to determine directly the interaction forces between membrane inclusions. First among them, freeze-fracture electron microscopy (FFEM) studies [8, 9, 10, 11] yielded the radial distribution function of the inclusions. Comparing the data to liquid state theories [12, 13, 14] resulted in a hard-core model with, in some cases, an additional repulsive or attractive interaction. FFEM was not extensively used, undoubtedly due to the inherent experimental difficulties; moreover, it is not obvious that the distribution measured in the frozen sample is identical to that at thermal equilibrium.
The interaction of membrane inclusions can also be studied using small-angle neutron or X-ray scattering from oriented samples, as demonstrated by Huang and collaborators [15, 16, 17]. One can thus measure the structure factor of the two-dimensional system formed by the inclusions in the membrane. Further analysis gives access to the interaction potential of the inclusions. In our experience, this method is more reliable when several measurements are performed along a dilution line (varying density of inclusions) and the results are treated simultaneously. As an application, we could measure a repulsive interaction both for alamethicin pores in DMPC membranes [18] and for inorganic particles in synthetic membranes [19].
In this paper, we study pores formed by the antimicrobial peptide gramicidin D in bilayers with different compositions. Simultaneously fitting the two-dimensional structure factor of the pores in the plane of the membrane yields the interaction potential between the pores.
2 Materials and Methods
2.1 Sample preparation and environment
The lipid 1,2-dilauroyl-sn-glycero-3-phosphatidylcholine (DLPC) was purchased from Avanti Polar Lipids Inc. (Birmingham, AL, USA). The antimicrobial peptide gramicidin D and the zwitterionic surfactant N,N-dimethyldodecylamine-N-oxide (DDAO) were bought from Sigma Aldrich. The nonionic surfactant pentaethylene glycol monododecyl ether (C12EO5) was bought from Nikko Chemical Ltd. (Japan). Without further purification, the products were dissolved in isopropanol. The stock solutions were then mixed to give the desired molar peptide/lipid ratio . The resulting solutions were then dried in vacuum and hydrated in excess water (DLPC phases) or up to a water content of 20 wt% (DDAO and C12EO5).
The samples were prepared in flat glass capillaries (VitroCom Inc., Mt. Lks, NJ, USA), 100 m thick and 2 mm wide by gently sucking in the lamellar phase using a syringe. The capillaries were flame-sealed. Areas aligned in homeotropic alignment (lamellae parallel to the flat faces of the capillary) formed slowly (over a few months, at room temperature) in DLPC phases. Samples of DDAO and C12EO5 were aligned by thermal cycling between the lamellar and isotropic phases, at cooling rates of about .
2.2 Measurement
The SAXS measurements were performed at the bending magnet beamline BM02 (D2AM) of the European Synchrotron Radiation Facility (ESRF, Grenoble, France). The photon energy was set at 11 keV. See reference [20] for more details.
The data was acquired using a Peltier-cooled CCD camera (SCX90-1300, from Princeton Instruments Inc., NJ, USA) with a resolution of pixels. Data preprocessing (dark current subtraction, flat field correction, radial regrouping and normalization) was performed using the bm2img software developed at the beamline.
The incident beam was perpendicular to the flat face of the capillary (parallel to the smectic director, which we take along the axis.) Thus, the scattering vector is mostly contained in the plane of the layers, and the measured scattered signal probes inhomogeneities of the electron density in this plane. Since the bilayers form a two-dimensional liquid, the scattering pattern exhibits azimuthal symmetry: . The capillaries were scanned in the beam to find well-aligned domains (where the intensity of the residual Bragg reflections was as low as possible.)
2.3 Analysis
The gramicidin pores are dispersed in the lamellar phase matrix. Since the “pure” lamellar phase gives a signal confined to the vicinity of the Bragg peaks, from the Babinet principle it ensues that the off-axis scattering is the same as for a system where the density profile of the lamellar phase is subtracted, and one is left with fictitious “pore minus bilayer” objects in a completely transparent medium. Furthermore, as the pores represent a collection of identical and similarly oriented objects (up to an azimuthal averaging), the classical separation of the scattering intensity in a structure factor multiplied by a form factor can be applied [21], yielding: , with:
| (1) |
where is the number of objects and object “0” is taken as the origin of the coordinates. If there is no in-plane ordering, only depends on the absolute value of the in-plane scattering vector .
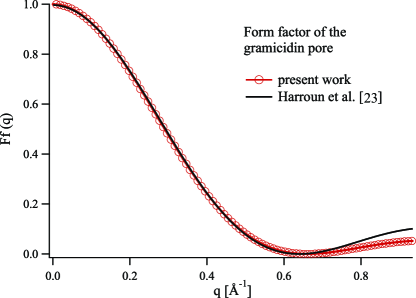
The form factor is the squared modulus of the Fourier transform of the electron density of the scattering object. We computed it from the atomic coordinates of the starting structure used in the molecular dynamics (MD) simulation of [22], projected onto the plane. The main feature of the density profile is the increased electron density at the position of the backbone, which we fitted by a radial Gaussian profile, with a peak radius and a width . The resulting from factor (Figure 1) is very close to that obtained by [23] from the MD simulations of [24].
The intensity is divided by the form factor to yield the two-dimensional structure factor of the fluid formed by the pores in the plane of the membrane (Figure 2.) The uncertainty in the intensity is estimated from the spread of the values recorded by the different pixels with the same value. We use standard error propagation through the background subtraction and form factor division steps to estimate the uncertainty in the structure factor values.
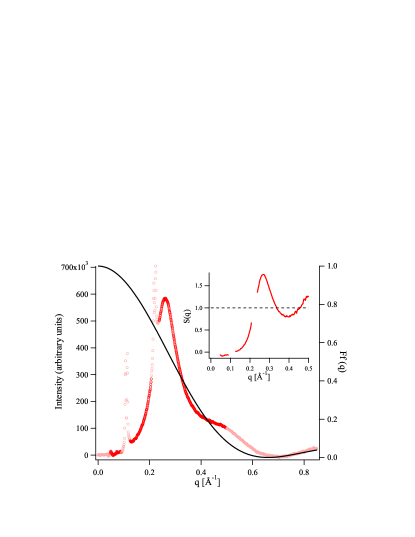
The sample alignment is not perfect and sometimes residual lamellar peaks persist, as seen in Figure 2. The points around these positions are discarded (light symbols in the curve and gaps in the curve.) We also discard the points at low -values (in the shade of the beamstop) and those above , where a systematic discrepancy between the experimental data and the model form factor leads to an artificial oscillation of the structure factor. In spite of these limitations, the first peak of the structure factor is properly measured for all samples.
3 Results and Discussion
The structure factor curves are plotted as open dots in Figure 3 a) for all values, indicated alongside the curves. The uncertainty bars are shown for all data points (they are generally smaller than the symbol size.) In the following, we will make the simplifying assumption that there is no interaction between the pores along (from one bilayer to the next), a result obtained by [17] for gramicidin pores in fully hydrated bilayers. This feature is extremely important for two reasons: first of all, it allows us to use a two-dimensional model, only dealing with the interaction within a bilayer; second, it ensures the biological relevance of this study.
3.1 Hard disk model
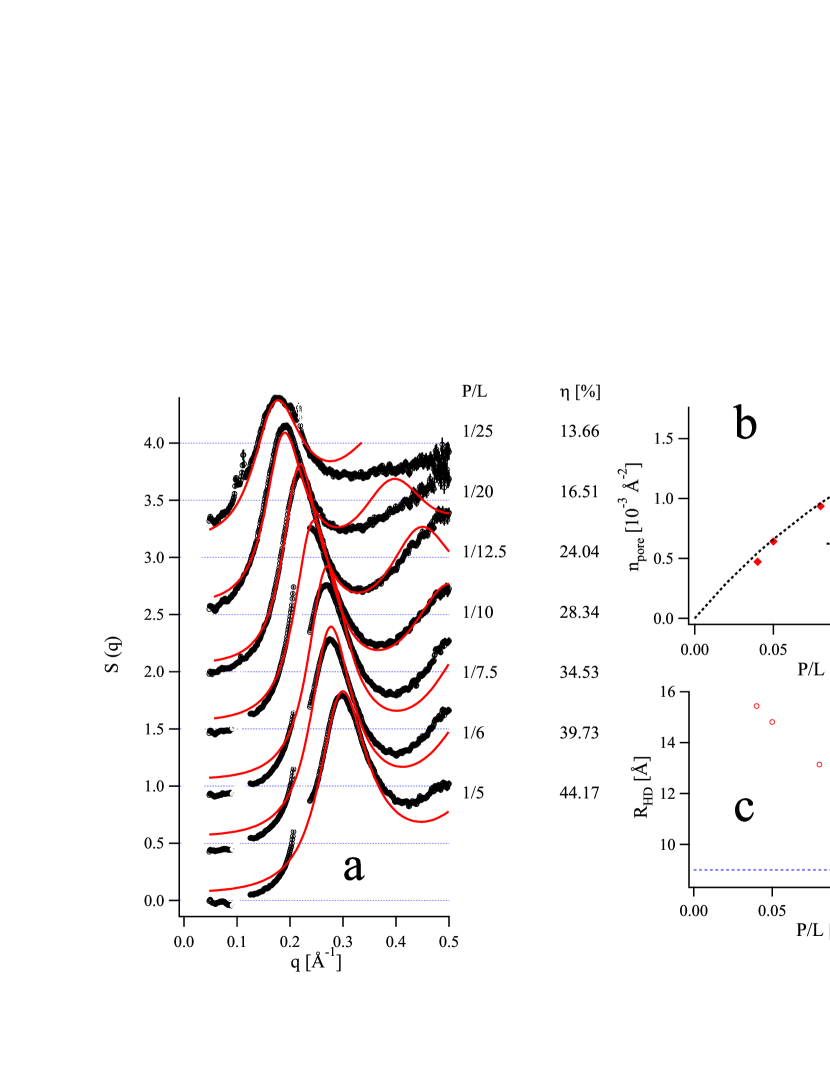
The simplest model for the interaction of gramicidin pores in membranes is that of hard disks confined in the plane. Such an analysis was already performed by [23] for gramicidin in DLPC bilayers at . As a first step, we analysed all the curves using the two-dimensional structure factor , given by the simple analytical expression obtained by [25] (see Eq. 6.8) using the “fundamental measure” approach. The details are shown in Figure 3 for the gramicidin/DLPC system: panel a) displays the data and fits, while panels b) and c) show the evolution with of the fit parameters, namely the number density of the pores and the effective hard-disk radius . Both parameters vary freely during the fit.
A first observation is that the pore density (symbols in Figure 3 b) is in very good agreement with the theoretical value calculated using the molar ratio and published data for the area per lipid/surfactant molecule and gramicidin pore. A similar agreement is obtained for the two other systems: gramicidin/C12EO5 and gramicidin/DDAO (data not shown).
The second fit parameter, the effective hard disk radius is shown as a function of in Figure 3 c) and as a function of the pore density and the area fraction (with the area of a gramicidin pore) in Figure 4. For comparison, we also plot the data point of [23] (open square). From the analysis of the structure factor for Gram/DLPC at , these authors obtain a hard-disk radius of 13.4 Å, which they interpret as the geometric radius of the pore plus one lipid layer. This value is somewhat higher, but still compatible with our data111This discrepancy might stem from the slightly different way of obtaining the interaction radius. Harroun et al. [23] determine the most probable nearest-neighbor separation between two pores, always larger than twice the hard-disk radius, which is the minimum separation..
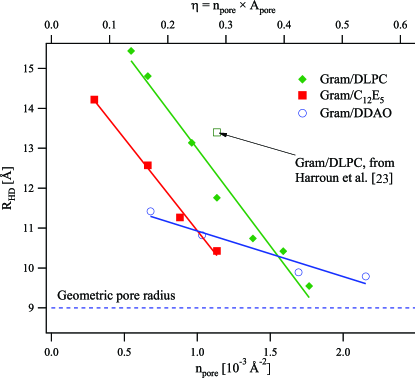
In Figure 4, we also show the fit results for the two other systems. For all three membrane compositions, the effective radius decreases as a function of (although this decrease is less marked for gramicidin/DDAO.) Clearly, the hard disk model is not satisfactory: although it fits very well the individual curves, the interaction radius decreases as (and hence ) increase; as already discussed for the case of alamethicin pores [18], this is a sign of an additional “soft” repulsive interaction. Briefly, this effect can be understood as follows: at low density, this interaction is enough to keep the particles far from each other. As the density increases so does the pressure, and the particles are eventually pushed closer and closer to each other. At high concentration, the effective radius should saturate at the (impenetrable) “true” core value. This seems indeed to be the case for the data in Figure 4, where at increasing density the curves approach the geometric core radius of 9 Å.
3.2 Additional interaction
To quantify this tendency, we calculated the structure factors for a hard core with radius and an additional “soft” potential:
| (2) |
where denotes the distance between the pore centres.
The structure factor is now a function of four parameters: the hard core radius , the number density , as well as the amplitude and the decay length of the additional component. We calculate using the method of Lado [26, 27], implemented as an Igor Pro function222The source code is available from the author upon request.. Briefly, the method provides an iterative solution to the Ornstein-Zernicke equation with the Percus-Yevick closure. The accuracy of the procedure was tested by comparing the results for purely hard-core systems to the analytical formula of Rosenfeld [25].
The effect of the additional potential on is illustrated in Figure 5, displaying the position of the first maximum in the structure factor as a function of pore density for the Gram/DLPC system, as well as for simulated structure factors with a hard core (the geometric core radius of the pore) and an additional component (Equation 2) with a decay length and various amplitudes (positive and negative).
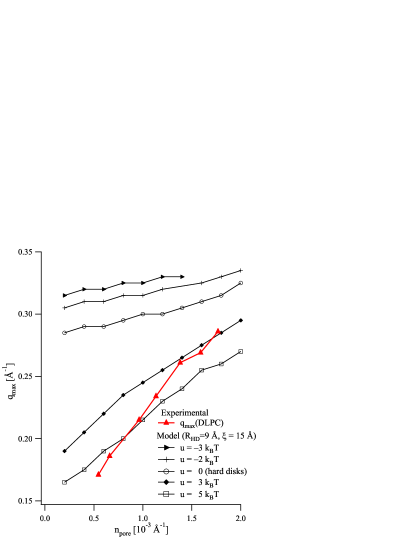
The first observation is that, for a purely hard-core interaction, the position of the maximum in varies very little with the concentration. Adding an attractive potential only shifts the peak to higher values (the pores are on the average closer to their neighbours) without changing its slope. When the potential is repulsive , on the other hand, the maximum shifts to lower values and its density dependence becomes steeper, although not enough to describe the variation of the experimental data, even when the parameters and are allowed to vary within reasonable limits. A preliminary conclusion would thus be that the interaction potential contains a “soft” repulsive contribution, induced by the membrane, which varies with the density.
To check this conclusion, we made extensive attempts to fit the data to a hard-core model plus an additional interaction (Equation 2), where is the same for all curves, and is fixed at the theoretically expected value, given by the dotted line in Figure 3, while and are allowed to vary freely. Alternative functional forms for the additional interaction (exponential and linear) were also tested. None of these attempts yielded satisfactory results; in particular, parameter combinations that capture the density dependence of the peak position also give a marked variation in its width and amplitude, in contrast with the experimental data in Figure 3 a), where the shape of the peak changes very little as varies by a factor of five.
3.3 Possible origins for the interaction
To see why and in what manner the membrane-mediated interaction should vary with the pore density, we must first consider the effect of inclusions on the membrane. Two such effects are relevant in this context. The first one is related to changes in the membrane thickness and occurs on a “mesoscopic” scale, affording a continuum elasticity treatment. The second effect concerns the way in which a membrane inclusion perturbs the configuration of the lipid chains and requires a more involved, microscopic description.
3.3.1 Hydrophobic matching
One of the simplest (and surprisingly successful) concepts used to interpret protein-membrane interaction is that of hydrophobic matching [28, 29], stating that proteins with a certain hydrophobic length (defined by their transmembrane domain) are targeted to membranes with a matching hydrophobic thickness. When there is a difference in length between the hydrophobic part of the protein or peptide and that of the host membrane (referred to as the “hydrophobic mismatch”), the bilayer deforms and adapts to the protein (which is generally much more rigid). This deformation has a certain lateral extension (in the plane of the membrane) and therefore induces an interaction between inclusions when the latter are closer than this distance.
The hydrophobic length of gramicidin was estimated at [30]. For DLPC, in the pure membrane and for a gramicidin content [23], confirming that thinner membranes are stretched by gramicidin. The same effect is observed in the gramicidin/DDAO system, where NMR measurements yield a hydrophobic thickness of 18.4 Å for the pure bilayer, increasing to 19.4 Å for the more concentrated samples () [31]. For , we estimate the hydrophobic thickness in the absence of gramicidin at ; we have no data on the variation of with the pore density.
To first order (and ignoring the effect of the spontaneous curvature of the monolayer, which can have non-trivial effects [32, 33]), the elastic energy is expected to scale as [34]. It will therefore decrease as the gramicidin concentration increases, and vanish when the hydrophobic thickness of the membrane equals that of the bilayer.
3.3.2 Changes in lipid ordering
On the other hand, even in the absence of hydrophobic mismatch, the presence of an inclusion restricts the configuration of lipid chains in its vicinity [35, 36, 37, 38]. For instance, Lagüe et al. [37, 39] used the lateral density-density response function of the hydrocarbon chains obtained from MD simulations of pure bilayers to determine the interaction between “smooth” hard cylinders embedded in the bilayer. They considered three values of the cylinder radius, up to 9 Å, which is precisely the geometric radius of the gramicidin pore. For the largest radius, the long-range interaction is repulsive for all the investigated lipids (DMPC, DPPC, POPC, DOPC), with an additional short-range attraction in the case of DMPC. However, no specific predictions are available for DLPC. Furthermore, it is not clear how the interaction varies as a function of inclusion concentration.
3.4 Complete model
In the following, we adopt the hydrophobic matching model and assume that the mismatch varies linearly with the in-plane concentration of pores over the investigated range (, or ) and vanishes at the highest value. We model this elastic interaction by an exponential333We also performed tests using different functional forms for the interaction potential, but the fits are less satisfactory (see the appendix).
| (3) |
where the free parameters are the prefactor , which is also the interaction amplitude at the lowest concentration , and the decay length , taken as independent of the concentration. No effort was made to include three-body interactions. Since the additional potential vanishes at the highest pore concentration, in the following we take as hard core radius the best fit at this value, namely 9.5 Å, rather than the geometric value of 9.0 Å. This adjustment is not very significant, but is required for coherence of the model and it ensures that the additional component is not overestimated.
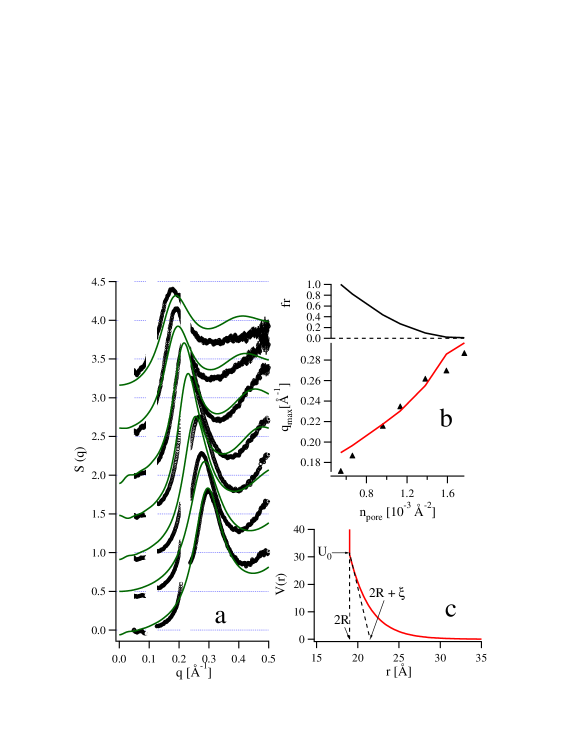
For the Gram/DLPC system, the best fit with this model is obtained for and . The details are given in Figure 6. See the Appendix A for details on the error estimate.
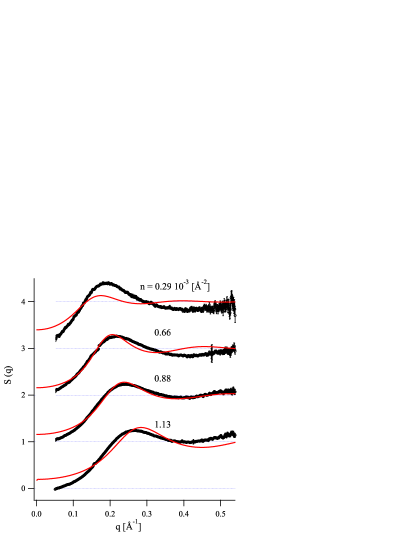
A similar result is obtained for the Gram/C12EO5 system: and (see Figure 7). As above, the mismatch is taken to vary linearly from a maximum at the lowest pore concentration to zero in the most concentrated sample.
For the Gram/DDAO system, fitting attempts point towards a much lower membrane-mediated interaction (both in amplitude and decay length), coherent with the low variation in effective hard disk radius (open dots in Figure 4.) Clearly, the interaction of the pores is closer to a pure hard-disk model than for the other bilayer compositions. However, a quantitative analysis is difficult in view of the low quality of the fits. Further experimental data is needed on this system.
4 Conclusion
We showed that the interaction between gramicidin pores inserted within DLPC bilayers can be well described by a hard disk potential, with a range close to the geometric diameter of the molecule and an additional repulsive interaction, whose amplitude decreases with increasing pore concentration. A similar result is obtained for pores inserted within C12EO5 bilayers.
The decrease of the interaction amplitude with pore concentration is consistent with the hydrophobic matching hypothesis, whereby the increase in bilayer thickness (well-documented for Gram/DLPC systems [23]) helps “accommodate” the peptide and leads to a decreased interaction. The decay length of the interaction is found to be of the order of 2.5 Å, well below the value predicted by continuum elastic models [32, 40] and close to the characteristic length given by more microscopic models [41]. However, considering that the amplitude of the interaction is quite high, the interaction range –defined intuitively as the distance over which the pores ‘see’ each other– does extend over several decay lengths; see Appendix B for a more detailed comparison.
An intriguing consequence of the interaction decreasing with the concentration of pores is that the structure factors of the two-dimensional fluid that they form in the plane of the membrane changes relatively little with the area density (as compared to e.g. purely hard-core interactions). One could say that the degree of “liquid order” remains sensibly the same. It is tempting to speculate on the biological significance of this feature. For instance, does the activity of gramicidin require a certain degree of correlation between pores? We hope that systematic studies of the interaction in various conditions will help answer this question.
Appendix A Data fitting
The first observation is that the (statistical) uncertainty in the structure factor , determined by radial regrouping, background subtracting and then dividing by the calculated form factor, is much too small. Clearly, the discrepancy between the fit functions and the data is mostly due to systematic effects, which can be related to errors in determining from the measured intensity or to the inadequacy of the fit functions. We therefore used a more realistic uncertainty value, taken as a constant for all data points. The goodness-of-fit function is then of the order of 2 (per data point.)
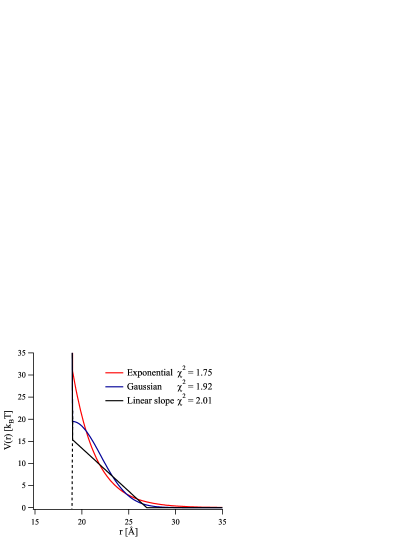
Several trial functions for the interaction potential were tested: exponential decrease, gaussian function and linear slope. The exponential model presented in Figure 6 yields the best fit. The best potentials obtained for each class of model are displayed in Figure 8. The respective values are indicated alongside the curves.
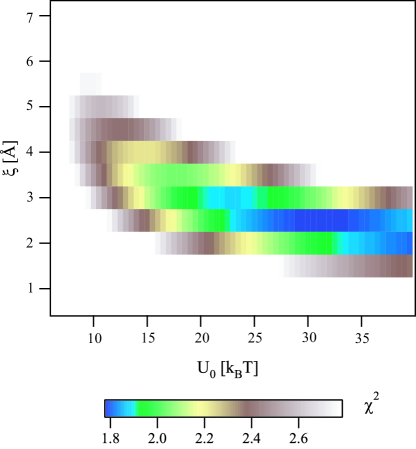
Once the fit is obtained, the confidence intervals should be determined for each parameter. For the exponential model, which yields the best fit, we computed for a wide range of parameters, to make sure that we have indeed found the global minimum and to visualise the dependence of on the parameters. This graph is plotted in Figure 9. Clearly, is within the range . On the other hand, the interaction amplitude is less well defined; we take the conservative estimate .
Appendix B Comparison of the interaction range
As mentioned in the Conclusion, is not entirely representative, since the interaction amplitude can remain significant over several decay lengths. This is an obstacle to comparing the different theoretical models between them and with the experimental data, unless they can be described by a common functional form. Another –less precise– option is to define an arbitrary cutoff amplitude and to define the interaction range as the separation beyond which the interaction falls below this cutoff. We did this for our model with two cutoff values, and , respectively. The resulting cutoff ranges are shown in Figure 10 (symbols and dotted lines). For reference, the decay length is also plotted as solid line.
In continuum elasticity models, the characteristic length is [40], with and the bending and compression moduli of the bilayer, respectively. These authors conclude that a characteristic length in the range (shown in Figure 10 as gray shading) accounts for the behaviour of gramicidin in DMPC bilayers. We also plotted as dashed line the characteristic length used by Aranda-Espinoza et al. [32] (corresponding to in their choice of parameters). Clearly, these values are much larger than our value for the decay length, , with between 3 and 5.
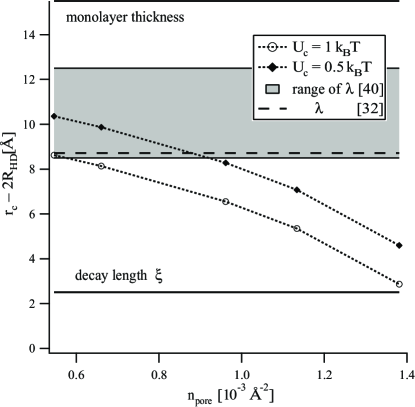
In order to compare the effective interaction range, one would need to estimate the cutoff ranges for the theoretical results. Although this data is not available in the publications, it appears that the interaction extends at least over the thickness of one monolayer (shown in Figure 10 as solid line), which is also quoted as the dominant scale length in reference [42]. This length scale is clearly larger than our estimates for the cutoff range, although the discrepancy is less marked than between and .
Acknowledgements
The ESRF is gratefully acknowledged for the provision of synchrotron radiation facilities (experiment 02-01-732) and we thank C. Rochas for competent and enthusiastic support. B. deGroot is acknowledged for providing the atomic coordinates of the gramicidin channel and an anonymous referee for suggesting the analysis in Appendix B.
References
- [1] S. J. Singer, G. L. Nicolson, The fluid mosaic model of the structure of cell membranes, Science 175 (1972) 720–31.
- [2] E. Sackmann, Physical basis for trigger processes and membrane structures, in: D. Chapman (Ed.), Biological Membranes, Vol. 5, Academic Press, London, 1984, pp. 105–143.
- [3] M. S. Bretscher, S. Munro, Cholesterol and the Golgi apparatus, Science 261 (1993) 1280–1281.
- [4] K. Simons, E. Ikonen, Functional rafts in cell membranes, Nature 387 (1997) 569–572.
- [5] K. Simons, D. Toomre, Lipid rafts and signal transduction, Nature Reviews Molec. Cell Biol. 1 (2000) 31–39.
- [6] M. Ø. Jensen, O. G. Mouritsen, Lipids do influence protein function–the hydrophobic matching hypothesis revisited., Biochim. Biophys. Acta-Biomembranes 1666 (2004) 205–226.
- [7] M. M. Sperotto, S. May, A. Baumgaertner, Modelling of proteins in membranes, Chem. Phys. Lipids 141 (2006) 2–29.
- [8] B. A. Lewis, D. M. Engelman, Bacteriorhodopsin remains dispersed in fluid phospholipid bilayers over a wide range of bilayer thicknesses, J. Mol. Biol. 166 (1983) 203–210.
- [9] Y. S. Chen, W. L. Hubbell, Temperature- and light-dependent structural changes in rhodopsin-lipid membranes, Exp. Eye Res 17 (1973) 517–532.
- [10] R. James, D. Branton, Lipid- and temperature-dependent structural changes in Acholeplasma laidlawii cell membranes, Biochim. Biophys. Acta 323 (1973) 378–390.
- [11] J. R. Abney, J. Braun, J. C. Owicki, Lateral interactions among membrane proteins: Implications for the organization of gap junctions, Biophys. J. 52 (1987) 441–454.
- [12] L. T. Pearson, B. A. Lewis, D. M. Engelman, S. I. Chan, Pair distribution functions of bacteriorhodopsin and rhodopsin in model bilayers, Biophys. J. 43 (1983) 167–174.
- [13] L. T. Pearson, J. Edelman, S. I. Chan, Statistical mechanics of lipid membranes, protein correlation functions and lipid ordering, Biophys. J. 45 (1984) 863–871.
- [14] J. Braun, J. R. Abney, J. C. Owicki, Lateral interactions among membrane proteins: Valid estimates based on freeze-fracture electron microscopy, Biophys. J. 52 (1987) 427–439.
- [15] K. He, S. J. Ludtke, H. W. Huang, D. L. Worcester, Antimicrobial peptide pores in membranes detected by neutron in-plane scattering, Biochem. 34 (1995) 15614–15618.
- [16] K. He, S. J. Ludtke, D. L. Worcester, H. W. Huang, Neutron scattering in the plane of the membranes: Structure of alamethicin pores, Biophys. J. 70 (1996) 2659–2666.
- [17] L. Yang, T. Weiss, T. Harroun, W. Heller, H. Huang, Supramolecular structures of peptide assemblies in membranes by neutron off-plane scattering: Method of analysis, Biophys. J. 77 (1999) 2648–2656.
- [18] D. Constantin, G. Brotons, A. Jarre, C. Li, T. Salditt, Interaction of alamethicin pores in DMPC bilayers, Biophys. J. 92 (2007) 3978–3987.
- [19] D. Constantin, B. Pansu, M. Impéror, P. Davidson, F. Ribot, Repulsion between inorganic particles inserted within surfactant bilayers, Phys. Rev. Lett. 101 (2008) 098101.
- [20] J. P. Simon, S. Arnaud, F. Bley, J. F. Berar, B. Caillot, V. Comparat, E. Geissler, A. de Geyer, P. Jeantey, F. Livet, H. Okuda, A new small-angle x-ray scattering instrument on the French CRG beamline at the ESRF multiwavelength anomalous scattering/diffraction beamline (D2AM), J. Appl. Cryst. 30 (1997) 900–904.
- [21] P. M. Chaikin, T. C. Lubensky, Principles of Condensed Matter Physics, Cambridge University Press, Cambridge, 1995.
- [22] B. L. de Groot, D. P. Tieleman, P. Pohl, H. Grubmüller, Water permeation through gramicidin A: Desformylation and the double helix: A molecular dynamics study, Biophys. J. 82 (2002) 2934–2942.
- [23] T. A. Harroun, W. T. Heller, T. M. Weiss, L. Yang, H. W. Huang, Experimental evidence for hydrophobic matching and membrane-mediated interactions in lipid bilayers containing gramicidin, Biophys J. 76 (1999) 937–945.
- [24] T. B. Woolf, B. Roux, Structure, energetics, and dynamics of lipid-protein interactions: A molecular dynamics study of the gramicidin a channel in a dmpc bilayer, Proteins 24 (1996) 92–114.
- [25] Y. Rosenfeld, Free-energy model for the inhomogeneous hard-sphere fluid in dimensions: Structure factors for the hard-disk () mixtures in simple explicit form, Phys. Rev. A 42 (1990) 5978–5988.
- [26] F. Lado, Pressure-consistent integral equation for classical fluids: Hard-sphere solutions, J. Chem. Phys. 47 (1967) 4828–4833.
- [27] F. Lado, Equation of state of the hard-disk fluid from approximate integral equations, J. Chem. Phys. 49 (1968) 3092–3096.
- [28] O. G. Mouritsen, M. Bloom, Mattress model of lipid-protein interactions in membranes, Biophys. J. 46 (1984) 141–153.
- [29] J. Killian, Hydrophobic mismatch between proteins and lipids in membranes, Biochim. Biophys. Acta 1376 (1998) 401–416.
- [30] J. R. Elliott, D. Needham, J. P. Dilger, D. A. Haydon, The effects of bilayer thickness and tension on gramicidin single-channel lifetime, Biochim. Biophys. Acta 735 (1983) 95–103.
- [31] G. Orädd, G. Lindblom, G. Arvidson, K. Gunnarsson, Phase equilibria and molecular packing in the N,N-dimethyidodecylamine oxide/gramicidin D/water system studied by 2H nuclear magnetic resonance spectroscopy, Biophys. J. 68 (1995) 547–557.
- [32] H. Aranda-Espinoza, A. Berman, N. Dan, P. Pincus, S. Safran, Interaction between inclusions embedded in membranes, Biophys. J. 71 (1996) 648–656.
- [33] K. Bohinc, V. Kralj-Iglič, S. May, Interaction between two cylindrical inclusions in a symmetric lipid bilayer, J. Chem. Phys. 119 (2003) 7435–7444.
- [34] H. W. Huang, Deformation free energy of bilayer membrane and its effect on gramicidin channel lifetime, Biophys. J. 50 (1986) 1061–1070.
- [35] S. Marčelja, Lipid-mediated protein interaction in membranes, Biochim. Biophys. Acta 455 (1976) 1–7.
- [36] T. Sintes, A. Baumgärtner, Protein attraction in membranes induced by lipid fluctuations, Biophys. J. 73 (1997) 2251–2259.
- [37] P. Lagüe, M. J. Zuckermann, B. Roux, Lipid-mediated interactions between intrinsic membrane proteins: A theoretical study based on integral equations, Biophys. J. 79 (2000) 2867–2879.
- [38] S. May, A. Ben-Shaul, A molecular model for lipid-mediated interaction between proteins in membranes, Phys. Chem. Chem. Phys. 2 (2000) 4494–4502.
- [39] P. Lagüe, M. J. Zuckermann, B. Roux, Lipid-mediated interactions between intrinsic membrane proteins: Dependence on protein size and lipid composition, Biophys. J. 81 (2001) 276–284.
- [40] T. A. Harroun, W. T. Heller, T. M. Weiss, L. Yang, H. W. Huang, Theoretical analysis of hydrophobic matching and membrane-mediated interactions in lipid bilayers containing gramicidin, Biophys. J. 76 (1999) 3176–3185.
- [41] D. R. Fattal, A. Ben-Shaul, A molecular model for lipid-protein interaction in membranes: the role of hydrophobic mismatch, Biophys. J. 65 (1993) 1795–1809.
- [42] N. Dan, P. Pincus, S. Safran, Membrane-induced interactions between inclusions, Langmuir 9 (1993) 2768–2771.