Direct generation of genuine single-longitudinal-mode narrowband photon pairs
Abstract
The practical prospect of quantum communication and information processing relies on sophisticated single photon pairs which feature controllable waveform, narrow spectrum, excellent purity, fiber compatibility and miniaturized design. For practical realizations, stable, miniaturized, low-cost devices are required. Sources with one or some of above performances have been demonstrated already, but it is quite challenging to have a source with all of the described characteristics simultaneously. Here we report on an integrated single-longitudinal-mode non-degenerate narrowband photon pair source, which exhibits all requirements needed for quantum applications. The device is composed of a periodically poled Ti-indiffused lithium niobate waveguide with high reflective dielectric mirror coatings deposited on the waveguide end-faces. Photon pairs with wavelengths around 890 nm and 1320 nm are generated via type II phase-matched parametric down-conversion. Clustering in this dispersive cavity restricts the whole conversion spectrum to one single-longitudinal-mode in a single cluster yielding a narrow bandwidth of only 60 MHz. The high conversion efficiency in the waveguide, together with the spectral clustering in the doubly resonant waveguide, leads to a high brightness of pairs/(smWMHz). This source exhibits prominent single-longitudinal-mode purity and remarkable temporal shaping capability. Especially, due to temporal broadening, we can observe that the coherence time of the two-photon component of PDC state is actually longer than the one of the single photon states. The miniaturized monolithic design makes this source have various fiber communication applications.
1 Introduction
Quantum communication and information processing (QCIP)[1, 2] currently evolve from fundamental research towards real life applications. This process can be strongly fostered by the implementation of integrated optical devices offering miniaturized and potentially low-cost components for applications in quantum key distribution [1], long distance quantum communication [3], quantum repeaters [4], and quantum networks [5]. Moreover, compact and rugged integrated optical quantum circuits [6, 7, 8, 9, 10] with high functionality can efficiently replace bulky implementations to pave the way to practical applications.
In particular, quantum repeater architectures have been proposed [4, 11, 12] to overcome current limitations of long distance quantum communication due to transmission losses. These typically require spectrally narrowband two-color photon pairs for instance to address the absorption line of the storage medium in a quantum memory (QM) [13, 14, 15, 16, 17, 18] with one photon and transmit the second over a fiber network. Such QMs usually have their absorption in the visible or near infrared, i.e. far away from the telecommunication range. The corresponding bandwidths are typically in the range of MHz to GHz, depending on different storage regimes (like spin-wave storage in cold atomic ensembles, atomic-frequency-comb echoes in solid state and room-temperature storage ). Among the most promising materials for high-bandwidth QM’s are solid-state atomic ensembles, specifically rare-earth ion doped crystals or glasses [19, 20, 21, 22] and QM at room-temperature [23, 24].
A wide-spread method to generate photon pairs is parametric down conversion (PDC) [25]. In such a PDC process, a medium with nonlinearity splits a single pump photon into two photons of lower energy, named signal and idler, obeying energy conservation and phase matching. However, the loose phase-matching condition for both, bulk and waveguide sources, usually leads to a continuous broad bandwidth typically exceeding several 100 GHz and a mixed state in frequency. To overcome this bottle-neck, narrowband photon-pair sources are desired with an adapted bandwidth and a high spectral brightness.
One promising approach to generate such narrowband photon pairs is to use resonance enhancement of PDC within a cavity, also called optical parametric oscillator (OPO) far below the threshold [27, 28, 29, 30, 31, 32, 33, 34, 35, 36, 37, 38, 39, 40, 41, 42]. PDC is enhanced at the resonances of the cavity but inhibited at non-resonant frequencies. An overview over the most important resonant PDC sources published so far it given in Tab. 1. Despite an enormous progress – non-degenerate photon pairs with linewidths of about 2 MHz oscillating on 4 longitudinal modes – which was obtained in the bulk cavity [41], most of the bulk sources suffer from low pair production efficiency, degenerate frequency, bad mode selectivity and complicated cavity locking techniques.
To overcome these limitations strong benefits from a monolithic implementation of this scheme can be expected. Recently, a high Q cavity using a whispering gallery mode resonator has been demonstrated to achieve single-mode photon pairs [42]. An alternative approach using a periodically poled lithium niobate (PPLN) waveguide with dielectric mirrors deposited on its end-faces has been demonstrated to generate nearly degenerate photon-pairs via a type I phase-matched PDC process in the telecom region[36]. However, it exhibited a limited mode selectivity, because the spectrum consisted of a series of longitudinal modes due to the small difference of the free spectral ranges (FSRs) of signal and idler close to degeneracy. A detailed theoretical study [37] indicates that exploiting type II phase-matching should strongly limit the number of longitudinal modes because the large birefringence provides a larger difference of the FSRs, thus, fosters the spectral narrowing.
| PDC | Bao et al | Scholz et al | Chuu et al | Fekete et al | Ours |
| [30] | [31] | [39] | [41] | ||
| wavelength (nm) | 780 | 893 | 1064 | 606+1436 | 890+1320 |
| bandwidth (MHz) | 9.6 | 2.7 | 8.3 | 1.7 | 60 |
| brightness ( | 6 | 330 | 11 | ||
| mode selectivity | multi-mode | single-mode | – | several modes | single-mode |
| fiber compatibility | – | – | ✓ | ✓ | ✓ |
| atom interaction | Rb (MHz) | Cs (MHz) | – | Pr (MHz) | Nd ( 100 MHz) |
| cavity locking | single cavity | double cavity | no | double cavity | no |
The drawback of the resonant sources reported so far is that they either achieve narrow bandwidth, or operate single mode, or reach high brightness, or combine two wavelengths for atomic transition and fiber communications. However, for practical quantum application, sources which provide simultaneously all the above mentioned properties are required. In this paper, we present the experimental realization of such a miniaturized two-color integrated bright narrowband photon pair source based on a doubly resonant waveguide exploiting type II phase-matching exhibiting one longitudinal mode.
In the Sec.2 we will discuss in detail the principle of operation and the underlying physical theory. In the non-degenerate case, birefringence and material dispersion result in different FSRs for signal and idler. As maximum efficiency is only obtained if both signal and idler are resonant simultaneously, PDC is generated only in certain regions of the spectrum, so called ’clusters’ [43]. In this way the spectral density is redistributed in comparison to the non-resonant case and, thus, ideally a completely filter-free source with actively reduced bandwidth can be realized without sacrificing any photon flux level. In Sec.3 and Sec.4 details on the waveguide fabrication and the experimental set-up are given, respectively. The practical implementation is challenging because it requires loss minimization, short poling periods for phase-matching and specifically tailored mirror coatings for both signal and idler photons. In Sec.5 the experimental results are discussed and compared with the theoretically predicted ones. Our engineered clustering in the dispersive cavity restricts the conversion to a single longitudinal mode operation with a spectral linewidth around 60 MHz and high spectral brightness pairs/(smWMHz). Such a non-degenerate PDC photon pair source can be applied in a quantum repeater addressing a Nd-based QM with one photon and combining the other with a fiber network.
2 Principle and theory
2.1 Nonresonant PDC process
PDC is an important process in quantum optics, used especially as a source of entangled photon pairs and of single photons. In a nonlinear medium pump photons (at frequency ) are split into pairs of photons (signal and idler , respectively) obeying energy and momentum conservation. As for most cases the latter cannot be obtained in homogeneous crystals, quasi-phase-matching is exploited in a periodically inverted medium. Thus, the phase-matching condition becomes:
| (1) |
with are the propagation constants of the pump, signal and idler fields and is the poling period. We express the state of the photon pairs generated by PDC up to second order expansion,
where describes the photon creation operator at frequency and is the joint spectral function (JSF) of the nonlinear waveguide:
| (3) |
The describes the spectrum and amplitude of the pump field, is phase-matching function .
The full-width at half-maximum (FWHM) of the PDC process in the waveguide is determined by the phase-matching condition. Assuming a monochromatic pump, i.e. , can be linearized
| (4) |
where and are the group index of signal and idler, respectively. The spectral characteristics of the PDC process is given by a function. Thus, the FWHM of the signal photons generated in a waveguide of length is given by:
| (5) |
i.e. the spectral bandwidth is inversely proportional to the difference of the group velocities of signal and idler. Thus, close to degeneracy the bandwidth is very large, whereas group velocity dispersion in most cases leads to a much narrower bandwidth far away from degeneracy.
2.2 Resonant PDC
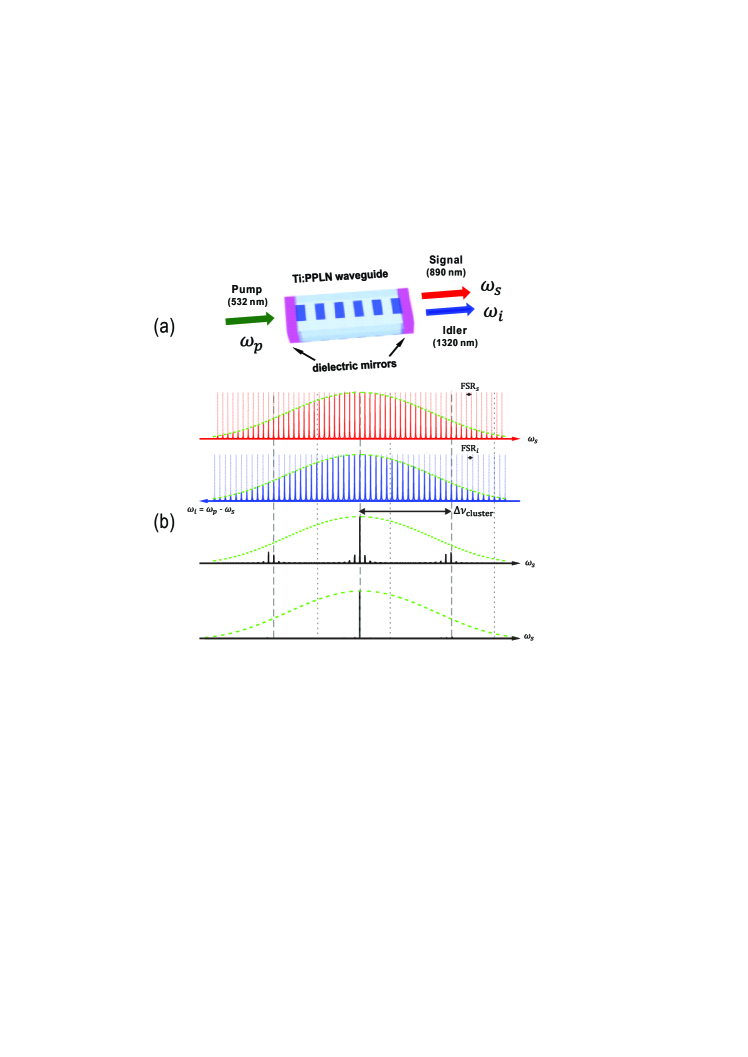
Our source exploits photon pair generation by PDC within a cavity. The schematic of the integrated source is shown in Fig. 1 (a). The resonant waveguide is a Fabry-Pérot cavity with asymmetric reflectivities ( and ), internal loss () and effective indexes for the fundamental modes at signal and idler wavelength, respectively. The photon pair state generated within such a resonator can be expressed by:
where is the cavity-modified JSF: , with being the conventional JSF for the nonresonant PDC. are proportional to the field distributions inside the cavity. They can easily be derived treating the device as a classical Fabry-Pérot resonator with internal loss:
| (7) |
Therefore, we obtain an expression for the resulting joint spectral intensity,
| (8) |
where are Airy functions of signal and idler photons, respectively. The bandwidth of each cavity mode is related to the finesse, more details in A. Therefore the spectral characteristics is a product of phase-matching sinc function and two combs of Lorentzian lines, spaced by the resonator’s FSRs.
The explicit form of signal spectrum can be determined completely as
2.3 Cluster effect
In the dispersive waveguide, cavity resonances occur at distinct frequencies separated by the free spectral range (FSR) of the resonator. These resonances form frequency combs spaced with respective FSRs in the signal and idler wavelength range (as shown in the Supplementary Movie).
| (10) |
The FSR is the inverse of the round-trip time of a photon in the cavity.
The FWHM of each resonance , , is related with the finesse of the cavity:
| (11) |
For the type I degenerate case, the frequency combs of signal and idler photons are identical. Thus, PDC generation still happens at all comb frequencies within the phase-matching bandwidth. However, for type II and/or degenerate case, there are different FSRs in the resonant waveguide due to the different group dispersions at the signal and idler wavelengths, as shown in the upper two curves in Fig. 1(b). Thus, corresponding resonances of signal and idler only overlap at a certain frequency, but adjacent modes do not coincide, as shown in the bottom curve in Fig. 1(b). For instance, if a pair is simultaneously resonant for e.g. and , the adjacent signal resonance lies at , and the corresponding idler frequency at is not in the resonance peak due to the different FSRs. The couple of simultaneous resonances for signal and idler is called a cluster [43, 37]. However, after a certain number of free spectral ranges, another cluster occurs again, if the phase-matching bandwidth is broad enough. This happens when times the signal FSR equals times the idler FSR. Thus, the cluster separation , i.e. the frequency spacing between clusters, is given by:
| (12) |
which is associated with the difference of the group indices. By comparing Eqs. (5) and (12), we can see that the cluster separation is slightly larger than half of the bandwidth of the PDC phase-matching envelope . Therefore, the maximum number of clusters within the phase-matching range is 3. Theoretically, if there is a dominant cluster in the center of the normalized phase-matching curve, two symmetric clusters will occur at the side wings of the envelope with about 41% weight. However, the fine mode structures inside clusters are determined by signal and idler resonances. As shown in Fig. 1(b), the intensity of PDC emission in the two side clusters is weaker than the central cluster. Within a single cluster, the number of resonances contributing to the PDC generation depends on the bandwidth of the resonances and the difference of FSRs.
Due to the spectral density redistribution in the cavity, PDC in the resonant waveguide is enhanced due to cavity narrowing and cluster effect. The enhancement factor is given by
| (13) |
where is the photon pair escape probability defined by the ratio of the number of photon pairs which leaves the the cavity to the number of pairs created inside the cavity. More details are discussed in B. Eq. (13) tells us that the higher the finesse of cavity is, the more enhancement can be achieved [27]. The enhancement factor is roughly proportional to the square of the finesse of the cavity.
However, for a waveguide based resonant PDC source the internal losses must be considered. (In bulk type sources, these might be neglected due to the much smaller losses in bulk crystals compared to waveguides.) The higher the finesse is, the larger the number of round-trips is. Thus, the probability that a created photon pair is lost within the cavity increases with increasing the finesse. Hence, decreases with increasing the finesse by higher mirror reflectivities keeping waveguide length and losses constant. On the other hand, the spectral redistribution due to the clustering results in a times increased spectral density at the synchronous signal and idler resonance.
2.4 Two-photon cross-correlation function
To verify the photon pairs generation and to evaluate its efficiency, the standard way is to measure the cross-correlation between two generated photons. The two-photon cross-correlation function between signal and idler photons defines the shape of the coincidence events. Each resonance of the frequency comb of signal and idler can reasonably well be approximated by a Lorentzian function , where describes the damping constants of cavity. Assuming only a single pair of signal and idler modes are synchronously resonant with narrowband range , we get the complex JSF
| (14) |
The temporal is measured as the coincidence distribution of detection time differences between the signal and idler photons,
| (15) |
where is the joint temporal function (JTF) defined as the inverse Fourier transform of the JSF. Thus, the signal-idler correlation can be simplified as
| (16) |
where is the step function. This shows that the coincidence funtion is determined by two different exponentially decaying functions, which are related to the damping of signal and idler photons, respectively. Thus, in most cases is asymmetric due to . The signal-idler correlation time is defined by . This means, we can identify the lifetime of signal/idler from the signal-idler coincidence measurements. Only if , which for instance is always the case if type I degenerate PDC process are exploited [36], one gets a symmetric cross-correlation with with correlation time .
2.5 Two-photon auto-correlation function
Besides the one photon pairs generated in the PDC process, it is still possible to generate double or higher photon pairs as shown in Eq. (2.2)). The temporal second-order auto-correlation function of signal and idler photons respectively, is related to the temporal coherence of the two-photon wave-packet component. The measurements of the auto-correlation is usually performed by inserting a 50:50 beam splitter into the signal (idler) arm and detecting the photons at the two output ports of the beam splitter with single photon detectors. If coincidence clicks are registered, a second (or higher) order photon pair generation must have happened. is defined by
| (17) | |||||
Thus, the normalized second-order auto-correlation function is given by
| (18) |
Consider a signal cavity mode with a Lorentzian spectral distribution,
| (19) |
the time-dependent correlation function is given by the inverse Fourier transform of its intensity spectrum,
Correspondingly, Eq. (18) can be deduced as
The above equation shows that the decay of the auto-correlation is not an exponential decay any more. For our further analysis, it is useful to estimate the shape and half width of the auto-correlation peak. By using a Taylor expansion, the above complicated function can be approximately simplified to
From Eq. (2.5), we can conclude that the auto-correlation peak is symmetric, no matter which kind of PDC process it produced. This shows an intrinsic difference to the behavior of the cross-correlation function with its asymmetrically exponential decays. The decay of auto-correlation can be approximated as a Cauchy–Lorentz distribution. We can define the auto-correlation time as the FWHM of the auto-correlation function and obtain
| (23) |
We find that the auto-correlation time exceeds the cross-correlation time by a factor of around 2.8. Our theoretical analysis is in good agreements with previous experimental observations [32, 40].
Another way of interpreting this auto-correlation is to consider the measurement from the multiple photon pair generation point of view. If two single photon detecdtors in the signal (or idler) arm register a coincidence click, the second (or higher) order part of the PDC state (second term in Eq. (2.2)) is probed. In contrast, the cross-correlation measurement provides mainly information about the first order part. The auto-correlation time is the correlation time between the two-photon components of signal (or idler) photon components, while the cross-correlation time is the correlation time between signal and idler photons. In the temporal domain, the auto-correlation time is larger than correlation time . Correspondingly, two photon components have narrower frequency bandwidth (related to ) than the one photon pair component (related to ).
2.6 Heralded correlation function
To confirm the nonclassical property of generated narrowband photons, it is important to characterize heralded photons. The conditional auto-correlation function is defined by [45]
| (24) |
where is the triple coincidence rate, and is the pair generation rate. After simplification, the function of interest, can be represented as
| (25) |
which means the heralded-correlation can be approximated by a Gaussian distribution. is the heralded time between one (signal or idler) photon component,
| (26) |
3 Waveguide resonator fabrication
To study experimentally such a resonant PDC source, a PPLN waveguide with dielectric coatings at its end faces was fabricated. It was designed to provide type II phase-matching for a PDC process with a TE-polarized pump at 532 nm for the generation of photon pairs at 890 nm (TE-polarized) and 1320 nm (TM-polarized).
3.1 Ti:PPLN waveguide
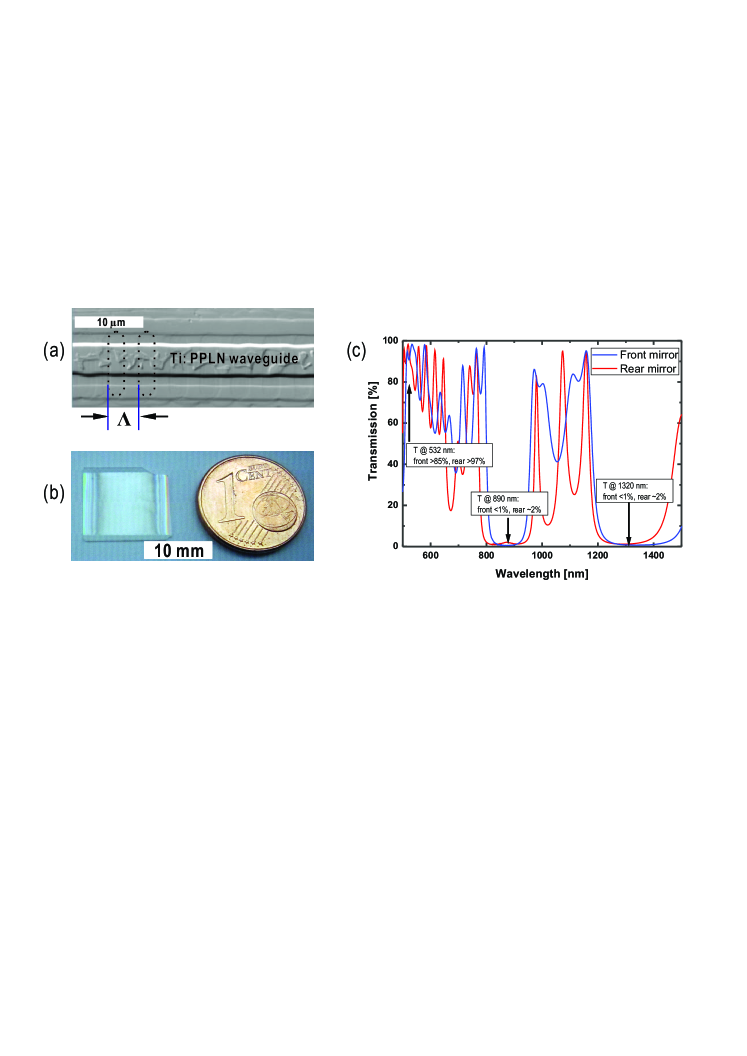
The waveguide was fabricated by an indiffusion of a lithographically patterned, 81 nm thick, 5 m wide Ti-stripe into the Z-cut LiNbO3 substrate. The diffusion parameters were designed to provide single mode guiding at the TM-polarized idler mode. At signal and pump wavelength, however, the waveguide supports several guided modes.
Subsequent to the Ti-indiffusion, the periodic poling was performed. To obtain first order phase-matching for the selected wavelength combination a short poling period of only m is required. This could be achieved using a field-assisted domain inversion of the lithographically defined poling pattern. In the final fabrication process the end-faces were polished. Special care was taken to ensure flatness and parallelism of the waveguide end-faces to avoid excess loss of the resonating waves at the multiple reflections at these interfaces.
3.2 Resonator
Based on the theoretical design rules discussed in the previous section and A, the resonator finesse should exceed 20 to provide the spectral narrowing. The detailed structure of the integrated waveguide chip and experimental setup to study this resonant source are shown in Fig. 2. The source consists of a 12.3 mm long Ti-indiffused waveguide in Z-cut PPLN and dielectric mirrors deposited on the waveguide end-faces.
To implement the resonant source, dielectric layers composed of alternating layers of SiO2 and TiO2 were deposited on the end-faces of the waveguide. In practice, a stack with 17 layers deposited as front mirror provides a reflectivity of for signal and idler wavelengths and the rear mirror consisting of 17 layers has the targeted for both. The reflectivities of front and rear mirrors at 532 nm are around 15 % and 13 %, respectively, to enable efficient incoupling of pump and to prevent triple resonance effects.
After mirror deposition, the resonator was characterized by measuring signal and idler decay times. As we discuss in B, we obtained a finesse of and for the signal and idler wavelengths, respectively.
With the asymmetry of the mirror reflectivities, the ratio of outcoupled signal (idler) photons to lost photons before escaping this cavity is about (), respectively. Thus, the overall photon pair escape probability is given as , which means about 5% of the generated photon pairs leave the cavity as couples at the desired output mirror. Therefore, the cavity-enhanced source provides high heralding efficiency.
The spatial profiles of signal and idler are determined by the waveguide properties. Both are the fundamental modes of the waveguide. Thus, the profiles are well matched for fiber network applications.
4 Experimental setup
The experimental setup to study this resonant source is shown in Fig. 3. The sample is pumped with a laser at 532 nm with a specified bandwidth of less than 1 MHz. To mitigate photorefraction, pump pulses with a typical length of about 200 ns and a repetition rate of about 100 kHz are extracted from the cw-source by using an acousto-optical modulator (AOM). A half wave plate (HWP) together with a polarizer enable pump peak power tuning from 0.1 mW to 10 mW. The sample is heated to temperatures around 160 ∘C to obtain quasi-phase-matching for the desired wavelength combination and to prevent luminescence and deterioration due to photorefraction. During the measurements the sample temperature is stabilized to about 1 mK. Coarse wavelength tuning can be accomplished by changing the poling period, while fine tuning of the resonance frequency is accomplished by varying the optical path length in the waveguide, for instance by temperature tuning.
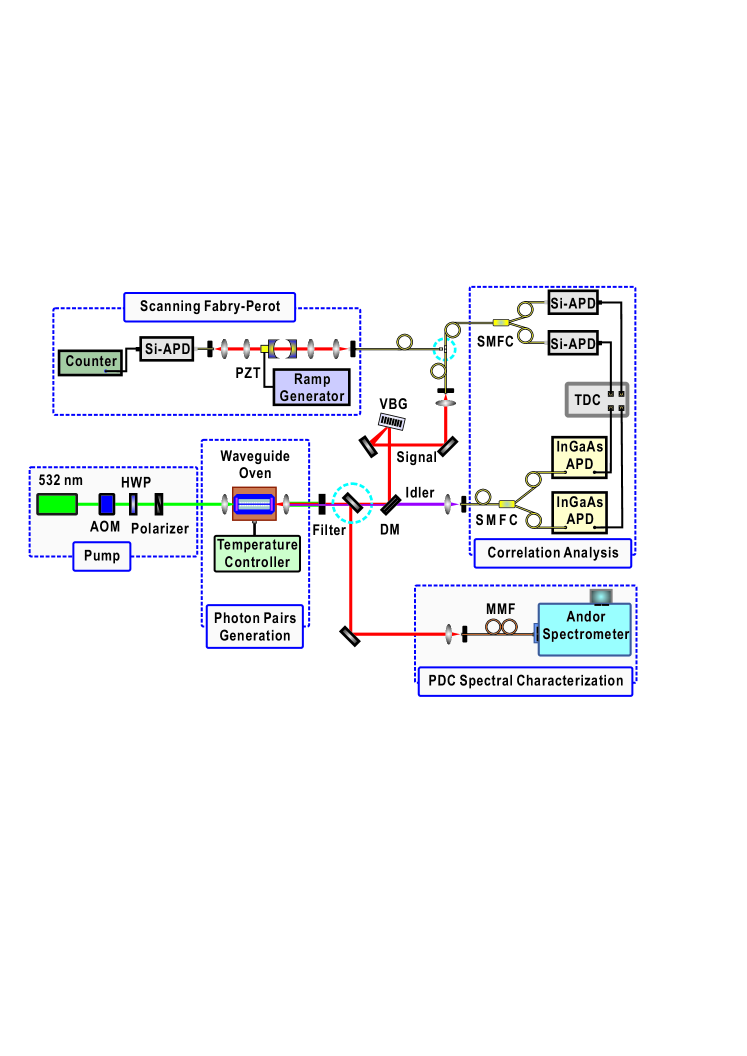
To characterize the generated PDC spectrum, the signal output from the waveguide is coupled to a spectrometer system (Andor Shamrock 303i with iKon-M 934 CCD camera) with a resolution of about 0.15 nm.
This measurement method provides a coarse overview over the spectral structure, but the resolution is still not sufficient to study details of the spectra within a single cluster. Thus, a volume Bragg grating (VBG, OptiGrate 900) with a spectral bandwidth of 0.17 nm is inserted into the signal beam path as shown in Fig. 3 to act as bandpass filter to select a single cluster. The filtered light is routed via a single mode fiber to a scanning confocal Fabry-Pérot resonator with 15 GHz FSR and a finesse of about 20. Its transmission is analyzed using an avalanche photodiode (APD, Perkin Elmer SPCM-AQR-14) to record the signal photons transmitted from the Fabry-Pérot which is tuned by applying a voltage ramp to the piezo-driven mirror mount.
To study correlations between photon pairs, coincidences between signal and idler were characterized by measuring the arrival times of the respective photons with the set-up shown in Fig. 3. The cross-correlation could be determined measuring coincidences between signal and idler photons by spectrally splitting the photon pair and routing them to separate single photon detectors (Perkin Elmer single photon APD for the signal and idQuantique InGaAs APD model id201 for the idler photons). The signal-signal autocorrelation were performed by splitting the signal radiation behind the VBG (i.e. a single cluster was selected) using a 50:50 single mode fiber coupler (SMFC) and routing the two SMFC’s output ports to individual silicon APDs. Similarly, there are two InGaAs APDs to catch unfiltered idler photons behind a SMFC.
5 Results and discussion

5.1 PDC clustering and cavity-enhanced spectra
PDC spectra of one waveguide recorded prior and after mirror deposition are shown in Fig. 4. The spectrum of the uncoated waveguide shows a main peak with a bandwidth (FWHM) of 0.4 nm ( 157 GHz), as predicted for the interaction length. The spectra of the same waveguide with dielectric mirrors, however, shows a pronounced sub-structure. Although the resolution of the spectrometer ( nm) is too coarse to reveal details of the spectra, one can already derive that the pair generation occurs within clusters with a cluster separation of about 0.24 nm ( 90 GHz). This separation is determined by the beating of the FSRs of signal and idler, which theoretically are FSR GHz and FSR GHz. Generally, there is one dominant cluster in the center of the normalized phase-matching curve, and another two symmetric clusters at the side wings of the envelope, as simulated in Fig. 1(b).
A comparison of the spectral measurements of the coated and uncoated sample proves already the enhancement of PDC generation in the cavity: If the cavity would only act as a comb filter, only a small fraction of the generated PDC spectrum would ’transmit’ through this filter. In this case we would have seen only a weak signal for the resonant PDC because the measured spectra are always convolutions of the real spectra with the spectral resolution, i.e. a window function of about 60 GHz ( nm) width. In the experiments, however, we observed in both cases spectra with similar intensity levels. For the measurements shown in Fig. 4 (a), all of the parameters, apart from adapting the temperature, have been kept constant. In particular, the pump power of about 1 mW in front of the incoupling lens has not been changed. Thus, we can conclude that due to the cavity there is a spectral density redistribution resulting in an enhanced PDC generation at the resonances.
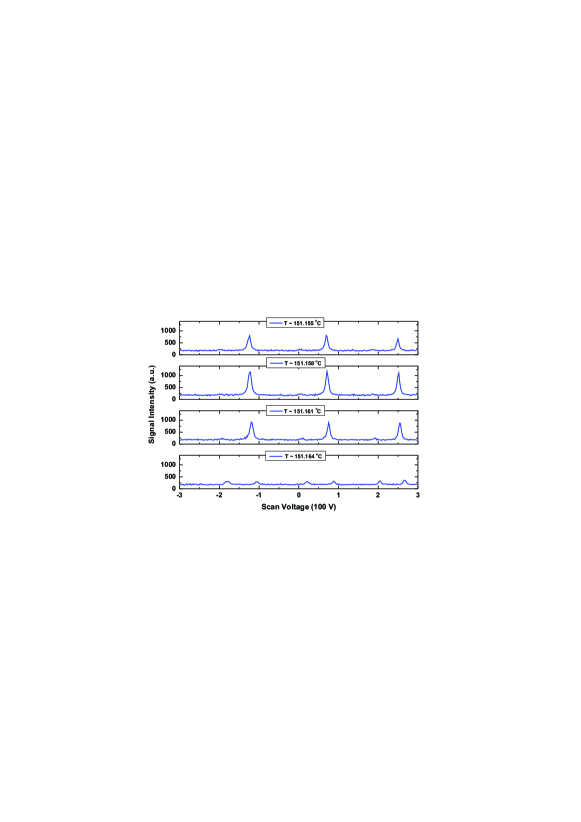
To study the spectral structure within a single cluster we performed measurements with the scanning Fabry-Pérot resonator. Measured single-photon level PDC spectra with 700 MHz resolution are shown in Fig. 4(b). They reveal the modal structure within a single cluster. The spectrum consists of only one longitudinal mode. The scanning range of 15 GHz covers around 3 FSR of the signal resonator. Please note that the measured linewidth of each longitudinal mode of about 700 MHz is mainly determined by the resolution of the scanning Fabry-Pérot, but it is not the natural bandwidth of the generated PDC photons.
The single-photon level PDC spectra with GHz resolution indicates that we are able to suppress the adjacent ’satellite’ modes to single mode operation by finely tuning the temperature – as shown in Fig. 5. A slight shift of the temperature leads to the spectrum composed of always one predominant mode. Only at certain temperature, weak two mode operation happens.
5.2 Cross-correlation
The temporal second-order signal-idler cross-correlation function [46] is measured as the coincidence counts between the signal and idler photons as function of the arrival time difference (more details were already discussed in 2.4).

To compare the experimental result with the theoretically expected behaviour we first simulated the cross-correlation function for the used resonator parameters assuming a truly single mode PDC generation as shown in Fig. 6(a). The presence of the cavity implies that signal and idler photons may be emitted at distinct times, corresponding to a different number of round-trips within the cavity. Thus, the shape of the coincidence curve should be determined by exponential functions. For the multi-mode case the distribution of time of emission differences between the signal and idler modes should show well defined peaks with the peak separation corresponding to the cavity round–trip time. However, in our experiment we could not resolve such oscillations due to the finite temporal resolution of our detection system of about 500 ps. The convoluted results concerning the resolution of detector system is a smooth exponential decay curve as well. Taking into account this limitation again by a convolution of the simulated curves, we find that the bandwidth of the coincidence peak is independent of the number of modes, and depends only on the bandwidth of each modes.
In the left diagram of Fig. 6(b), a result of such a coincidence measurement is shown. It reveals a correlation time (FWHM of the coincidence peak) of about 4.8 ns. This is significantly broader than the corresponding results obtained with non-resonant samples showing a width of about 0.5 ns, which is determined by the finite resolution of our measurement system. The correlation time is inversely proportional to the bandwidth of the down-conversion fields. From the measured correlation time of 4.8 ns, according to , where is the bandwidth of the down-converted photons, a spectral bandwidth of about 66 MHz can be deduced. This is in good accordance with the theoretically predicted width calculated for the given cavity parameters, as shown in Fig. 6(a). In the right diagram of Fig. 6(b) the measurement result is redrawn using a logarithmic scaling together with exponential fits for the rising and falling parts. The slight asymmetry reflects the different finesses of signal and idler resulting in slightly different leakage times out of the resonator. The different slopes of decay lines in logarithmic scaling give us the decay times of resonators.
Based on the coincidence data and B, the different lifetimes of signal and idler leaving out from the resonant waveguide are ns, and ns, respectively. Thus, the loss inside the waveguide cavity can be determined to be as low as dB/cm and dB/cm for signal and idler, respectively, as well as cavity finesses of and .
5.3 Brightness
The coincidence measurements can also be evaluated to determine the efficiency of the PDC generation process. From the ratio of the coincidence to single counts the generated photon pair rate can be determined. We found that this rate is almost equal for non-resonant and resonant waveguides. For our source we determined a normalized generation rate (inside the resonator) of about pairs/(smW). Assuming these are distributed over three inequivalent clusters with different weights, we can estimate that about 90% of the generated photon pairs are within the most dominant longitudinal mode with 66 MHz bandwidth. Taking into account the photon pair escape probability of 5 %, the spectral brightness can be estimated to be pairs/(smWMHz).
5.4 Auto-correlation
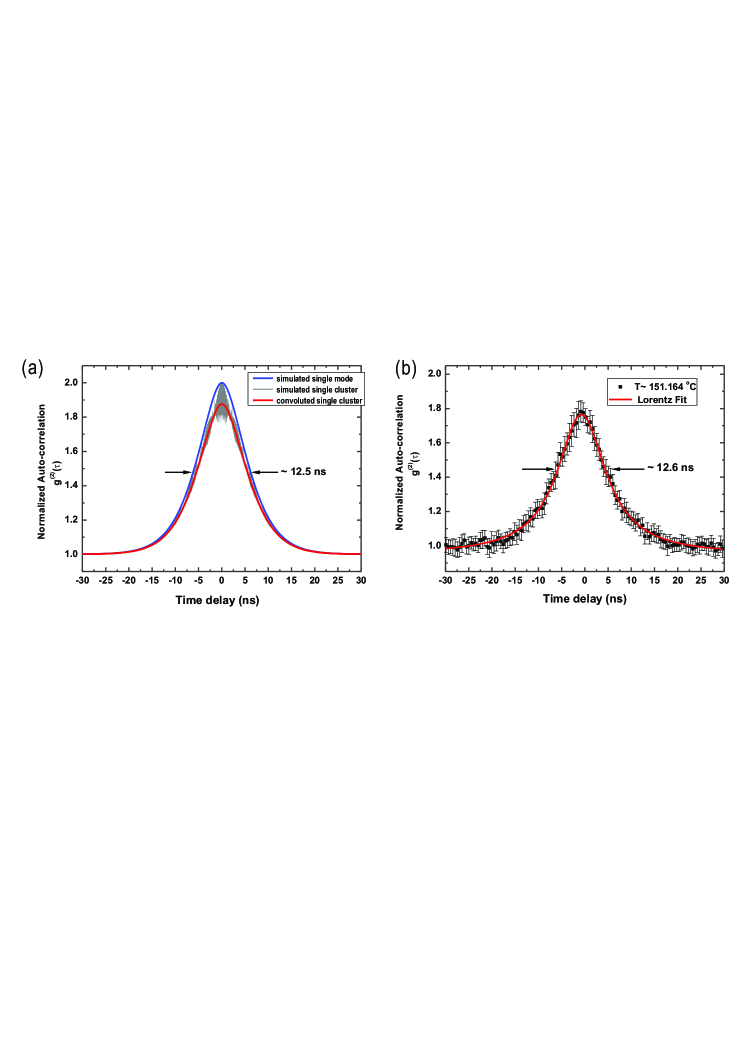
An alternative method to characterize the spectral properties of the source is the analysis of the auto-correlation Glauber function . The number of cavity modes can be estimated from the measured normalized auto-correlation function at zero time delay according to (more details are given in C).
Fig. 7(a) provides the simulated and convoluted auto-correlation results for signal photons from the resonant waveguide. In the ideal case of a pure single cavity mode field, the second-order auto-correlation is close to 2 at zero time delay. For a cluster obtained from this resonant waveguide, which consists of several inequivalent modes (as shown in Fig. 1(b) and Fig. 4(b)), the temporal auto-correlation behavior should reveal multi-mode interference as well. However, we can not resolve the interference fringes due to the resolution of the detection system. As a results, only one single convoluted peak with lower could be observed in the experiment.
From the measured value shown in Fig. 7(b), an effective cavity mode number of can be estimated. This is in reasonably good qualitative agreement with the simulated auto-correlation function shown in Fig. 7(a) and the measured spectra shown in Fig. 4, where we observed only one mode within a single cluster. The signal auto-correlation time ( 12.6 ns) is about 2.8 times broader than signal-idler correlation time ( 4.8 ns), which is in good agreement with the theoretical analysis (Eq. (23)). The Lorentz fit to the experimental curve also coincides with our theory model. Moreover, it indicates that shaping single photon wavepackets by using amplitude and phase modulators is possible [47], because the signal auto-correlation time is much longer than the time jitters from detectors and electro-optic modulators.
5.5 Heralded correlation

To understand the intrinsic nature of the source, it is important to investigate the heralding performance for this resonant waveguide. The heralding efficiency would suffer from the asymmetric reflectivities, because the photon pairs escaping probability is impacted by the reflectivities of both dielectric. However, the signal and idler long wave-packets generated from the resonant waveguide could help to resolve the wave-packet of single signal photons, due to the broadened temporal correlation length. The result of normalized heralded second-order correlation function is shown in Fig. 8. The at high pump power (10 mW) confirms a genuine sign of non-classicality. By using low power pumping ( 1 mW), the minimum droped to .
Comparing heralded correlation with auto-correlation, it is found that they have different distributions and bandwidths. The heralded one( 6.0 ns) is roughly half of the two-photon auto-correlated one ( 12.6 ns). The higher-photon components contributions to heralded correlation measurements mainly influence the minimum value, since the probability to generate single photon pairs is absolutely higher than the probability to generate double or even triple photon pairs.
6 Conclusion
In summary, we have experimentally demonstrated a compact single-longitudinal-mode two-color narrowband photon pair source in a doubly resonant Ti:PPLN waveguide. This elaborate source with its compact design emerges multiple strengths, such as narrow bandwidth, single longitudinal mode, high brightness, addressing atom and fiber compatibility. Our work shows that clustering can be exploited to restrict PDC generation to a single longitudinal mode. We have also observed several novel experimental phenomena behind the cavity-enhanced PDC, like cross-correlation time is smaller than auto-correlation time, and two-photon components have longer wave-packets than single ones.
Although the measured bandwidth of about 60 MHz is still about one order of magnitude larger than the smallest bandwidth demonstrated with bulk optical versions [41], our integrated source outperforms the bulk optic realizations in many key features (see also the comparison in Tab. 1). In particular, the rugged design, pure wave-packet and large brightness of about pairs/(smWMHz) are excellent properties of our device making it a versatile source for various quantum applications, for instance to address a Nd-based QM with a bandwidths of around 120 MHz [21] or Raman QM with a bandwidths of a few GHz [23] and quantum networks [49]. In general, our source has a great potential for various QCIP applications due to pure state, excellent temporal behavior and good compatibility with fiber based systems. Additionally, our device paves the way to arbitrarily shaped single photons in the temporal domain by using integrated devices. Future activities can focus on the development of pure single mode sources using pulsed light and pulse shaping in resonant waveguide [48]. Combining clustering with double-pass pumping to suppress PDC generation to a (filter-free) single cluster operation [39] and monolithic integration of an electro-optic modulator for fine tuning are further attractive goals.
7 Acknowledgments
The authors thank Andreas Christ, Regina Kruse, Malte Avenhaus and Michael Stefszky for useful discussions and helpful comments. This work was supported by the European Union through the QuReP project (no. 247743).
Appendix A Determining the finesse
In order to ensure that only a single combination of signal and idler modes is in resonance within a cluster, the difference of the free spectral range (FSR) for signal and idler must be larger than the spectral width of the single resonances. Assuming that , this leads to the following condition:
| (27) |
where are the resonance bandwidth for signal and idler, respectively. That is, the difference between different FSRs is required to be larger than the sum of two half-widths from signal and idler. As , it follows
| (28) |
From this expression, we can determine the finesse to have only a single mode in the cluster by suppressing adjacent longitudinal modes.
| (29) |
If we assume that the cavity has the same finesse for signal and idler, i.e. , the finesse is given by
| (30) |
Appendix B Photon pair generation rate and lifetime
In order to design a single-mode source with an integrated waveguide resonator with a precise value of the finesse, one has to optimize the reflectivity of rear mirror and the length of waveguide to take into consideration the losses inside the waveguide.
First, let us pay attention on the probability that a photon remains after a round-trip in the resonator, , where and are the reflectivities of front and rear mirrors, respectively; and is internal waveguide loss coefficient. This means, the probability that a photon is ’lost’ in a round-trip is given as:
| (31) |
Obviously, the ’losses’ of such a resonator concept are larger compared to the losses of a single pass device. Due to multiple round-trips in the lossy waveguide, the probability that a photon is lost, is increased. As a result, the probability that a photon generated by the PDC process is coupled out of the resonator from the rear mirror can be estimated as
| (32) |
For a pair of photons generated by a PDC process, the photon pair escape probability , i.e. the probability that a generated pair leaves the resonator at the ’useful’ port (not necessarily in the same round-trip), is given as
| (33) |
Therefore, the efficiency of such resonant photon pair sources is
| (34) |
where is the internal generation efficiency in the waveguide.
Besides the source efficiency, we are also interested in the lifetime of signal/idler photons in waveguide resonator,
| (35) |
Interestingly, the cross-correlation study between signal and idler allows the determination of the cavity performance at signal and idler simultaneously. From the different decay times of the cross-correlation measurements, we can deduce the loss inside the waveguide cavity and the finesse as well at the same time, when the mirror reflectivities are known.
| (36) |
Appendix C Multi-mode correlation function
Assuming several pairs of signal and idler modes with narrowband range generated within the broadband phase-matching envelope. Thus, we have a complex JSF
| (37) |
where are different phase-matching weights.
In the multi-mode case, the time-dependent signal-idler correlation function can be generalized as
It is found that the coincidence function includes interference terms resulting in a multi-mode beating under the exponential decay envelope.
If the difference between FSRs is negligible, there are a lot of cavity modes inside one cluster. First, we consider that signal (idler) resonances occur at distinct central frequencies () with equal spacing (). Thus, we rewrite Eq. (C) as
This reveals that the two-photon coincidence from a multi-mode cluster is not only determined by two exponential cavity decay times. Additionally, the superposition of different mode beatings contributes from . From the above equation, it can be seen that the coincidence distribution consists of two combs of peaks with equal separation, which corresponds to different round-trip times. Then, if the difference between FSRs is large enough, only one mode in each cluster appears. Considering the cluster effect, we rewrite Eq. (C) as
where are normalized constants from corresponding phase-matching weights. Both, information of cavity mode-beating and cluster modes interference, are included in the two-photon cross-correlation. If we have a stable PDC source with two or three single-mode clusters and a precise detection system, we would also obtain the cluster separation from such coincidence measurements.
Generally, for multi cavity modes and three clusters case, the coincidence relationship is more complicated, because mode beating and cluster beating both are involved. If the detection system with perfect resolution could resolve the emission time from different round-trips, we could characterize the cavity performance and distinguish the modes performance, like FSR and cluster separation. However,the description of realistic measurements must take into account the limited temporal resolution of the experimental system. Actually, the time jitter of detector systems at least covers several periods of mode beating and even more periods of cluster beating. Thus, we observed in the coincidence experiment the convolution between the real function and a window function, which is determined by the temporal resolution.
Consider a multi-mode beam with an equally spectral superposition of several Lorentzian distributions,
| (41) |
The auto-correlation function gives
where is the angular FSR and is the number of modes. When , the third interference term vanishes. In this case, Eq. (C) is the same as Eq. (2.5).
For different mode numbers , we always have , but only for a perfect time resolution. However, realistic detectors suffer from finite time resolution. For our resonant PDC, the photon has longer temporal wave-packets than the time window of the detectors. Therefore, our measurement provides information about the correlation function with finite temporal resolution, which is different from the usual time-integrated measurements as given for example in Ref. [44]. Assuming that the detection window at zero delay point has a window with width , then the measured is given by the convolution of the real with detector window function. Concerning the realistic measurement, the time window of our detection system is around 0.5 ns, the has magnitude around tens or hundreds of GHz, i.e. the detector window covers several beating periods. Thus, we observe a time-averaging over the beating periods resulting in a measured of
Consequently, the number of cavity modes can be directly determined from the auto-correlation measurements. Please note that this conclusion is similar for pulsed time-integrated correlations in Ref. [44], but cavity modes are not Schmidt modes. As soon as we use a cw laser to pump, we can not decompose our resonant PDC state to two independent orthonormal bases.
The time-resolved auto-correlation measurement can be used to characterize the spectral longitudinal mode properties of the source. A measured value close to 2 tells that there is only one mode with thermal photon-number distribution. If more cavity modes are involved, APDs cannot distinguish between the different thermal distribution. The measured value is a convolution between each individual thermal photon streams. It causes the small value in the finite detector window, which tends towards a Poissonian photon-number distribution after detection. If the measurements go further away from the auto-correlation time, the time-averaged correlation function drops to its minimum value one as expected.
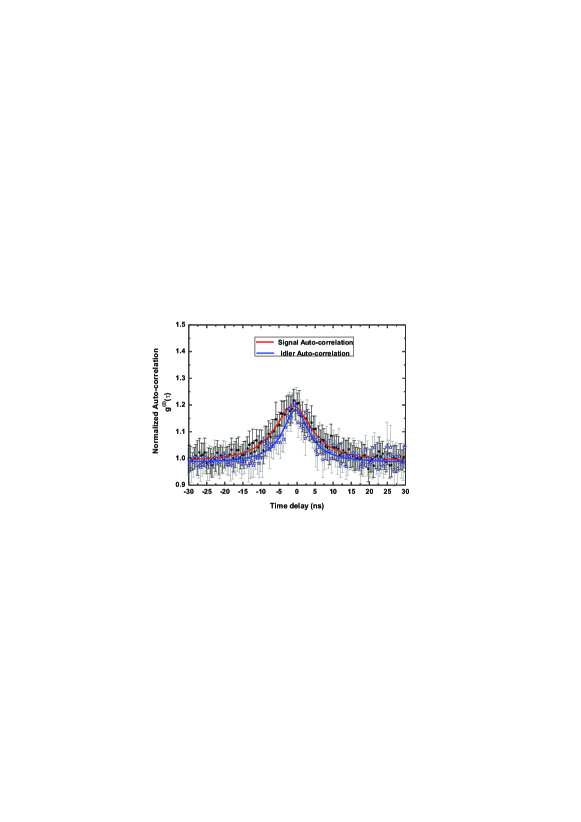
A measured characteristic for unfiltered signal and idler beams is shown in Fig. 9. From the measured value , an effective longitudinal mode number of can be estimated. This is in reasonably good agreement with the simulated output spectrum shown in Fig. 1(b), where we estimated one predominantly single mode together with several inequivalent modes within the whole phase-matching envelope. Comparing these two auto-correlation curves, it is found that they have different temporal bandwidths, 12.6 ns and 9.7 ns, respectively, which are corresponding to the different decay times from signal and idler cavity. Although signal and idler should have the same bandwidth due to the energy conservation and doubly resonant conditions, the auto-correlation still reveals the different cavity behaviors in the resonant waveguide. The reason is that our pump has 200 ns pulse length in order to synchronize the generation and detection systems. This means, the pump still has finite bandwidths around 30 MHz in spectral domain. Besides, the positions of measured slightly shift, just because of imperfect calibrations between two kinds of different detectors (Silicon and InGaAs APDs).
References
References
- [1] Gisin N, Ribordy G, Tittel W and Zbinden H 2002 Quantum cryptography Rev. Mod. Phys. 74 145-195
- [2] Gisin N and Thew R 2007 Quantum communication Nat. Photon. 1 165-171
- [3] Duan L M, Lukin M D, Cirac J I and Zoller P 2001 Long-distance quantum communication with atomic ensembles and linear optics Nature 414 413-418
- [4] Sangouard N, Simon C, De Riedmatten H and Gisin N 2011 Quantum repeaters based on atomic ensembles and linear optics Rev. Mod. Phys. 83 33-80
- [5] Kimble H J 2008 The quantum internet Nature 453 1023-1030
- [6] Politi A, Cryan M J, Rarity J G, Yu S and O’Brien J L 2008 Silica-on-silicon waveguide quantum circuits Science 320 646-649
- [7] Sansoni L, Sciarrino F, Vallone G, Mataloni P, Crespi A, Ramponi R and Osellame R 2010 Polarization entangled state measurement on a chip Phys. Rev. Lett. 105 200503
- [8] Tanzilli S, Martin A, Kaiser F, De Micheli M P, Alibart O and Ostrowsky D B 2012 On the genesis and evolution of integrated quantum optics Laser & Photonics Reviews 6 115-143
- [9] O’Brien J, Patton B, Sasaki M and Vučković J 2013 Focus on integrated quantum optics New J. Phys. 15 035016
- [10] Spring J B et al. 2013 Boson sampling on a photonic chip Science 339 798-801
- [11] Briegel H J, Dür W, Cirac J I and Zoller P 1998 Quantum repeaters: The role of imperfect local operations in quantum communication Phys. Rev. Lett. 81 5932
- [12] Simon C, De Riedmatten H, Afzelius M, Sangouard N, Zbinden H and Gisin N 2007 Quantum repeaters with photon pair sources and multimode memories Phys. Rev. Lett. 98 190503
- [13] Julsgaard B, Sherson J, Cirac J I, Fiurášcaronek J Polzik E S 2004 Experimental demonstration of quantum memory for light Nature 432 482-486
- [14] Lvovsky A I, Sanders B C and Tittel W 2009 Optical quantum memory Nat. Photon. 3 706-714
- [15] Reim K F, Nunn J, Lorenz V O, Sussman B J, Lee K C, Langford N K, Jaksch D and Walmsley I A 2010 Towards high-speed optical quantum memories Nat. Photon. 4 218-221
- [16] Hosseini M, Campbell G, Sparkes B M, Lam P K and Buchler B C 2011 Unconditional room-temperature quantum memory Nat. Phys. 7 794-798
- [17] Zhang H et al. 2011 Preparation and storage of frequency-uncorrelated entangled photons from cavity-enhanced spontaneous parametric downconversion Nat. Photon. 5 628-632
- [18] Bussiěres F, Sangouard N, Afzelius M, Riedmatten H, Simon C and Tittel W 2013 Prospective applications of optical quantum memories Journal of Modern Optics 60 1519-1537
- [19] Afzelius M, Chaneliére T, Cone R L, Kröll S, Moiseev S A and Sellars M 2010 Photon-echo quantum memory in solid state systems Laser & Photon. Rev. 4 244
- [20] Saglamyurek E, Sinclair N, Jin J, Slater J A, Oblak D, Bussiéres F, George M, Ricken R, Sohler W and Tittel W 2011 Broadband waveguide quantum memory for entangled photons Nature 469 512
- [21] Clausen C, Usmani I, Bussiéres F, Sangouard N, Afzelius M, de Riedmatten H and Gisin N 2011 Quantum storage of photonic entanglement in a crystal Nature 469 508-511
- [22] Rieländer D, Kutluer K, Ledingham P M, Gündoǧan M, Fekete J, Mazzera M and Riedmatten H 2014 Quantum storage of heralded single photons in a praseodymium-doped crystal Phys. Rev. Lett. 112 040504
- [23] Michelberger P S et al 2014 Interfacing GHz-bandwidth heralded single photons with a room-temperature Raman quantum memory arXiv:1405.1470.
- [24] England D G, Fisher K A G, MacLean J W, Bustard P J, Lausten R, Resch K J and Sussman B J 2015 Storage and retrieval of THz-bandwidth single photons using a room-temperature diamond quantum memory Phys. Rev. Lett. 114 053602
- [25] Burnham D C and Weinberg D L 1970 Observation of simultaneity in parametric production of optical photon pairs Phys. Rev. Lett. 25 84-87
- [26] U’Ren A B, Silberhorn C, Banaszek K and Walmsley I A 2004 Efficient conditional preparation of high-fidelity single photon states for fiber-optic quantum networks Phys. Rev. Lett. 93 093601
- [27] Ou Z Y and Lu Y J 1999 Cavity enhanced spontaneous parametric down-conversion for the prolongation of correlation time between conjugate photons Phys. Rev. Lett. 83 2556-2559
- [28] Laurat J, Keller G, Fabre C and Coudreau T 2006 Generation of two-color polarization-entangled optical beams with a self-phase-locked two-crystal optical parametric oscillator Phys. Rev. A 73 012333
- [29] Kuklewicz C E, Wong F N C and Shapiro J H 2006 Time-bin-modulated biphotons from cavity-enhanced down-conversion Phys. Rev. Lett. 97 223601
- [30] Bao X H, Qian Y, Yang J, Zhang H, Chen Z B, Yang T and Pan J W 2008 Generation of narrow-band polarization-entangled photon pairs for atomic quantum memories Phys. Rev. Lett. 101 190501
- [31] Scholz M, Koch L and Benson O 2009 Statistics of narrow-band single photons for quantum memories generated by ultrabright cavity-enhanced parametric down-conversion Phys. Rev. Lett. 102 063603
- [32] Hockel D, Koch L and Benson O 2011 Direct measurement of heralded single-photon statistics from a parametric down-conversion source Phys. Rev. A 83 013802
- [33] Wang F Y, Shi B S and Guo G C 2008 Observation of time correlation function of multimode two-photon pairs on a rubidium line Opt. Lett. 33 2191-2193
- [34] Melholt Nielsen B, Neergaard-Nielsen J S and Polzik E S 2009 Time gating of heralded single photons for atomic memories Opt. Lett. 34 3872
- [35] Wolfgramm F, de Icaza Astiz Y A, Beduini F A, Cerè A and Mitchell M W 2011 Atom-resonant heralded single photons by interaction-free measurement Phys. Rev. Lett. 106 053602
- [36] Pomarico E, Sanguinetti B, Gisin N, Thew R, Zbinden H, Schreiber G, Thomas A and Sohler W 2009 Waveguide-based OPO source of entangled photon pairs New J. Phys. 11 113042
- [37] Pomarico E, Sanguinetti B, Osorio C I, Herrmann H and Thew R T 2012 Engineering integrated pure narrow-band photon sources New J. Phys. 14 033008
- [38] Jeronimo-Moreno Y, Rodriguez-Benavides S and U’Ren A B 2010 Theory of cavity-enhanced spontaneous parametric downconversion Laser Phys. 20 1221-1233
- [39] Chuu C S, Yin G Y and Harris S E 2012 A miniature ultrabright source of temporally long, narrowband biphotons Appl. Phys. Lett. 101 051108
- [40] Förtsch M, Fürst J U, Wittmann C, Strekalov D, Aiello A, Chekhova M V, Silberhorn C, Leuchs G and Marquardt C 2013 A versatile source of single photons for quantum information processing Nat. Commun. 4 1818
- [41] Fekete J, Rieländer D, Cristiani M and de Riedmatten H 2013 Ultranarrow-band photon-pair source compatible with solid state quantum memories and telecommunication networks Phys. Rev. Lett. 110 220502
- [42] Förtsch M et al 2014 Highly efficient generation of single-mode photon pairs using a crystalline whispering gallery mode resonator arXiv:1404.0593.
- [43] Eckardt R C, Nabors C D, Kozlovsky W J and Byer R L 1991 Optical parametric oscillator frequency tuning and control J. Opt. Soc. Am. B 8 646-667
- [44] Christ A, Laiho K, Eckstein A, Cassemiro K N and Silberhorn C 2011 Probing multimode squeezing with correlation functions New J. Phys. 13 033027
- [45] Bettelli S 2010 Comment on “Coherence measures for heralded single-photon sources” Phys. Rev. A 81 037801
- [46] Glauber R J 1963 Coherent and incoherent states of the radiation field Phys. Rev. 131 2766-2788
- [47] Kolchin P, Belthangady C, Du S, Yin G Y and Harris S E 2008 Electro-optic modulation of single photons Phys. Rev. Lett. 101 103601
- [48] Kalachev A 2010 Pulse shaping during cavity-enhanced spontaneous parametric down-conversion Phys. Rev. A 81 043809
- [49] Monteiro F, Martin A, Sanguinetti B, Zbinden H and Thew R T 2014 Narrowband photon pair source for quantum networks Optics Express 22 4371-4378