Biomimetic membranes of lipid-peptide model systems prepared on solid support
Abstract
The structure of membrane-active peptides and their interaction with lipid bilayers can be studied in oriented lipid membranes deposited on solid substrates. Such systems are desirable for a number of surface-sensitive techniques. Here we focus on structural characterization by X-ray and neutron reflectivity and give account of recent progress in sample preparation and measurements. We show that the degree of mesoscopic disorder in the films can significantly influence the scattering curves. Static defects should be minimized by optimization of the preparation techniques and their presence must be taken into account in the modelling. Examples are given for alamethicin and magainin in bilayers of different phosphocholines.
pacs:
87.16.Dg, 61.10.Kw, 87.15.KgJ. Phys.: Condens. Matter 16(26), p. S2439 (2004).
DOI: 10.1088/0953-8984/16/26/017
1 Introduction
Compared to isotropic bulk solutions, biomimetic membranes deposited on solid surfaces offer a number of advantages for structural studies : surface characterization techniques can be applied to study such systems, different symmetry axes of the system can be separated, and macromolecular conformation of proteins or peptides can possibly be probed in and at the bilayer. From a technological point of view, solid surfaces may be used in future to manipulate or detect interactions in the biomolecular films deposited on top of them. Biomimetic interfaces and bio-functional surfaces are therefore an active field of interdisciplinary research. To this end, the preparation of well-defined, homogeneous and structurally intact membrane systems on solid support is an important problem, involving fundamental physical questions, for example related to wetting behaviour [29], thermal stability [44, 27, 33], or defects typical for smectic liquid crystalline (LC) films. A particularly simple and low-cost approach to preparing oriented lipid membranes is to spread or to spin-coat a solution of co-dissolved lipids and peptides onto solid surfaces like silicon, glass, quartz or other flat surfaces [39, 22].
The structure of biomimetic multilamellar lipid membranes deposited on solid surfaces can be studied at high resolution by modern surface-sensitive scattering techniques, using synchrotron based X-rays or neutrons as a probe. These techniques offer a novel approach to investigating the structure of lipid bilayer systems, both with and without additional membrane-active molecules such as amphiphilic peptides or membrane proteins. A high degree of orientation (low mosaicity) makes possible a precise distinction between the scattering vector component normal and parallel to the bilayer, opening up a way to study questions associated with the lateral structure of the bilayers. Most diffraction studies of aligned lipid films have been carried out in the low temperature gel phase [16]. Here we concentrate on the physiologically more relevant liquid phase.
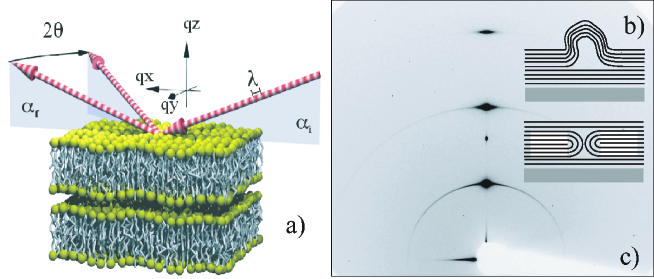
Figure 1(a) presents the diagram of an interface-sensitive scattering experiment : the incoming beam makes an angle with the plane of the bilayers. The outgoing beam makes an angle and it can also deviate by an angle from the plane of incidence (defined by the incident beam and the bilayer normal, taken in the following as the axis.) Multilayer systems, however well oriented on the average, often exhibit defects such as those depicted in figure 1(b), in which the normal to the bilayers makes a large angle with the average direction . Such defects (which can be minimized by careful preparation techniques or by long annealing times) are responsible for the sharp rings appearing at , as in the CCD image of figure 1(c), intersecting the three diffuse Bragg sheets. The bright spot between the first and second Bragg sheets is given by the specular beam (i. e. .)
A few years ago we started using aligned multilamellar membranes to study structural details of the lipid-peptide interaction by X-ray and neutron reflectometry. The vertical density profile of the bilayers (averaged over the -plane) can be determined from least-square fitting of the specular reflectivity curve, while diffuse scattering reflects the lateral inhomogeneities on mesoscopic length scales, from a few nm up to a few m. One aim of such studies is to deduce the peptide position and conformation with respect to the bilayer, i. e. to distinguish between the inserted and adsorbed states. In principle, the corresponding bilayer density profiles are different for the two conformations, and careful measurements should be able to evidence this. However, the observed changes in the reflectivity curves are often dominated by effects of the structure factor due to changes in the static or thermal fluctuations induced by the peptides. This difficulty has so far prevented us from extracting reliable structural parameters. In the present work, we give account of this problem and discuss different preparation procedures of multilamellar solid-supported bilayers, as well as the structure of these films on mesoscopic length scales. Importantly, this mesostructure has strong implications on the structural characterization on the molecular scale. We then show how a proper choice of organic solvents can minimize these secondary effects, leading to more homogeneous films amenable to quantitative structural analysis.
The particular peptides which we are interested in here belong to a family of innate host defense molecules known as antimicrobial peptides, see reviews in [2, 21, 14]. Well known examples are ceropins expressed in insects, or magainin, the first antimicrobial peptide discovered in vertebrates. Magainin is expressed in the intestines and the skin of the frog Xenopus laevis. Mammals also express antimicrobial peptides called defensins, which lyse microbes, probably by destroying the integrity of their cell walls, but leave the plasma membranes of their hosts intact. Other examples of similar antibiotic peptides are cytolytic to mammalian cells, like the well known alamethicin of the fungus Trichoderma viride, or the honey bee venom melittin. Host-defense and cytolytic peptides are amphiphilic polypeptides of typically 20 to 40 amino acid residues, with well-defined secondary structures forming upon interaction with the lipid bilayer. It has been shown that antimicrobial peptides interact directly with the microbial cell membranes, rather than with specific membrane proteins, subsequently causing an increase in membrane permeability and cell lysis. Apart from the obvious significance in the biological and pharmaceutical sciences, membrane-active peptides pose many interesting questions of biomolecular self-assembly in the bilayer and can be regarded as a testing ground for concepts and methods which may then be translated to more complex membrane protein systems. However, despite recent advances due to the use of a large number of different techniques, most models of the functional interaction and structure remain partially hypothetical and incomplete, and require in-depth structural characterization. To this end, a refinement of scattering techniques including sample preparation, measurement and data analysis is needed, and could complement and significantly extend the possibilities of present small angle scattering experiments [46, 26].
After this introduction, section 2 presents the sample preparation procedure and some experimental aspects of the reflectivity measurements. Section 3 is devoted to the analysis and modelling of reflectivity curves obtained from multilamellar lipid bilayers. A popular method for determining the bilayer density profiles is the Fourier synthesis based on Bragg peak intensities. We investigate the validity of this method by comparing the results to those obtained from data fitting over the full -range. Section 4 discusses the effect of thermal fluctuations and static defects on the structure determination and presents different experimental routes for the structural analysis of supported multilamellar stacks by scattering. Examples using these methods are presented in section 5 on model systems composed of pure lipids and antibiotic peptides in lipids. Finally, section 6 presents a comparative discussion and some tentative conclusions.
2 Sample preparation, sample environment, and reflectivity setup
Highly oriented membranes are characterized by a very small mosaicity (i. e. distribution of the bilayer normal vector), typically of the order of or below, which is small compared to the critical angle for total external reflection of X-rays or neutrons. Therefore, quantitative interface-sensitive X-ray or neutron scattering methods like specular and non-specular reflectivity, grazing incidence diffraction, and reciprocal space mappings, see figure 1 and recent monographs [43, 1], can be applied. Films of lipid membranes can be prepared using the classical procedure of spreading lipids (and peptides) from solution [39], as free standing films [42], or by more recent schemes which allow a precise control of the total number of bilayers by spin-coating the solutions [22]. Novel methods to prepare single or double bilayers by Langmuir techniques have also been reported [10].
| 1 | 2 | 3 | 4 | 5 | 6 | 7 | 8 | 9 | 10 | 11 | |
|---|---|---|---|---|---|---|---|---|---|---|---|
| DLPC | Y | Y | Y | Y | Y | ||||||
| DMPC | Y | Y | Y | Y | Y | Y | Y | ||||
| DOPC | Y | Y | Y | ||||||||
| DPPC | Y | Y | Y | Y | Y | ||||||
| OPPC | Y | N | Y | Y | Y | Y | Y | ||||
| DMPE | N | Y ( 1mg/ml) | Y (after 24 h) | Y | N | ||||||
| POPE | N | Y | Y | Y | |||||||
| DMPG | N | Y ( 1mg/ml) | Y | Y | Y | ||||||
| POPS | N | Y | Y (TFE/CH3Cl) | Y | N | ||||||
| Alam. | Y | N | N | N | Y | N | |||||
| Mag.2 | Y (about 1mg/ml) | N | Y | Y | Y | Y | |||||
| Gram. D | Y | Y | Y | Y | Y |
2.1 Sample preparation for the presented experiments
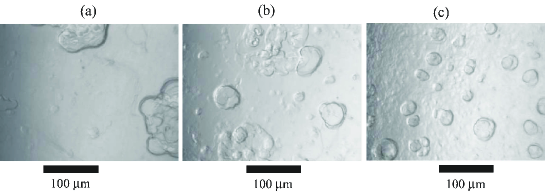
1,2-dimyristoyl-sn-glycero- 3-phosphatidylcholine (DMPC), 1,2-oleoyl-palmitoyl-sn-glycero-3-phosphatidylcholine (OPPC), 1,2-dimyristoyl-sn-glycero-3-phosphoethanolamine (DMPE) were bought from Avanti Lipids, Alabama, and used without further purification. The peptide magainin 2 amide () was obtained by solid-phase peptide synthesis by B. Bechinger and coworkers [2]. Alamethicin () was bought from Sigma (product number: 05125). Multilamellar bilayers were prepared on cleaned silicon or glass wafers by spreading from organic solution, similar to the procedure first described by Seul and Sammon [39]. The challenge is to simultaneously meet the solvation and wettability requirements. For sample deposition the substrates were cleaned by two 15 min cycles of ultrasonic cleaning in methanol, followed by two 15 min cycles in ultrapure water (specific resistivity 18M cm, Millipore, Bedford, MA), and drying under nitrogen flow. Finally, they were rendered hydrophilic by etching in a plasma cleaner (Harrick Scientific, NY) for 30 seconds. The lipid and peptide components were co-dissolved in the desired proportions (molar ratio P/L) in (i) 2-propanol, (ii) 2-2-2-trifluoroethanol (TFE) and (iii) 1:1 Chloroform:TFE mixtures (see table 1 for solubility of lipid and peptide in some solvents), at total concentrations between 4 and 20 mg/ml, depending on the total mass to be deposited. A drop of 0.1 ml was then carefully spread onto well-leveled and cleaned Si (100) or glass substrates of typically yielding average film thicknesses of about m. The spread solution was allowed to dry only very slowly to prevent film rupture and dewetting. The films were then exposed to high vacuum over 24 hours in order to remove all traces of solvent and subsequently rehydrated in a hydration chamber. In all cases, the mosaicity was typically better than 0.02∘. To monitor sample quality, we used light microscopy in DIC contrast (Zeiss Axioskop, objective: Neofluar 20x /0.5 DIC) to image the samples after deposition, mainly in the dry state. Figure 2 shows DMPC samples of 15 mg/ml stock solutions (0.2 ml spread on Si (100) in three different organic solvents, namely isopropanol, TFE, and 1:1 TFE:chloroform mixture. The representative images clearly show that the defect structure depends on the solvent. In general, TFE:chloroform mixtures gave the best results, i.e. the smallest number of defects.
2.2 Sample environment
Sample environment for the control of temperature, humidity, and possibly other parameters (osmotic pressure, electrical fields etc.) can generally be made compatible with the X-ray experiments. Here, the sample chamber consisted of two stainless steel cylinders with kapton windows. The chamber was cooled or heated by a flow of oil or 1:2 glycol:water mixtures from a temperature-controlled reservoir (Julabo, Germany). The samples were mounted in an inner chamber with a water reservoir to keep the relative humidity close to . The temperature was measured in most cases in the inner chamber by a Pt100 sensor, showing a stability of better than K over several hours. A sensor for relative humidity (HIH2610-003, Honeywell, Freeport IL) was additionally installed, but in most cases failed to give reproducible results near relative humidity. In most of our measurements, uncharged membranes could not be swollen to their equilibrium periodicity in water vapor, even if the vapor was (nominally) at relative humidity. This phenomenon, long known as the vapor pressure paradox, results from small temperature gradients in the sample chamber [25]. In practice, we took the membrane periodicity of pure DMPC as a control of the humidity at a given temperature and chamber mounting. It is also possible to study solid-supported lipid films immersed in excess water [44]. This is of interest for two reasons : Firstly, excess water warrants the physiologically relevant condition of full hydration. Secondly, membrane-active molecules can be adsorbed directly from the solution. However, films in excess water are unstable in the absence of osmotic agents (stressors). A thermal unbinding transition was observed [44, 27], from a substrate-bound, multilamellar state at low temperatures to a state of freely dispersed bilayers in water at high temperatures. Unbinding can be suppressed (and the films thus stabilized) by adding an osmotic stressor to the excess water. The control of the periodicity can be achieved by the use of excess polymer solutions as osmotic stressors, and the equation of state can be determined [22, 4]. For charged systems, mixing of the bilayers and stressor polymers can be avoided by using polyelectrolytes of the same charge as the lipids. In this work, we used samples immersed in water for two series of DMPC/Alamethicin at different osmotic pressures, using as osmotic stressor solutions of (i) PEG solution (molecular weight ), with 100 mM NaCl, and (ii) PEG at zero salt (see figure 6).
2.3 X-ray reflectivity
For this method, the incident beam with wave vector has to be collimated to less than a few hundredths of a degree and directed onto the sample at a glancing incidence angle . The reflected intensity is then measured as a function of under specular conditions, i.e. at an exit angle and out-of-plane angle , with the wave vector of the exit beam denoted by . Thus, the momentum transfer of the elastic scattering is always along , with the -axis parallel to the sample normal, see figures 1 and 2. Contrarily, moving the detector or sample to (diffuse or non-specular scattering) results in a component parallel to the sample surface.
The reflectivity measurements presented here were carried out at three different experimental stations : (i) At a high resolution in-house rotating anode reflectometer, equipped with a channel-cut monochromator selecting the Cu Kα1 radiation, a -axis diffractometer and a standard NaI scintillation counter. (ii) At the bending magnet beamline D4 of HASYLAB/DESY using photon energies of 20 keV. (iii) At the experimental station ID1 of ESRF Grenoble using photon energies of 19 keV. Incidence and exit beams are defined by various slits. Typically, the reflectivity can be recorded over seven to eight orders of magnitude, after correction for diffuse scattering background, as measured in an offset scan. In order to get correct results when fitting the reflectivity, the correction for diffuse background at higher angles is essential. Beyond background subtraction, the diffuse (non-specular) scattering component contains valuable information on the lateral membrane structure on mesoscopic length scales, in particular the height fluctuations as quantified by the height-height self- and cross-correlation functions [36].
3 Analysis of reflectivity curves from multilamellar membranes
The analysis of X-ray and neutron reflectivity requires a very low mosaicity (narrow orientational distribution of domains) as well as a flat substrate, allowing a clear separation between the specular and non-specular scattering components. Two standard approaches are the fully dynamical Parratt algorithm (taking into account multiple reflections) or the semi-kinematical reflectivity pioneered by Als-Nielsen [1]. In contrast to small-angle scattering, the observation of a region of total external reflection and hence of the critical angle allows the determination of the electronic density profile on an absolute scale . Furthermore, since the full -range can be used for data analysis by fitting the reflectivity curve to a parameterized model of the density profile [35], a reasonable resolution in can also be reached for fully hydrated systems. Compared to arbitrary interface profiles, the analysis is significantly simplified, since the bilayer form factor is real-valued due to centro-symmetry and changes in sign are often accompanied by an observable cusp in the (continuously measured) reflectivity curve. Alternatively, phasing of the Fourier components can be performed by the so-called swelling method. Note that the advantage of full -fitting has also been demonstrated in bulk (SAXS) studies, see for example [28]. In most published studies of oriented bilayers, however, only the integrated Bragg peaks of the multilamellar samples are used for data analysis, and the one-dimensional density profile is computed by Fourier synthesis using a discrete set of coefficients as described in [3, 15, 47] (see equation (4) below).
We have recently developed a reflectivity model in the framework of semi-kinematical scattering theory, in which both the structure factor of the stack and the bilayer form factor can be suitably chosen [35], according to the given experimental resolution. This is possible since the lipid bilayer density profile and the associated form factor are parameterized by a variable number of Fourier coefficients, where is adapted to the resolution of the measurement. In contrast to conventional box models, the total number of parameters can thus be kept small, while still fitting to reasonable density profiles. As a test example, the reflectivity of highly aligned multilamellar OPPC membranes on solid substrates has been measured and analyzed [35]. The resulting density profile agrees remarkably well with the bilayer structure as obtained from published molecular dynamics (MD) simulations [11], (see figure 3(b)). The starting point for this treatment is the so-called master equation of reflectivity from a structured interface in semi-kinematic approximation [1]. For an interface perpendicular to the axis, characterized by the (laterally averaged) scattering length density profile , (electron density for X-rays) between a medium 1 (air or water) with scattering length density and a medium 2 (solid substrate) with density , the reflectivity reads :
| (1) |
where is the Fresnel reflectivity of the ideal (sharp) interface between the two media, and is the density contrast. Note that is obtained by the combination of the solid surface and a step train of lipid bilayers, convolved with a function describing the positional fluctuations and multiplied by a coverage function (see below). The critical momentum transfer or the critical angle in is related to the density contrast by , with denoting the classical electron radius. Absorption can be accounted for by an imaginary component of the wave vector. The substrate/film interface is the only relevant boundary for the factor due to the following reasons : (i) in many cases, the beam impinges on the sample through the water phase and there is almost no contrast between the film and water (for X-rays) so no refraction takes place at the water/film interface; (ii) due to decreasing coverage of the upper layers, the water/film interface is broad and not well defined, again leading to vanishing reflection and refraction effects at this interface. We describe this feature by a monotonously decreasing coverage function with and .
Using the linearity of the integrand in equation (1), the reflectivity amplitude can be split into two parts . is due to the reflection from the density increment at the substrate and represents the multilamellar bilayers. Taking to denote the rms roughness of the substrate, we get . Note that the position of the first bilayer is shifted by with respect to the substrate (due to the presence of a thin water layer). can be accounted for by specifying a structure factor
| (2) |
with the rms-fluctuation amplitude of the -th bilayer, and the form factor :
| (3) |
The bilayer is parameterized in terms of its first Fourier coefficients ,
| (4) |
Note that due to the mirror plane symmetry of the bilayer, the phases are reduced to positive/negative signs only, facilitating the phase problem enormously. In fact, the correct choice of signs (up to orders or ) can in most cases be guessed from the knowledge of the basic bilayer profile, if not deduced from the data, where sign changes are often accompanied by observable cusps in the reflectivity curves. The integral of the form factor can be solved analytically, yielding :
| (5) |
More details of this approach are discussed in [35]. In practice, the range of the reflectivity determines the number of orders which should be included. Note also that the parameterization of Fourier coefficients can easily be changed by way of a linear transformation into a parameterization of independent structural parameters of the bilayer, such as bilayer thickness (headgroup peak-to-peak distance), density maximum in the headgroup region, density in the bilayer middle plane, density of the water layer, etc. [35].
Figure 3 shows the reflectivity of multilamellar OPPC membranes, measured at the in-house high resolution rotating anode reflectometer at T=45°C. The sample was prepared on a cleaned (111) Si wafer by spreading from TFE [23]. During the measurement, the sample was in the fluid phase, and the smectic parameter was . After subtraction of the offset scan (figure 3(a)), the reflectivity curve was fitted to a model with 5 free Fourier coefficients.
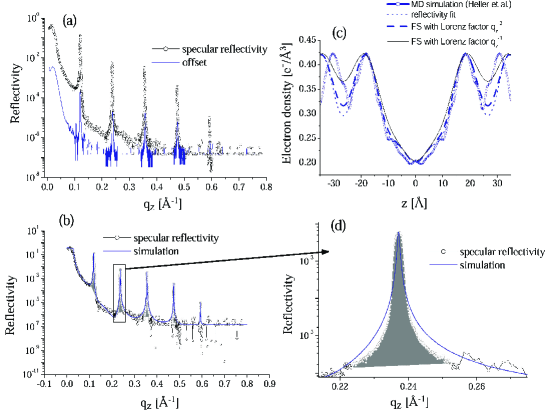
We treated the same data using the Fourier synthesis approach. While full -range fitting gives the on an absolute scale [35], Fourier synthesis determines a relative profile , with two open parameters and . All results were compared to the electron density profile as calculated from MD simulation data of Heller et al. [11]. The scaling parameters and used are 1120 and 0.31 for Lorentz factor , and 440 and 0.322 for Lorentz factor , respectively. The comparison clearly indicates that the Lorentz factor fails, while gives good agreement. In this way, empirical correction terms can be ”calibrated”.
4 Thermal and static disorder, non-specular scattering
In order to determine the density profiles from , the effects of thermal and static fluctuations (e.g. due to defects) in have to be quantified. Thermal fluctuations are dominant at full hydration, when the compressional modulus of the stack is small, and less important at partial hydration, when is high. Furthermore, the solid surface effectively reduces thermal fluctuations (in particular long range undulations), making it possible to get higher resolution profiles than in the bulk, even in fully hydrated states [36]. To quantify the fluctuation effects and to incorporate them in the reflectivity analysis, one can either treat the layers as discrete [13, 17, 34], or consider the stack as a continuous elastic medium, described by the classical smectic energy [9] , where is a continuum displacement field of the membranes with respect to a perfect lattice. and are the bulk moduli for compression and curvature, respectively. is related to the bending modulus of a single membrane by .
This latter approach is more tractable than the discrete one and yields similar results [32]. The boundary condition at the flat substrate can be taken into account either by taking the associated surface tension to infinity [40], or directly by choosing for the fluctuation modes an orthogonal set of eigenfunctions which vanish at the substrate [8]. Even in the continuous medium approach, the discrete nature of the stack must be taken into account by limiting the number of distinct fluctuation modes to the number of bilayers, (this amounts to restricting the summation to the first Brillouin zone), lest spurious divergences appear. The model yields a complete description of the fluctuation spectrum, including the dependence of the correlation function on and on the in-plane distance . However, only the rms fluctuation amplitude for each bilayer is needed to describe the specular scattering. Its value is simply determined as [7] :
| (6) |
where is a dimensionless parameter first introduced by Caillé [5], which quantifies the importance of the fluctuations.
The most important kind of imperfection in lipid films is often the inhomogeneous coverage, i.e. the distribution of the total number of bilayers on lateral length scales of several m, deriving either from the non-equilibrium deposition process or from an equilibrium dewetting instability [29]. The effect can be modelled by a coverage function for which a convenient analytical form can be chosen as :
| (7) |
where is an empirical parameter controlling the degree of coverage. This is a convenient method, but not a very precise one, insofar as the fluctuation spectrum is still calculated for a fixed number of layers, . A growing number of totally dewetted patches has been observed in thin oligo-membrane films hydrated from water vapor. Another type of decreasing coverage is found in thick films in excess water at high temperatures, where parts of the multilamellar stack unbind from the substrate or from the underlying bilayers. Accompanying this effect, multilamellar vesicles can be observed in light microscopy at the lipid/water interface [44]. Other defects appearing in the lipid films are the typical textural defects of the smectic phase, such as focal conics or oily streaks. They are expected to give rise to isotropic Debye-Scherrer rings, as in figure 1(c). Finally, hydrophobic/hydrophilic interactions may lead to defect structures terminating the bilayers at the edges. All of the above defects are presumably accompanied by long range distortion fields, so that additional contributions to aside from thermal fluctuations could be present. The density of defects can vary significantly depending on the preparation scheme. To this end, we have strong indications that the type of solvent used in thick spread lipid films is of paramount importance if a uniform film thickness is to be obtained, see figures 2 and 5.
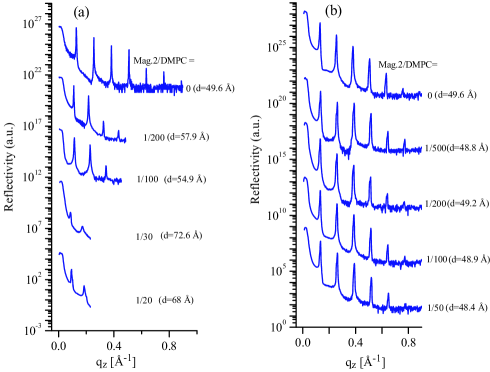
While thermal fluctuations prevail at low osmotic pressure (high swelling), the dominant mechanism determining the decay of higher order Bragg peaks at high osmotic pressure (low swelling) may be due to static defects. This conclusion can be drawn from the fact that samples of nominally identical composition and swelling may exhibit very different reflectivity curves, as illustrated by the comparison of two sample series of magainin 2 in DMPC, one spread from TFE, see figure 4(a), the other from a TFE:Chloroform mixture, see figure 4(b). Both series are shown as measured before offset subtraction. Sample (a) was prepared on a cleaned (111) Si wafer and measured at the in-house rotating anode reflectometer using Cu Kα1 radiation. Sample (b) was spread from the mixed solvent on cleaned glass, and measured at the D4 bending magnet station, using 20 keV. Note that the difference in photon energy leads to very different peak to tail ratios at the first Bragg peak, since the interference with the substrate reflectivity amplitude is low for Cu Kα1 radiation due to absorption. In figure 4(a), the disorder in the multilamellar stack clearly increases with peptide concentration, but in figure 4(b) this effect is not observed, possibly due to the different (-dependent) sample quality (defect structure), see figure 2. While for pure DMPC () six Bragg peak are observed in both cases, the curve in (a) exhibits only three, the same curve in (b) five peaks. Thus, the Debye-Waller factor must be significantly different. However, we must also note that the swelling was very different in the two cases, such that part of the effect might be attributed to thermal fluctuations, which change with the state of swelling.
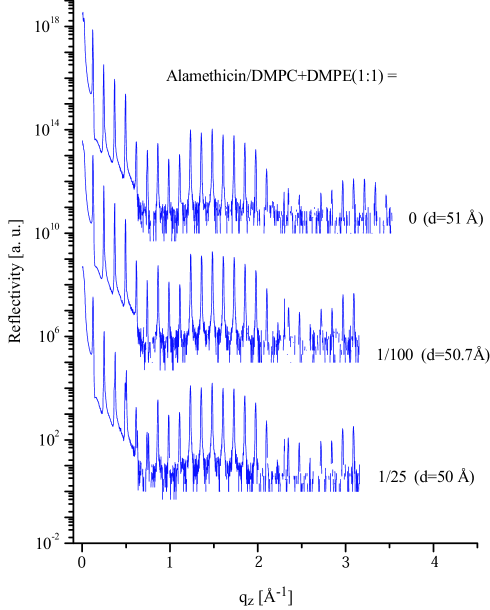
The fact that TFE:Chloroform mixtures give particularly high quality samples is further illustrated by figure 5, showing the reflectivity curves of samples composed of lipid mixtures of DMPC and DMPE in a 1:1 molar ratio. The samples were prepared from 1:1 TFE:chloroform solutions, spread on (100) Si wafers, and measured in the humidity chamber at a temperature °C at the D4 bending magnet station of HASYLAB/DESY using photon energies of 20 keV. At this temperature and humidity, the samples are probably in the gel phase, where thermal fluctuations are suppressed. Static defects seem to be minimized by the preparation procedure, since an astonishingly high number of peaks (27 in pure DMPC:PE) can be measured. Peptide addition slightly reduces the periodicity , but does not affect the high number of peaks.
5 Antibiotic peptides in lipid membrane model systems : special approaches
As mentioned in the introduction, different choices of sample preparation and measurement are possible, and should be compared. Most of the studies discussed here were performed in humidity setups. However, in biological systems the membranes are always in contact with a fluid phase; it is then very important to study the biomimetic peptide-lipid systems in immersion, which has the additional advantage of allowing a wider range of experimental conditions : the use of osmotic stressors, already employed in the case of pure lipid systems (see section 2) can control the hydration (and also the stability of the stack). Salt can be used to screen the polar lipids and/or proteins. Finally, by stopflow experiments one could study the interaction between peptides and various solutes, as well as the adsorption kinetics of the peptides themselves onto the bilayers. Nevertheless, the presence of the solvent, which constitutes an additional source for scattering, raises experimental problems : the X-ray photons must be energetic enough to penetrate about 1 cm of water; as for neutrons, it is sometimes more convenient to approach the sample through the (crystalline) substrate.
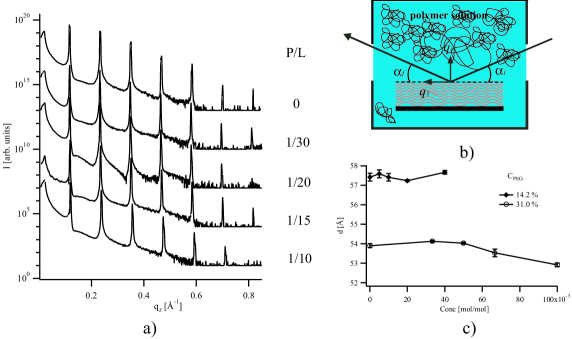
As seen in the previous section, an important problem is the change in swelling state within one sample series, see figure 4. In principle, very important information is contained in the slight changes of , or –more accurately– in the changes of water layer thickness and bilayer thickness as a function of . However, there always remains a doubt whether the relative humidity is really kept constant in the humidity cell for two consecutive samples and whether changes in the swelling can really be attributed to changing interaction forces (e.g. electrostatic repulsion for different ). By immersing the samples in calibrated solutions of osmotic stressors (polymer solutions), this problem can also be circumvented. As an illustration, we present in figure 6(a) reflectivity spectra of alamethicin-containing DMPC multilayers, in contact with a wt/vol PEG solution (molecular weight ), with 100 mM added NaCl, for different peptide concentrations, measured on the ID1 beamline at the ESRF-Grenoble, with a photon energy of 19 keV. The setup is represented in figure 6(b); the stainless steel chamber has kapton windows for the incoming and the outgoing beam and is mounted on a heating stage for temperature control. In figure 6(c) we show the repeat distance as a function of peptide concentration, for two different PEG concentrations : (diamonds) and (open dots). The error bars are obtained from an average over three Bragg orders. A very slight decrease in takes place for (only reached for the series with PEG solution shown in figure 6(a)). The physical reason of the decrease is unclear at this point; as , a refined analysis of the form factor is needed in order to discriminate between changes in the thickness of the lipid bilayer or the water layer. Bilayer thinning at lower (and in different experimental conditions) was already reported (see [6] and references therein).
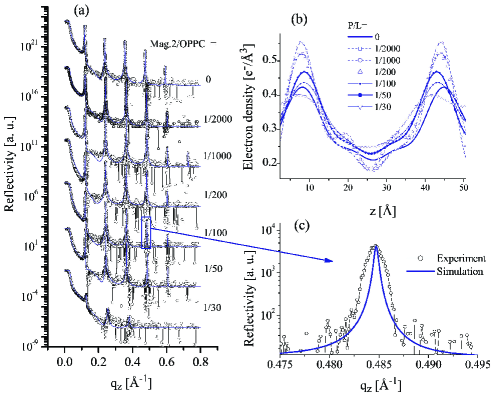
For comparison, a standard measurement in the humidity setup is shown in figure 7 for a series of magainin in OPPC as a function of . The preparation and measurement setup is equivalent to the pure OPPC sample shown in figure 3 (a). The periodicity decreases with . After fitting the curves to the model described above (solid line) over the full -range, the profiles for have been superimposed in (b). From these curves a monotonic decrease of the bilayer thickness (defined as the head-head distance from the maximum in ) is inferred, ranging from at to at . Surprisingly, the least-square fits give unrealistically high values for the electron density in the head groups. This result has to be regarded as an artifact. The reason is probably due to the fact that, in order to determine the absolute scale in correctly, the lineshape and integrated peak intensity of the Bragg peak has to be fitted correctly, which is not the case, see zoom shown in figure 7(c). The problem here is that the instrumental resolution has not yet been taken correctly into account. As a consequence, the profiles are flawed.
6 Conclusions
In conclusion, we have shown different experimental approaches for studies of peptide-lipid interaction by X-ray scattering from solid-supported films. Sample preparation, measurement and data analysis are largely analogous in the case of neutron reflectivity (data not shown here), which typically suffers from a smaller accessible -range due to less brilliant sources, but offers the advantage of contrast variation. More generally, some aspects of sample preparation discussed here (in particular related to mosaicity and defect density) may also be of interest for other techniques, both structural and spectroscopic.
While in principle able to distinguish different conformational states of macromolecules in and at the bilayer, X-ray reflectivity analysis presents some important challenges, in particular related to the correct model for thermal fluctuations and distortion fields by static defects. As a general strategy, it is convenient to prepare sample series in several configurations and to measure them in different setups. Simultaneous analysis of reflectivity curves obtained from thin oligo-membranes and thick multilamellar stacks, and of curves obtained in humidity and immersion chambers, as well as specular and offset curves provides a way to cross-check the results and to distinguish significant effects from artifacts. To this end, the model should be improved by incorporating the resolution effects in the fitting program. In the future, we will work towards a freely distributed software for reflectivity analysis for solid-supported multilayers. One aspect which we have not addressed here but which is important for this goal is the proper parameterisation of the macromolecules, i.e. the interpretation of the density profiles [19, 46]. Finally, synergies between advanced scattering methods and other techniques (using oriented samples) such as solid-state NMR, infrared spectroscopy with site-directed labels and optical dichroism should be exploited.
References
References
- [1] Als-Nielsen J and McMorrow D 2001 Elements of Modern X-ray Physics John Wiley & Sons.
- [2] Bechinger B 1999 Biochimica et Biophysica Acta 1462 157.
- [3] Blaurock A E 1982 Biochem. Biophys. Acta 650 167.
- [4] Brotons G, Salditt T, Dubois M and Zemb Th 2003 Langmuir 19 8235.
- [5] Caillé A 1972 C. R. Acad. Sci. Paris B 274 891.
- [6] Chen F-Y, Lee M-T and Huang H W 2003 Biophys. J. 84 3751.
- [7] Constantin D, Mennicke U, Li C and Salditt T 2003 Eur. Phys. J. E, in press.
- [8] de Boer D K G 1999 Phys. Rev. E 59 1880.
- [9] de Gennes P G and Prost J 1993 The Physics of Liquid Crystals Oxford University Press Oxford.
- [10] Fragneto G, Charitat T, Graner F, Mecke K, Perino-Gallice L and Bellet-Amalrice E 2001 Europhys. Lett. 53 100.
- [11] Heller H, Schaeffer M and Schulten K 1993 J. Phys. Chem. 97 8343.
- [12] Heller W T, Waring A J, Lehrer R I, Harroun T A, Weiss T M, Yang L and Huang H W 2000 Biochemistry 39 139.
- [13] Hołyst R 1991 Phys. Rev. A 44 3692.
- [14] Huang H W 2000 Biochemistry 39 8347.
- [15] Katsaras J 1995 Biochem. Cell. Biol. 73 209.
- [16] Katsaras J and Raghunathan V 2000 in J Katsaras and T Gutberlet, eds, Lipid bilayers : Structure and Interactions Springer Verlag Berlin.
- [17] Lei N, Safinya C and Bruinsma R 1995 J. Phys. II France 5 1155.
- [18] Lipowsky R 1995 Zeitschrift für Physik B 97 193.
- [19] Lösche M 2002 Current Topics In Membrane 52 117.
- [20] Lyatskaya Y, Liu Y, Tristram-Nagle S, Katsaras J and Nagle J F 2000 Phys. Rev. E 63 011907.
- [21] Matsuzaki K 1999 Biochimica et Biophysica Acta 1462 1.
- [22] Mennicke U and Salditt T 2002 Langmuir 18 8172.
- [23] Münster C, Salditt T, Vogel M and Peisl J 1999 Europhysics Letters 46 486.
- [24] Münster C 2000 Ph. D. Thesis Ludwig-Maximilians-Universität München Germany.
- [25] Nagle J and Katsaras J 1999 Phys. Rev. E 59 7018.
- [26] Nagle J and Tristram-Nagle S 2000 Biochim. Biophys. Acta 1469 159.
- [27] Pabst G, Katsaras J and Raghunathan V A 2002 Phys. Rev. Lett. 88 128101.
- [28] Pabst G, Rappolt M, Amenitsch H and Laggner P 2000 Phys. Rev. E 62 4000.
- [29] Perino-Gallice L, Fragneto G, Mennicke U, Salditt T and Rieutord F 2002 Eur. Phys. J. E 8 275.
- [30] Pfeiffer F, Mennicke U and Salditt T 2002 J. Appl. Cryst. 35 1.
- [31] Podgornik R and Parsegian V A 1997 Biophys. J. 72 942.
- [32] Poniewierski A and Hołyst R 1993 Phys. Rev. B 47 9840.
- [33] Pozo-Navas B, Raghunathan V A, Katsaras J, Rappolt M, Lohner K and Pabst G 2003 Phys. Rev. Lett. 91 028101.
- [34] Romanov V P and Ul’yanov S V 2002 Phys. Rev. E 66 061701.
- [35] Salditt T, Li C, Spaar A and Mennicke U 2002 Eur. Phys. J. E 7 105.
- [36] Salditt T, Münster C, Lu J, Vogel M, Fenzl W and Souvorov A 1999 Phys. Rev. E 60 7285.
- [37] Salditt T, Vogel M and Fenzl W 2003 Phys. Rev. Lett 90 178101.
- [38] Salditt T, Münster C, Mennicke U, Ollinger C and Fragneto G 2003 Langmuir 19 7703.
- [39] Seul M and Sammon M J 1990 Thin Solid Films 185 287.
- [40] Shalaginov A N and Romanov V P 1993 Phys. Rev. E 48 1073.
- [41] Sinha S K, Sirota E B, Garoff S and Stanley H B 2000 Phys. Rev. B 38 2297.
- [42] Smith G S, Sirota E B, Safinya C R and Clark N A 1988 Phys. Rev. Lett. 60 813.
- [43] Tolan M 1999 X-ray Scattering from Soft-Matter Thin Films Springer Verlag Berlin.
- [44] Vogel M, Münster C, Fenzl W and Salditt T 2000 Phys. Rev. Lett. 84 390.
- [45] Weiss T M, van der Wel P C A, Killian J A, Koeppe II R E and Huang H W 2003 Biophys J. 84 379.
- [46] White S H and Hristova K 2000Lipid bilayers : Structure and Interactions Springer Verlag, Berlin.
- [47] Zhang R, Suter R M and Nagle J F 1994 Phys. Rev. E 50 5047.