A Search for Optical Laser Emission Using Keck HIRES
Abstract
We present a search for laser emission coming from point sources in the vicinity of 2796 stars, including 1368 Kepler Objects of Interest (KOIs) that host one or more exoplanets. We search for extremely narrow emission lines in the wavelength region between 3640 and 7890 Å using the Keck 10-meter telescope and spectroscopy with high resolution ( = 60,000). Laser emission lines coming from non-natural sources are distinguished from natural astrophysical sources by being monochromatic and coming from an unresolved point in space. We search for laser emission located 2-7 arcsec from the 2796 target stars. The detectability of laser emission is limited by Poisson statistics of the photons and scattered light, yielding a detection threshold flux of photons m-2 s-1 for typical Kepler stars and 1 photon m-2s-1 for solar-type stars within 100 light-years. Diffraction-limited lasers having a 10-meter aperture can be detected from 100 light-years away if their power exceeds 90 W, and from 1000 light-years away (Kepler planets), if their power exceeds 1 kW (from lasers located 60-200 AU, and 2000-7000 AU from the nearby and Kepler stars, respectively). We did not find any such laser emission coming from any of the 2796 target stars. We discuss the implications for the search for extraterrestrial intelligence (SETI).
1 Introduction
During the past 65 years, the search for extraterrestrial intelligence (SETI) has proceeded with innovative attempts to detect the generation of light from civilizations residing elsewhere in the universe, e.g., (Cocconi & Morrison 1959; Drake 1961; Tarter 2001; Siemion et al. 2013). Searches have been conducted using a variety of wavelengths, most prominently with radio telescopes sensitive to centimeter wavelengths with Arecibo (L band), at 1/10 meter wavelengths with the Greenbank radio telescope, and at centimeter wavelengths with the Allen Telescope Array (Drake 1961; Werthimer et al. 2001; Korpela et al. 2011; Tarter et al. 2011), some targeting arbitrary stars and galaxies and recently aimed toward known exoplanets (Siemion et al. 2013). Searches at optical wavelengths (“OSETI”) have also been conducted, both for continuously transmitting lasers and for sub-s-duration light pulses (Reines 2002; Wright et al. 2001; Howard et al. 2004; Stone et al. 2005; Howard et al. 2007). To date, no convincing evidence of other technological civilizations has been found.
New SETI efforts have begun that employ new wavelengths and achieve greater sensitivity. One search was conducted at mid-infrared wavelengths to detect the waste thermal emission from the vast machinery of advanced civilizations, often called “Dyson spheres” (Wright, J. et al. 2014). Some SETI efforts involve detecting the dimming of starlight as planet-sized technological constructs pass in front of stars (Walkowicz et al. 2014; Forgan 2013). Future SETI efforts will take advantage of the next generation of large radio telescopes, including the Square Kilometre Array (Siemion et al. 2014). There are also proposals to broadcast (rather than just receive) bright beacons as Galactic marquees to advertise our human presence. But international agreements are needed before we compose and transmit brilliant messages moving irreversibly at the speed of light, with unknown consequences (Shostak 2013; Brin 2014). Recently, there has been increased interest in searches for extraterrestrial optical and near-infrared lasers, including those emitting short-duration pulses or periodicities (Howard et al. 2004, 2007; Korpela et al. 2011; Drake et al. 2010; Mead 2013; Covault 2013; Leeb et al. 2013; Gillon 2014; Wright et al. 2014).
The advantages of interstellar communication by optical and IR lasers include the ease in producing high intensity, diffraction-limited beams to transmit over Galactic distances, and achieving relative privacy with high data rates exceeding 1012 bits per second (Townes & Schwartz 1961; Wright et al. 2001). Military and commercial lasers have demonstrated continuous-wave power near 30 kW, and 100 kW power is planned (Lockheed-Martin 2014). Astronomers inadvertently shoot laser beams toward interesting astronomical objects, including exoplanets and the Galactic center, by employing laser guide star adaptive optics on large telescopes with typical power of 7 W. NASA has demonstrated the use of pulsed infrared lasers for Earth-to-Moon communication at a data rate of 622 Megabits per second (Buck & Washington 2013). Optical and IR lasers would also serve for satellite-satellite data transfer. For communication between more distant celestial bodies, optical and IR lasers may be especially useful due to the tight beam, offering enhanced energy efficiency and reduced eavesdropping. In this current paper, we search for laser emission coming from spatial regions separated from stars by tens to hundreds of AUs in projection, where the laser light does not have to compete with the starlight. Section 5 contains a further discussion of the relative strengths of lasers needed for detection by our method.
An advanced civilization might emit many lasers of varying beam sizes, constrained by available optical technology, resulting in unavoidable spill-over at the receiver. The laser light would continue propagating in the original direction, past the intended receiver. The filling factor of such beams in the Milky Way Galaxy is completely unknown. More purposefully, an advanced civilization seeking to indicate its presence to nearby habitable planets might use lasers to offer a bright and unambiguous beacon of its presence. Natural astrophysical conditions exist that allow gas to lase in the near-infrared. But the only observed astrophysically pumped lasers at optical wavelengths occur in non-LTE conditions that produce population inversions in neutral oxygen, causing extraordinary emission at [O I] 8446 Å, (Johansson & Letokhov 2004, 2005). The presence of a bright, unresolved emission line at any other optical wavelength would be worthy of further attention, including the possibility of a non-astrophysical source.
The past 20 years of discoveries of exoplanets motivate a new perspective about SETI. To date, over 1500 exoplanets have been confirmed with accurate orbits, and another 3300 planet candidates have been identified by Kepler as likely real but still need confirmation at the 99% confidence level (Rowe et al. 2014a, b; Mullally 2014; Wright, J. et al. 2011). Stars with known exoplanets make excellent targets for SETI searches, and such planetary systems have already been surveyed for technological transmissions at radio wavelengths (Siemion et al. 2013; Gautam et al. 2014). Planetary systems found by Kepler are particularly valuable for SETI searches because their edge-on orbital planes enhance the probability of our detecting spillover transmissions between planets and satellites within that planetary system111The powers needed to transmit within a planetary system are clearly dwarfed by those needed over interstellar distances..
However, Kepler showed that over 50% of both solar-type stars and M-dwarf stars have planets within 1 AU of the host star (Petigura 2013; Dressing & Charbonneau 2013). Planets smaller than 1.5 Earth-radii are common and often harbor a largely rocky interior (Weiss et al. 2014; Rogers 2014; Wolfgang & Lopez 2014; Marcy et al. 2014). Thus, all FGKM-type stars have comparable value as targets for SETI searches, whether or not they have known exoplanets, as the majority of stars harbor planets of 1-2 Earth-radii within a few AU (Howard et al. 2012; Petigura 2013). Only binary stars separated by less than a few AU are probably poor sites for SETI searches, due to a lack of stable planetary orbits. Otherwise, planets with liquid water may permit progressively complex organic chemistry toward the nucleotides and duplication of RNA within fatty acid proto-membranes (Adamala & Szostak 2013; Szostak 2012).
In Section 2 we describe the selection of target stars and the spectroscopic instrumentation to detect optical laser emission lines. In Section 3 we describe our laser line detection algorithm. In Section 4 we present the results of our search for laser lines and in section 5 we specify the detection thresholds of laser emission and the strength of transmitters to which we are sensitive. Finally, in Section 6 we offer a discussion of the results in the context of the extraterrestrial transmission of laser beacons.
2 Target Stars and Spectroscopic Search for Laser Emission
2.1 Target Stars
All 2796 target stars in this search for laser emission were stars for which high resolution spectra had already been obtained at the Keck Observatory as part of a study of their exoplanets. There were two populations of target stars drawn from our two broad exoplanet programs. The first population of targets stems from the California Planet Search (CPS) that continue to make repeated Doppler measurements of over 3000 FGKM main sequence stars brighter than Vmag = 8.5 and northward of declination -25 deg, ongoing for the past 10-20 years, using both the Lick and Keck Observatories (Fischer et al. 2014; Howard et al. 2014; Marcy 2008; Wright, J. et al. 2011). Numerous papers have been written about the detections and properties of the exoplanets found among these 3000 stars, e.g., (Marcy 2008; Johnson et al. 2011; Howard et al. 2014). Roughly 10% of these stars have known planets detected by the RV method (Cumming et al. 2008; Howard et al. 2010). All M dwarfs brighter than Vmag=11 are also being followed typically with several Doppler measurements per year. The CPS exoplanet survey continues primarily with the Keck 1 telescope now that the iodine cell at the Lick Observatory 3-m Shane telescope has been retired.
For the second population of targets, we had taken spectra with the Keck 1 HIRES spectrometer of all 1100 Kepler Objects of Interest (KOI) that are brighter than Kepmag=14.2. We also have spectra of another 200 fainter KOIs that harbor 4, 5, or 6 transiting planets. These 1300 KOIs are predominantly FGKM main sequence stars identified by Kepler as likely harboring one or more planets, and over 90% of them have real planets, as opposed to false positives (Morton & Johnson 2011). Nearly all of the multi-transiting planet systems are already confirmed as real planets (Lissauer et al. 2014; Rowe et al. 2014a). A list of these KOIs and measurements of each star’s effective temperature (Teff), surface gravity (log g), iron abundance ([Fe/H], and projected rotational velocity (Vsini) are provided by (Petigura 2015; Howard et al. 2015).
Most spectra were taken with an exposure meter that stopped the exposure when a pre-set number of photons was received per pixel, with the typical goal of achieving a signal-to-noise ratio in the reduced spectrum of 100-200. The resulting exposure times varied from 1 to 45 minutes to accommodate the factor of 100 range in brightnesses of the target stars, which in turn depend on their intrinsic luminosity in visible light and their distance. The entrance slit of the HIRES spectrometer was oriented perpendicular to the horizon using an optical image rotator. Thus, the orientation of the slit was neither N-S nor E-W in equatorial coordinates, but depended on the Hour Angle at the time of observation and the Declination.
These spectra of 3000 main sequence and subgiant stars offer a fresh opportunity to search for pulsed and continuous optical laser emission. We carried out a similar search for unresolved laser lines in HIRES spectra on a small subset of the stars surveyed here (Reines 2002). Our present sample of stars is much larger, including KOIs, and the laser-line search algorithm is greatly improved, operating on raw CCD images rather than reduced spectra.
The first target population of nearby FGKM stars are brighter than Vmag=11, with most brighter than Vmag=8.5. The typical exposure times to obtain the spectra were 1 minute at Vmag=7 and 8 minutes at Vmag=10, varying by factors up to three depending on clouds and seeing. The Kepler target stars typically have () forcing exposure times of 20 - 45 minutes, depending on brightness, clouds, and seeing. The longer exposure times of the fainter population of stars permits detection of laser emission arriving with lower flux at the Keck telescope to achieve requisite integrated photons for detection (see Section 5). We also obtained spectra of a small number of nearby galaxies, supernovae, and planetary nebulae motivated by isolated projects of special interest.
In this work, we only examined those spectra (of the two populations of stars) obtained with the 14x0.87 arcsec, “C2”, entrance slit at the HIRES spectrometer. The long 14 arcsec slit enables examination of the region angularly near the star (“sky”) to detect laser emission with no competition from the star’s light. No filters were used during the exposures, notably the KV370 filter that removes the light shortward of 370 nm was not used. A small amount of UV light from second-order diffraction off the cross disperser leaks onto the CCD longward of nominal 600 nm (300 nm, second order). Many observations used here had the iodine cell in place, but this does not affect the search for laser lines displaced spatially from the star.
We have a total of 14,380 spectra of 2796 stars obtained with that C2
decker, with many stars having multiple spectra of them taken between
2004 and 2014. The 2796 target stars are composed of 1,368 KOIs with
the remaining targets being nearby FGKM stars on the CPS
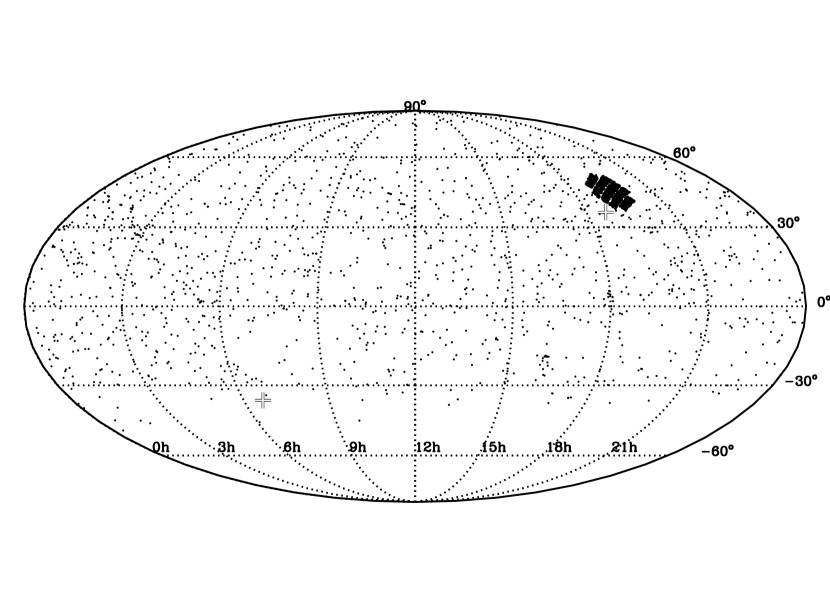
exoplanet program, and some additional planet searching targets. Figure 1 shows the location
of all 2796 target stars for this SETI search, in the domain of their
coordinates, RA and DEC. The figure shows that target stars are
located at all RA and are mostly north of DEC -30 deg. There is a
concentration of 1368 targets in the Kepler field of view between RA =
19-20 and DEC = 35-50 deg.
2.2 HIRES Spectrometer setup
All 14,380 spectra were obtained with the HIRES spectrometer on Keck 1 (Vogt et al. 2014). The spectra span wavelengths 3640 and 7890 Å split among 49 spectral orders that fall on three 2048 by 4096 pixel CCDs. The separation of the spectral orders varies from 6 arcsec in the near UV to 43 arcseconds in the far red (Griest et al. 2010; Vogt et al. 2014). In order to diminish the CCD readout time, three CCD pixels are binned in the spatial dimension on chip. The spectral resolution (FWHM, , of the instrumental profile) is =60,000, i.e., 5 km s). Each pixel spans 1.3 km s in the wavelength direction and 0.38 arcsec (after binning) in the spatial direction.
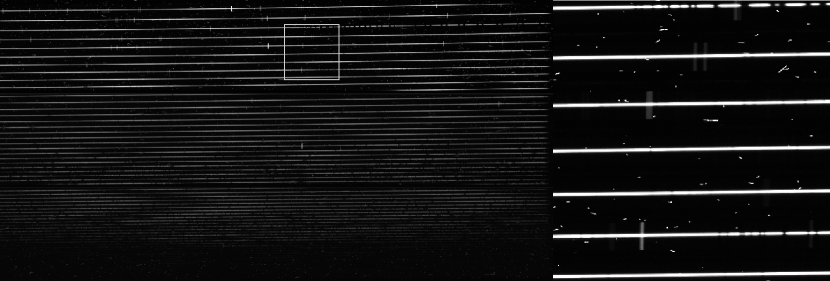
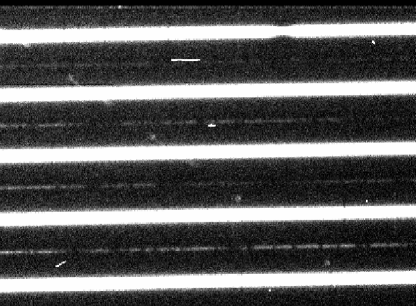
The search for laser lines was performed on the raw CCD images, not the reduced spectra. We specifically searched for laser emission in the spatial region between 2-7 arcsec from the star in both directions along with length of the slit. All raw CCD images of the spectra use here are available to the public at the Keck Observatory Archive. We show one example of the raw CCD image in Figure 2. The use of a long 14x0.87 arcsec C2 entrance slit placed a spectrum of the “sky” on either side of the star, making it possible to probe that sky for laser emission coming from nearby region of the star with little contamination from the starlight itself. In this paper, ”rows” denote pixels along the direction of the dispersion of the spectrum and “columns” denotes pixels along the spatial direction perpendicular to dispersion, as shown in Figure 2.
2.3 Laser Emission Properties
We define properties of “laser emission” for this search as sources located so far away that they would be spatially unresolved as viewed by the Keck telescope on Mauna Kea, corresponding to an angular size smaller then 0.8 arcsec, which is set by the atmospheric seeing. Any laser-emitting machine having a projected size of would be unresolved if located at a distance greater than, . Machines with sizes measured in tens of meters would obviously be unresolved at the distances of the nearest stars. We restrict our search to such spatially unresolved sources.
We also define “laser emission” to be emission with a linewidth negligible compared to the resolution of the spectra we obtained with Keck HIRES, . Here, is the FWHM of the typical instrumental profile of HIRES as used here. For comparison, typical modern continuous wave (CW) lasers have linewidths limited by the coherence length, the Doppler effect of the atoms, and the mechanical stability of the laser cavity, yielding linewidths smaller than 1 GHz, i.e. monochromatic with , rarely reaching the fundamental quantum Schawlow-Townes laser linewidth of under 1 kHz. (Pulsed dye lasers have much broader linewidths.) For reference, HeNe lasers with wavelength 632.8 nm and a linewidth of 1MHz ( nm) are commercially available and unresolvable by the HIRES spectrometer. As another reference, a typical CW laser guide star for adaptive optics systems has an output power of 20 W and operates at the blueward sodium D-line at a wavelength, =589.1 nm, and a linewidth of 5 MHz, many orders of magnitude narrower than resolvable by HIRES. Thus, a necessary condition to be deemed “laser emission” here is a line width narrower than HIRES can resolve. Any actual extraterrestrial lasers with linewidths greater than the resolution of HIRES will not be identified in this search. Such broadband signals could arrive from technological civilizations, but this current work will not detect it. Any such technological broadband emission is more difficult to distinguish from the kinematically or thermally broadened lines from naturally occurring astrophysical sources.
Any laser source spatially separated from the star by more than the seeing disk radius in the spatial direction will appear in the telescope focal plane as a separate, unresolved image that will not overlap with star light. We thus focus our attention here on portions of the spatial profile separated from the star by the seeing profile. As the seeing is typically 0.8 arcsec at optical wavelengths at Mauna Kea, we are examining here the 4.5 arcsec of slit real estate commonly called “sky”, located more than 2 arcsec away from, and on either side of, the stellar spectrum. A potential laser would be effectively a point source in space and wavelength. We expect it to appear on the raw CCD image as a “dot”, with a two-dimensional point spread function (2-D PSF) shape corresponding to the seeing disk in the spatial direction and to the spectral instrumental profile of HIRES in the wavelength direction. Such dots would appear in the “sky” region of the slit image where typically only a few photons hit, allowing the laser to stand out against that faint background. A pulsed laser would also be detectable as a dot, provided the pulse duty cycle and pulse energies produced a time-averaged power sufficient to yield the threshold photons during an exposure, as described in Section 5.
2.4 Specifying the 2-D PSF of Candidate Laser Lines
We search for laser emission by examining the three “raw” CCD images written by HIRES after each exposure. We do not use reduced spectra. This allows us to search for laser emission “dots” consistent with the shape of the PSF both spatially and spectrally, as defined above in Section 2.3. This two-dimensional search is one key difference between this work and the earlier effort (Reines 2002), which made use of reduced spectra and therefore did not benefit from spatial PSF information. In addition, by retaining the spatial information, we more easily distinguish unresolved laser sources from spatially resolved sources such as nebulae, extended galaxies, and night sky emission lines.
In broad outline, our algorithm treats each observation separately by measuring its PSF in both the spatial and spectral directions as described in Section 3. The code then steps pixel-by-pixel along the “sky” pixels located spatially adjacent to stellar spectral order and performs diagnostics on subimages to identify laser line candidates.
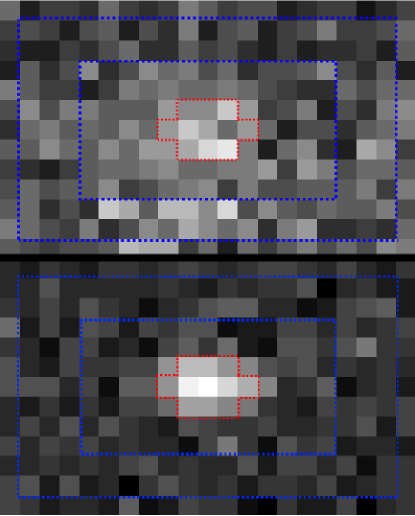
The point spread function (PSF) is modeled as a 2-dimensional Gaussian in the spatial and wavelength directions, as shown in Figure 3. The spatial and wavelength full-width-half-maxima (FWHM) are set by measuring the average FWHM of the spectral orders containing the stellar spectrum and the average FWHM of the telluric night sky emission lines at various wavelengths, respectively. The FWHM in both directions varies by 5-10% over the echelle spectrum format due to the performance of HIRES optics over the entire echelle field of view. This variation plays only a minor role in our criteria for goodness-of-fit of any detected laser lines due to our relaxed standards for accepting candidate laser lines, as described below.
The FWHM of the spatial profile varies by 6, RMS, over the echelle format in a given exposure due mostly to camera optics. Of course the spatial profile changes greatly from hour to hour and night to night as atmospheric seeing conditions vary. We account for this variability by measuring the width of the stellar spectrum over the echelle format in each exposure. We measure the spatial FWHM in 10 evenly spaced locations within each spectral order. At each location we bin 11 columns 222Columns containing outlier count levels, often due to cosmic rays, are identified and ignored in the binning. We then fit a Gaussian to the resulting binned spectrum, and obtain a value for the FWHM at the location. The result is a set of 10 FWHMs for each spectral order. To get the local FWHM within an order, we linearly interpolate between the ten points. The error imparted by the linear interpolation is less than a percent, and is accounted for later in Section 3.1.
The FWHM of the instrumental profile in the wavelength direction is measured from night sky emission lines that are intrinsically unresolved at our resolution of . We use the atmospheric [OI] lines at 6300Å and 5577Å, which are present in all observations, are quite bright, and vary in FWHM by less than a few percent from night to night due to our vigilance focusing the HIRES spectrometer. These night sky lines provide an acceptable proxy to a delta function in wavelength, as their line widths are well below the wavelength resolution achieved by HIRES (Osterbrock 1996). To characterize the FWHM in wavelength, the rows containing the night sky lines are binned together (less those with significant contributions from either the stellar spectrum or cosmic ray hits). A Gaussian is then fit to the resulting binned vector. The average of these two values for the FWHM - at 6300Å and 5577Å - provide an approximation to the FWHM of the instrumental profile on a given night. Some other atmospheric lines on the redder end of the spectrum were considered for use, but most of them have greater variability in their brightness and they change with time of day and season. Nonetheless, the FWHM of the instrumental profile varies by 10% over the echelle format due to the normal optical performance over the full field of view, and we account for this variation in Section 3.1.
Rather than construct a 2-D PSF anew for each wavelength region, we generate a small set of PSFs that vary in the spatial direction, as observed. As we scan the CCD for laser emission, we draw from a library of PSFs rather than generating them anew at each location. While there is some loss of precision by drawing PSFs this way, we tested the loss of detectability of laser emission that we incur and found that the loss in sensitivity was marginally significant due to our use of simplified PSFs.
2.5 Location of the Stellar Orders
We aim to search for laser emission that is spatially separated from the stellar image. Each spectral order on the CCD has a width set by the size of the stellar image, set by the atmospheric seeing during the exposure. Thus, for each image we had to determine, to within one pixel, the locations of the ridge and the width of each spectral order containing the starlight. We aim to analyze only the “sky-illuminated” portions of the CCD that have no stellar light but may contain laser light. We ignore, of course, those CCD pixels between the orders on which no “sky” light falls, as no laser light could hit them either. That is, the slit image does not extend over the entire CCD region between each order for all wavelengths longward of 5500 Å.
To locate the ridge and width of the orders containing stellar light we first perform a 3x3 median filter on all three CCD images. This removes cosmic rays 333Cosmic rays usually hit in one or a few pixels, and only sometimes do they raise the counts in more than 4 pixels within a 3x3 region. Note that the 3x3 median filter was used exclusively for the location of the stellar ridge, and was not retained for the subsequent pixel-by-pixel laser search., ensuring that the ridge of the stellar spectrum has the most photon counts along the order. To find the ridge of each order we bin each set of 10 columns and identify the row having the maximum value.
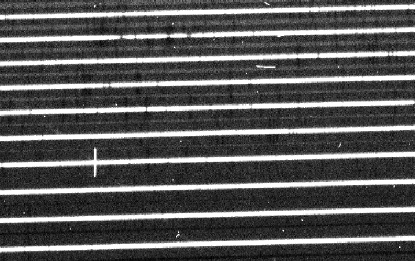
The locations of the orders vary by less than a pixel from observation to observation due to our consistent optical set-up of the gratings in the HIRES spectrometer and our accurate guiding of the star image on the entrance slit. We perform a constrained linear interpolation between these ridge locations to establish the approximate location of each spectral order. We avoid searching for laser lines within from the ridge of the stellar order, to avoid contamination from stellar continuum light. Figure 4 shows the geometry of the orders and the region between them.
Shortward of approximately 5500 Å, the slit images of the starlight overlap between the orders. We use our determination of the spatial profile to anticipate such regions that must be avoided in the search for laser lines. There simply are no “sky” pixels in between non-overlapping orders , so these regions of the CCD were ignored in the search for laser lines. For spectral orders close enough spatially to each other that they have overlapping “sky”, we do search for laser lines in that sky region, as shown in Figure 4. In such cases, we cannot determine which order and which of the two corresponding wavelengths is associated with any laser line we may detect.
2.6 Telluric Lines and Artifacts
Terrestrial nightglow emission lines from the night sky (such as [OI] 5577.3 and 6300.3 Å) are too bright to permit detection of laser lines and they can fool our algorithms designed to search for laser lines, especially on their edges. We also ignore a large artifact in the raw HIRES images, a diagonal stripe that runs through the center of the middle CCD known colloquially as the “Meteor” 444the Meteor is actually scattered light dispersed twice by the spectrograph (Keck Observatory 2006).
On the other hand, faint night sky emission lines often are sufficiently bright to fool our laser-line searching algorithms, producing an apparent signal-to-noise ratio and partial shapes at their ends (” from the center of the stellar spectrum). Such faint night sky lines often meet the PSF criterion in the wavelength dimension, and can marginally match the criterion in one spatial direction, at the spatial edge of night sky line. This, coupled with Poisson fluctuations in the brightness and in the background count levels, can cause the ends of night sky lines to be identified erroneously as candidate laser lines.
We ameliorate this problem in two ways. First, we compare pixel locations to a catalog of OH and O2 night sky lines at Mauna Kea (Osterbrock 1996). In order to not miss any, we convolve the CCD images with a 2-D Gabor filter oriented in the direction of the night sky lines, and omit results from wavelength values with large spatially oriented signal. The latter technique is necessary, as the laser search pipeline is sensitive enough to pick out faint night sky lines, and not all lines are present in all observations.
3 Identifying Laser Lines by S/N and
To detect candidate laser emission lines in the “sky” region of the CCD adjacent the stellar spectrum we constructed a routine that steps pixel by pixel across all three CCDs searching for emission with the requisite PSF properties described in Section 2.4. We construct “postage stamps” with typical sizes of 11 x 19 pixels (spatially and in the wavelength direction, respectively) centered on each pixel, and we search for emission that meets specified criteria within each stamp. A representative postage stamp on the CCD is shown in Figure 3. We describe below the two null hypothesis “gates” by which we rule out prospective laser emission lines, involving a requisite S/N ratio for the emission and goodness-of-fit criterion for its PSF shape.
The first gate to be passed by the pixel and its postage-stamp neighboring pixels tests the signal-to-noise ratio (S/N) of the prospective laser line. We establish a S/N threshold such that fluctuations in the arrival of background photons are unlikely to rise to a high S/N threshold. The major sources of “counts” in a pixel are bias, dark counts, readout noise, scattered light in the spectrometer, background sky light, and laser emission, if any.
The bias, dark counts, and readout noise are easily determined, in total, for each postage stamp by measuring the observed fluctuations. This “noise” is measured by the RMS of the counts in the pixels around the perimeter of each postage stamp, computed as follows:
| (1) |
where the is the number of photons in the ith pixel of the perimeter region, is the number of pixels in the perimeter region (typically 100-200 pixels, see Figure 3), and is the mean value of the number of photons in these pixels. We define to be the median value of the number of photons in the perimeter region. We adopt the RMS in Eqn(1) as the noise in each pixel contributed by the background fluctuations, bias, dark, readout noise, scattered light in the spectrometer, and sky brightness. The typical RMS is 2-3 photons per pixel.
This background noise is adopted for each pixel within the signal region, the interior of the postage stamp, defined as the pixels in the model PSF containing 95% of the counts. The number of pixels in the signal region ranges from 11 to 25 pixels depending on seeing. The total counts above the background in the signal region are given by
| (2) |
where the number of photons in the ith pixel of the signal region, is the number of pixels in the signal region (typically 11-25 pixels).
We define a metric of the signal-to-noise ratio, “S/N”, of the laser emission signal as,
| (3) |
with the and defined as above. Hence our S/N is the ratio of the total number of photons above background within the signal region to the quadrature-summed noise expected in the signal region, which has contributions from background fluctuations in each pixel and from Poisson fluctuations in the signal. This is not a precise signal-to-noise ratio, as we assume Gaussian distributed background fluctuations. As the total number of counts of the laser grows, loss of precision from the Gaussian background assumption is quickly dwarfed by poisson fluctuations in the signal. The goal is not to compute an accurate signal-to-noise ratio of the prospective laser emission signal. Rather it is to compute a quantity that is sufficiently close to the signal-to-noise to identify and rank-order prospective laser emission signals based on their standing above the noise, motivating follow-up analysis and observations to assess reality of the signal.
We establish a second metric for the laser emission based on a goodness-of-fit to the known 2-D PSF. We compute a reduced by fitting the photon counts within the postage stamp with the previously determined 2-D PSF, serving as the model, with the only free parameters being the position of the PSF. We use the same pixels in the postage stamp that were used to compute the S/N. We scale our model PSF to have the same total photon counts as observed in the postage stamp image. When computing reduced , we allow only the position of the PSF model to adjust to the observed photon counts in their respective pixels. We compute the reduced as
| (4) |
where and are the photon counts in the th pixel of postage stamp region and of the PSF model, respectively, and the associated uncertainty for each pixel. Here, denotes the number of degrees of freedom, in this case the number of pixels used in the sum, minus three fitted parameters: the x-y position of the 2-D PSF model and the total number of photon counts. Subpixel sampling would have allowed for greater precision, but was not employed in this algorithm. The reduced statistic is a sufficient goodness-of-fit metric for this application, as the PSF model is locally linear in the pixel location (Andrae et al. 2010).
3.1 Setting Thresholds in S/N and
We adopt the detection criteria for laser emission by demanding that the S/N be greater than some threshold and that for the fit to the 2-D PSF be near unity, below some threshold. That is, we test the null hypothesis that there is no convincing laser emission within each postage stamp. The null hypothesis can be rejected if the S/N resides above some threshold and the statistic is less than some threshold, to be determined as follows.
To establish thresholds for S/N and , we tested the ability of our code to pick out simulated laser lines over the entire format under many conditions. We adopted a strategy of injection and recovery of laser emission. We randomly selected actual observations and inserted synthetic laser lines composed of the 2-D PSF with superimposed Poisson fluctuations. We injected fake laser emission “dots” having varying S/N, different locations within the echelle spectrum format on the CCD, and modest (10%) variations in the 2-D PSF to simulate the actual variability of the PSF from that adopted. These injected fake laser emission 2-D PSFs revealed the distribution of values of S/N and that the code detected. We also learned the number of false positives per image that results from Poisson fluctuations.
We found that our algorithm incurred a steep rise in false positives for S/N less than 7, which corresponds to 100 photons in the laser signal, after including noise from the background. Nearly one false positive per image occurred with S/N at 7 or greater, clearly indicating that we could not drop the S/N threshold to lower values without incurring a rapid increase in false positives.
Injecting fake laser emission right at this threshold of S/N=7, our tests showed 99% of simulated lasers had , and we had a false positive rate of approximately 0.1 per observation, with each observation containing pixels considered as the center of the laser line 555To those familiar with signal-to-noise thresholding, a false positive rate of 0.1 per 3 million observations seems very high for signal-to-noise of 7. This is an effect of the actual noise variance of all sources of noise within a postage stamp region, captured by the noise measure around the perimeter given in Equation 1..
We tested the effect of the code miscalibrating the 2-D PSF, and found only a small rise in (see Table 1). Changing the simulated 2-D laser profile by as much as 30% in both dimensions still maintained, on average, below 2, for S/N below 10. Similar tolerance was seen for simulated lasers centered with sub-pixel precision. The worst case was a simulated laser situated at the intersection of four pixels, in which cases the mean in rose no higher than 1.2 for S/N below 10.
The discrepancies in caused by a miscalibrated 2-D PSF and from untreated sub-pixel displacements in the laser line grow with increasing S/N. A laser line containing hundreds or thousands of photons will have small associated fractional Poisson errors compared to weak laser lines. Any mismatch between the actual 2-D PSF and the adopted model 2-D PSF can cause the value of reduced to be much greater than unity simply due to the adoption of a model PSF different from the actual PSF. We accounted for such errors in the model PSF by artificially increasing the adopted noise (above Poisson) associated with the number of photons per pixel. We set a lower bound on the uncertainty in the noise at 20% of the number of detected photons per pixel.
Thus, in equation 4, we have which is the greater of and . While approximate this floor in the uncertainty ensured that even an observed laser line having twice the FWHM in both the spatial and wavelength directions as the adopted PSF model along with would be detected. For laser signals exceeding , we set a new threshold of . While this threshold is high in light of the lower bound on , the relative paucity of postage stamps with resulted in a manageable number of candidates. The advantage is that prospective laser emission lines containing hundreds or thousands of photons will be identified by our search algorithm, even if the FWHM of the PSF model is wrong by a factor of two. That is, strong laser lines will be detected independent of the integrity of the 2-D PSF.
4 Results
Using the algorithm described in Section 3, we searched 2796 target stars for laser emission in the wavelength range, 3640-7890 Å located in the “sky” region between 2-7 arcsec from the star image along the entrance slit. Two criteria defined a detection of a candidate laser line as described in Section 3. The signal-to-noise of the photons (above background noise sources) had to meet the threshold, S/N7.0, corresponding to 100 photons collected within the 2-D PSF of the Keck-HIRES spectrometer. Also, the goodness-of-fit to the 2-D PSF in the wavelength and spatial direction had to meet 2.5.
Using these thresholds, we found 10,155 candidate laser emission lines with S/N between 7 and 10, and another 5449 candidates with S/N above 10. Of those with S/N 10, 3570 candidates had indicating an acceptable match with the 2-D PSF. The ensemble of 15,604 laser-line candidates were subsequently analyzed by eye to rule out those clearly inconsistent with a 2-D PSF shape. We rejected candidate laser lines that were clearly caused by instrumental artifacts such as from the location of the laser line at the edge of a spectral order or the CCD detector, flaws in the optics of the spectrometer (i.e. internal reflections, 2nd-order light from cross disperser), flaws in the CCD detector (“hot” pixels), or bleeding of charge on the CCD. We also rejected candidate laser lines as false positives due to atmospheric effects such as night sky emission or to astrophysical effects (spatially extended nebulae). This rejection process left a mere eight candidate lasers that survived, all being consistent with the 2-D PSF and thus could be true laser emission from unresolved sources.
Each of these eight surviving laser candidates was analyzed again, even more carefully by visually inspecting the raw CCD image. We looked for patterns of similar signals that were scattered spatially in some linear or periodic fashion, either among neighboring spectral orders or along the wavelength direction (within a few hundred pixels). Such regular patterns are caused by internal reflections or “ghosts” within the spectrometer (see Figure 4). These instrumental effects can change from night to night due to slight repositioning of the optics. Only by viewing the candidate laser line with several levels of magnification (number of pixels in field of view) was it possible to see the instrumental pattern. In the case of HIP94931, of which we have more than 160 spectra, nearly PSF-shaped candidates appeared and disappeared from observation to observation, and only by noting a set of collinear faint dots from order to order was it possible to rule them out as candidate lasers (see Figure 5). This is an example of one of the “ghosts” described above. In addition, though the area between the orders was being ignored, in a few cases the second order UV light from the cross disperser fell right between the orders in the red CCD (at exactly 2x the wavelength). Our code was fooled by such 2nd-order light in a few cases, as shown in Figure 5.
We ruled out seven of the eight laser candidates as artifacts, described above. Also, for seven of the eight stars, we had obtained multiple spectra. This allowed us to examine the same pixel location (i.e. wavelength) to see if the laser emission occurred in earlier or later exposures. Such examinations allowed us to identify artifacts that were instrumental, even if recurring. Finally, we also ruled out one laser candidate that was simply a spectrum of a known planetary nebula angularly nearby the star being observed.
Thus, none of the eight candidates survived this more careful examination. Therefore, our search of 14,380 spectra of 2796 different stars did not reveal any convincing evidence of laser emission between 2 and 7 arcsec from the target star.
5 Detection Thresholds of Laser Emission
We now translate our detection thresholds of laser lines to the photon fluxes at Earth, and to the luminosities of the lasers themselves, that would have been detected. Our imposed threshold of S/N7 sets the limit on the strengths of the signals we deem candidate laser emission. We use Equation 3 to compute the S/N ratio of the prospective laser signal, accounting for both the Poisson fluctuations in the candidate laser photons and the fluctuations in the background noise. This S/N threshold of 7 requires that 100 photons from the laser ( in Equation 3) be acquired during the exposure to be deemed a candidate laser signal. The value of 100 photons varies by in different spectral regions and different observations, depending on the specific background noise level from scattered light and the sky.
We compute the corresponding laser flux at the Earth by considering the effective collecting area of the Keck 1 telescope, 76 m2, and the efficiency of the telescope and HIRES spectrometer, 5%, which depends on the seeing and includes photon losses in the telescope optics, the spectrometer, the entrance slit to the spectrometer, and the quantum efficiency of the CCD detector (Griest et al. 2010; Vogt et al. 2014). Thus, to detect the threshold 100 photons at the CCD detector requires that 26.3 photons per square meter fall on the primary mirror during the exposure.
We now consider exposure times that represent those used to obtain the spectra in this study, ranging from 1 min (for Vmag = 7) to 45 min (for Vmag = 13). (Note that the S/N per pixel in the stellar spectrum achieved at Vmag = 13 is less than that achieved at Vmag=7.) For exposures of 1 min, the threshold photon flux from the laser required to detect 100 photons is 0.44 photons m-2 s-1. For exposures of 45 min, the threshold photon flux to achieve 100 detected photons is 0.010 m-2 s-1, a remarkably low flux.
One may easily write these photon flux thresholds, , in terms of the power of the laser, , the laser light frequency, , and the distance, , from the laser to Earth:
| (5) |
Here, is the full opening angle of the diverging laser beam (in radians). As a benchmark example, we consider “Keck-to-Keck” laser transmission and reception. We consider a 10m diameter, diffraction-limited laser transmitter (in vacuum, outside any atmosphere) detected by the Keck 10m telescope and HIRES spectrometer. We adopt the normal Raleigh criterion for the beam divergence angle, . Here, is the laser wavelength and is the diameter of the diffraction-limited laser emitter. A diffraction-limited laser itself has a narrower beam “waist” leading to an intensity pattern having a characteristic angular beam size given by . For = 550 nm near the middle of our wavelength sensitivity, and a 10m emitting aperture, the beam divergence angle is .
It is worth noting that such a laser concentrates its power into a beam so narrow that its flux at Earth is 10 brighter than an isotropic source of the same power and distance. Moreover, its monochromaticity delivers that energy within a narrow wavelength range, 10-4 of the wavelength width of the typical stellar spectral energy distribution. Thus, laser transmission from a 10-meter aperture achieves a detectability boost over a stellar spectrum of a factor of 1019. For example, as Sun-like stars have luminosities of 3.8 W, a diffraction-limited laser with a power of only 4107W will deliver a light flux (at its wavelength) outshining the host star. But, the laser must be aimed at the Earth.
To continue the benchmark example, we adopt laser power similar to that of existing laser guide star systems, which is 7 W at the Keck Observatory (albeit at a wavelength of 588.995) nm. We consider a benchmark distance of 10 ly, representative of the nearest dozen stars. A 60s integration time (typical of our exposures of nearby stars) yields 160 photons detected by our CCD, implying a S/N ratio of 9.0-11.5 depending on seeing and local background noise RMS. Thus, we would detect a 7 W laser located at a distance of 10 light years, as it would sit well above our detection threshold of S/N=7.
As mentioned in Section 2.2, the exposure times of the two major populations of target stars depended on visual magnitude. For stars brighter than Vmag = 10, we stop exposures when the exposure meter attains 250,000 “counts” (on an arbitrary scale), representative of the nearby star target population. We stop exposures for fainter stars, such as the Kepler stars, when the exposure meter attains 60,000 counts. As the majority of targets are main sequence FGKM stars, the laser power from Kepler stars would need to be about four times as high as from the nearby stars to be detected, i.e., the greater (45 min) exposure times for the Kepler stars is still 4x too small to make up for their greater distance.
We consider here the laser power required to reach a threshold S/N ratio of 7, requiring 100 photons as previously discussed, for the two representative populations of stars. The average nearby star in our survey resides at a distance of typically 30 pc = 100 ly and the typical exposure time is 5 min. For these nearby stars, the required laser power for a threshold detection is 90 W. The Kepler target stars reside at a distance of 300 pc and the typical exposure time is 45 min. Thus for the Kepler stars, the required laser power for a threshold detection is 1 kW.
Our initial pass at detecting laser lines suffered from an upper bound in detectability at a S/N ratio of 400, due to saturation of the CCD in some pixels at this exposure level. We overcame this by carrying out a second pass that permitting any high photon level, including saturation. No such saturated laser line candidates were found.
6 Discussion
The power, beam dispersion, and distance to a continuous-wave laser determine its detectability with the HIRES spectrometer on the Keck 1 telescope for the 2796 stars observed here. A transmitting extraterrestrial civilization could produce a detectable laser signal by any combination of the size of their diffraction-limited optics and the power of their laser. Narrower laser beams concentrate their intensity but obviously require more precise pointing for our telescopes to intercept the beam, and laser tracking precision becomes more important. The Keck-to-Keck case considered above demands laser pointing accuracy of 10 milliarcseconds, set by the diffraction-limited beam size, a pointing accuracy achieved with current spaceborne telescopes and avionics. Advanced civilizations could presumably have similar, if not better, pointing ability and laser technology.
Our Keck-HIRES experiment achieves sensitivity to remarkably low photon fluxes of 0.4 m-2 s-1 in a 1 minute exposure and proportionally lower thresholds for longer exposures. There are many configurations of the laser source parameters that would allow for detectability at Keck with required laser power at kilowatt levels from distances over 1000 light years. At such distances, extinction of optical light due to interstellar dust is only a few tenths of a magnitude in V band, decreasing the laser fluxes at Earth by no more than 50%. Thus extraterrestrial lasers of kilowatt power easily permit detection from distances of 1000 light years.
Such kW laser power is routinely achieved with present technology. The Keck 1 Laser Guide Star AO system has a power of 7 W, only an order of magnitude too weak to be detectable at the typical distances of the nearest 1000 stars, even if the beam width were diffraction limited. But many current lasers are far more powerful, easily detectable if emitted from the distances of our 2796 target stars. Commercially available YAG (yttrium aluminium garnet) lasers have a power of 125 W operating at a wavelength of 532 nm, easily detected by Keck-to-Keck transmission and reception (Laserfabrik 2012). Similarly, the US Navy has deployed 100 kW solid-state chemical iodine lasers working in the near-IR for use on combat vessels, which, while not in the wavelength band explored here, would be detectable at Earth with even modest beam width and pointing accuracy(Lockheed-Martin 2014). Considering another civilization’s technical advancement relative to our own during just 100-1000 years, the required laser power of kW levels seems within expectation.
We may compare our current technique for laser detection with the past searches for optical pulsed-lasers (OSETI). Such searches are sensitive to very short pulses consisting of several photons during a nanosecond pulse time scale. Their domain of strength over our method is in the detection of isolated optical laser pulses that are briefly (during a few ns or s) brighter than the host star. As a modern example, the proposed NIROSETI experiment (Maire et al. 2014; Wright et al. 2014) at the Lick Observatory 1-meter Nickel telescope will be sensitive to 40 photons in the near-IR per square meter arriving in a pulse of width 0.5 ns. At Keck, a single such pulse falling on the Keck telescope during an exposure yields 150 photons incident on the HIRES CCD detector, a greater number of photons than with NIROSETI due to the large aperture of the Keck telescope. The 150 photons from just one ns pulse is easily detectable with our method, provided the signal does not have to compete with the star’s flux. If the telescope picks up many such pulses, contained perhaps in a train, the laser signal would be even more detectable with our method. In a five minute exposure, pulse cadences of Hz, kHz, and MHz would strengthen the signal as detected by our method, due to the multitude of photons.
One caveat in our work bears emphasis. Our examination of over 2796 stars for unresolved laser emission was done by avoiding examination of the sky region within 2 arcsec of the star itself. We explicitly searched for laser signals that were resolved spatially from the target star, given the typical seeing profile having FWHM of 1 arcsec. The actual separation necessary to resolve the laser line ranged from approximately 5 pixels (2 arcsec) from the center of the stellar spectrum, to as many as 10 or 12 pixels (3-4 arcsec) on nights of exceptionally poor seeing. For each spectrum of each star, the spatial width of the spectrum determines the closest angular separation from the star, typically 2-3 arcsec. Clearly this “inner working angle” of 2-3 arcsec constrains the physical distance of any detectable lasers from the target star, typically 10-100 AU for the nearest stars. Similarly we can detect lasers located 2000-7000 AU from the Kepler stars.
This restriction on the distance of the laser from the star bears directly on the 10 light-year Keck-to-Keck thought experiment described above. An Earth-analog planet hosting a powerful laser located 1 AU from any target star would reside angularly within the inner working angle of all 2796 of our target stars, leaving such lasers undetected in this current search. In effect, this current search is sensitive to lasers that are associated with technological constructs located many AUs from a star.
In a following paper, we will report on a search for laser emission coming from within the current 2 arcsec inner working angle, i.e. spatially coincident with the stars themselves. The corresponding flux thresholds for detection of lasers will be higher (worse) by roughly two orders of magnitude due to the Poisson fluctuations of the 104 photons per pixel. Similar searches of stellar spectra for laser emission can also be carried out on other existing spectroscopic surveys, such as the Sloan Digital Sky Survey. The technique will work equally well in the infrared, with the added bonus of lessened extinction from dust in the Galaxy. Such extant spectroscopy surveys may lack the resolution to demonstrate the monochromatic nature of the laser emission. However, follow-up observations of compelling candidates could be performed with high resolution spectroscopy to support or reject the interpretation of laser emission. A robust toolset able to search for laser lines in a variety of different telescope spectra would be a useful addition to the SETI community at large.
7 Acknowledgments
We thank the John Templeton Foundation for funding this research. We thank John Johnson and Andrew Howard for the Keck Telescope time awarded to CalTech and to the University of Hawaii and the Institute for Astronomy (IfA) allowing many of these spectra to be obtained. We thank Howard Isaacson for enormous help with the observations, reduction, and organizing target lists. G. Marcy, the Alberts Chair at UC Berkeley, would like to thank Marilyn and Watson Alberts for funding and support that made this research possible. The spectra presented herein were obtained at the W. M. Keck Observatory, which is operated as a scientific partnership among the California Institute of Technology, the University of California, and the National Aeronautics and Space Administration. The University of California Observatories (UCO) provided key support of HIRES and other instrumentation at the Keck Observatory. We thank the state of California and NASA for funding much of the operating costs of the Keck Observatory. The construction of the Keck Observatory was made possible by the generous financial support of the W. M. Keck Foundation. We thank the many observers who contributed to the measurements reported here. We gratefully acknowledge the efforts and dedication of the Keck Observatory staff, especially Scott Dahm, Hien Tran, Grant Hill and Greg Doppmann for support of HIRES, and Greg Wirth, Bob Goodrich, and Bob Kibrick for support of remote observing. This work made use of the SIMBAD database (operated at CDS, Strasbourg, France) and NASA’s Astrophysics Data System Bibliographic Services. This research has made use of the Kepler Community Follow-up Observing Program (CFOP) database and the NASA Exoplanet Archive, which is operated by the California Institute of Technology, under contract with the National Aeronautics and Space Administration under the Exoplanet Exploration Program. The authors wish to extend special thanks to those of Hawai‘ian ancestry on whose sacred mountain of Mauna Kea we are privileged to be guests. Without their generous hospitality, the Keck observations presented herein would not have been possible. We thank Dan Werthimer, Andrew Siemion, Jill Tarter, Frank Drake, Jason Wright, Lucianne Walkowicz, Shelley Wright, John Gertz, Andy Fraknoi, David Brin, Charlie Townes, Mike Garrett, Amy Reines, and Phil Lubin for valuable conversations about optical SETI. We also thank the “Berkeley SETI Research Center” (BSRC) and the “Foundation for Investing in Research on SETI Science and Technology” (FIRSST) for ideas and support toward the future of SETI research.
References
- Adamala & Szostak (2013) Adamala, K & Szostak, J. W. Science 342, 1098–1100.
- Andrae et al. (2010) Andrae, R., Schulze-Hartung, T., & Melchior, P. Unpublished, 2010.
- Brin (2014) Brin, D. 2014, Journal of the British Interplanetary Society, 67, 8
- Buck & Washington (2013) Buck, J. & Washington, D. Release 13-309, NASA, Oct 22, 2013.
- Cocconi & Morrison (1959) Cocconi, G., & Morrison, P. 1959, Nature, 184, 844
- Covault (2013) Covault, C. 2013, APS April Meeting Abstracts, 2002
- Cumming et al. (2008) Cumming, A., Butler, R. P., Marcy, G. W., et al. 2008, PASP, 120, 531
- Drake (1961) Drake, F. D. 1961, Physics Today, 14, 40
- Drake et al. (2010) Drake, F. D., Werthimer, D., Stone, R. P. S., & Wright, S. A. In Astrobiology Science Conference, 2010.
- Dressing & Charbonneau (2013) Dressing, C. D., & Charbonneau, D. 2013, ApJ, 767, 95
- Fischer et al. (2014) Fischer, D. A., Marcy, G. W., & Spronck, J. F. P. 2014, ApJS, 210, 5
- Forgan (2013) Forgan, D. H. 2013, Journal of the British Interplanetary Society, 66, 144
- Gautam et al. (2014) Gautam, A. K. Siemion, A., Korpela, E. J., et al. American Astronomical Society Meeting Abstracts,224:405.06, Jun 2014.
- Gillon (2014) Gillon, M. 2014, Acta Astronautica, 94, 629
- Griest et al. (2010) Griest, K., Whitmore, J., Wolfe, A., et al. ApJ, 708(1):158-170, Jan 2010.
- Keck Observatory (2006) W.M. Keck Observatory HIRES Instrument and Data Format. Online, April 2006.
- Howard et al. (2004) Howard, A. W., Horowitz, P., Wilkinson, D. T., et al. 2004, ApJ, 613, 1270
- Howard et al. (2007) Howard, A., Horowitz, P., Mead, C., et al. 2007, Acta Astronautica, 61, 78
- Howard et al. (2010) Howard, A. W., Marcy, G. W., Johnson, J. A., et al. 2010, Science, 330, 653
- Howard et al. (2012) Howard, A. W., Marcy, G. W., Bryson, S. T., et al. 2012, ApJS, 201, 15
- Howard et al. (2014) Howard, A. W., Marcy, G. W., Fischer, D. A., et al. 2014, ApJ, 794, 51
- Howard et al. (2015) Howard, A. W., Petigura, E. A., Johnson,J.A., Morton,T., & Marcy, G. W. 2015, “Stellar Parameters of 1300 KOIs from SpecMatch and SME-Vanderbilt”, submitted to ApJ.
- Johansson & Letokhov (2004) Johansson, S., & Letokhov, V. S. A&A, 428(2):497-509, Dec 2004.
- Johansson & Letokhov (2005) Johansson, S., & Letokhov, V. S. 2005, MNRAS, 364, 731
- Johnson et al. (2011) Johnson, J. A., Clanton, C., Howard, A. W., et al. 2011, ApJS, 197, 26
- Korpela et al. (2011) Korpela, E., Anderson, D., Bankay, R., et al. Instruments, Methods, and Missions for Astrobiology XIV, Sep 2011.
- Laserfabrik (2012) Laserfabrik Showlaser GMBH. Dry-Hire Laser Equipment List Online and Personal Communication, 2012.
- Leeb et al. (2013) Leeb, W. R., Poppe, A., Hammel, E., Alves, J, Bruner, M., Meingast, S. 2013, Astrobiology, 13, 521
- Lissauer et al. (2014) Lissauer, J. J., Marcy, G. W., Bryson, S. T., et al. 2014, ApJ, 784, 44
- NASA (2013) NASA. Lunar laser communication demonstration fact sheet. Online, 5 2013.
- Lockheed-Martin (2014) Lockheed Martin Press Release, 2-14 www.lockheedmartin.com/us/news/press-releases/2014/april/140424-mst-lm-wins-contract-to-develop-weapons-grade-fiber-laser.html
- Maire et al. (2014) Maire, J., Wright, S., Werthimer, D., et al. ArXiv e-prints, 1407.2618, Jul 2014.
- Marcy (2008) Marcy, G. W., Butler, R. P., Vogt, S. S., et al. 2008, Physica Scripta, Volume 130, 014001
- Marcy et al. (2014) Marcy, G. W., Weiss, L. M., Petigura, E. A., et al. 2014, Proceedings of the National Academy of Science, 111, 12655
- Mead (2013) Mead, C. C. 2013, Ph.D. Thesis, Harvard University, April 2013.
- Morton & Johnson (2011) Morton, T. & Johnson, J. The Astrophysical Journal, 738(2):170, Sep 2011.
- Mullally (2014) Mullally,F. & Kepler Team 2014, Submitted to ApJ.
- Petigura (2013) Petigura, E. A., Howard, A. W., & Marcy, G. W. 2013, Proceedings of the National Academy of Science, 110, 19273
- Petigura (2015) Petigura, E. A., Howard, A. W., & Marcy, G. W. 2015, “Stellar Parameters of 1300 KOIs”, submitted to ApJ.
- Osterbrock (1996) Osterbrock, D, Fullbright, J., Martel, A., et al. Publications of the Astronomical Society of the Pacific, 108:277, Mar 1996.
- Reines (2002) Reines, A. & Marcy, G. Publications of the Astronomical Society of the Pacific, 114:416-426, Apr 2002.
- Rogers (2014) Rogers, L. A. 2014, arXiv:1407.4457, Submitted to ApJ.
- Rowe et al. (2014a) Rowe, J. F., Bryson, S. T., Marcy, G. W., et al. 2014, ApJ, 784, 45
- Rowe et al. (2014b) Rowe, J., & Kepler Team 2014, American Astronomical Society Meeting Abstracts #223, 223, #228.02
- Shostak (2013) Shostak, S. 2013, International Journal of Astrobiology, 12, 17
- Szostak (2012) Szostak, J. W. Journal of Biomolecular Structure and Dynamics 29, 599–600. PMID: 22208251.
- Siemion et al. (2013) Siemion, A. P. V., Demorest, P., Korpela, E., et al. 2013, ApJ, 767, 94
- Siemion et al. (2014) Siemion, A. P. V., Benford,J., Cheng-Jin J., et al. submitted to proceedings of “Advancing Astrophysics with the Square Kilometre Array”, PoS(AASKA) 116, in press., 2014.
- Stone et al. (2005) Stone, R. P. S., Wright, S. A., Drake, F., et al. 2005, Astrobiology, 5, 604
- Tarter (2001) Tarter, J. 2001, ARA&A, 39, 511
- Tarter et al. (2011) Tarter, J., Ackermann, R., Barott, W., et al. 2011, Acta Astronautica, 68, 340
- Townes & Schwartz (1961) Townes, C. H., & Schwartz, R. N. 1961, Nature, 192, 348
- Vogt et al. (2014) Vogt, S., Allen, S., Bigelow, B., et al. HIRES: the high-resolution echelle spectrometer on the keck 10m telescope. Instrumentation in Astronomy VIII, Jun 1994.
- Walkowicz et al. (2014) Walkowicz, L., Howe, A. R., Nayar, R., et al. 2014, American Astronomical Society Meeting Abstracts #223, 223, #146.04
- Wizinowich (2006) Wizinowich, P., Mignant, D., Bouchez, A., et al. Publications of the Astronomical Society of the Pacific, 118(840):297-309, Feb 2006.
- Werthimer et al. (2001) Werthimer, D., Anderson, D., Bowyer, C. S., et al. 2001, Proc. SPIE, 4273, 104
- Weiss et al. (2014) Weiss, L. M., & Marcy, G. W. 2014, ApJ, 783, LL6
- Wolfgang & Lopez (2014) Wolfgang, A., & Lopez, E. 2014, arXiv:1409.2982
- Wright, J. et al. (2011) Wright, J. T., Fakhouri, O., Marcy, G. W., et al. 2011, PASP, 123, 412
- Wright, J. et al. (2014) Wright, J., Griffith, R., Sigurdsson, S., Povich, M., & Mullan, B. The Astrophysical Journal, 792(1):27, Sep 2014.
- Wright et al. (2001) Wright, S. A., Drake, F., Stone, R. P., Treffers, D., & Werthimer, D. 2001, Proc. SPIE, 4273, 173
- Wright et al. (2014) Wright, S. A., Werthimer, D., Treffers,R. R., et al. 2014, Proc. SPIE, 9147, 91470J
| Error in FWHMspat | Error in FWHMλ | Mean |
|---|---|---|
| 0.0 | 0.0 | 1.1(2) |
| 20% | 0.0 | 1.3(3) |
| 0.0 | 20% | 1.2(3) |
| 20% | 20% | 1.5(3) |
| 30% | 30% | 1.7(4) |
Note. — Mean values of from lasers with miscalibrated PSF. The expected error in the PSF is an order of magnitude lower than the limits considered here.