Evidence of the missing baryons from the kinematic Sunyaev-Zeldovich effect in Planck data
Abstract
We estimate the amount of the missing baryons detected by the Planck measurements of the cosmic microwave background in the direction of Central Galaxies (CGs) identified in the Sloan galaxy survey. The peculiar motion of the gas inside and around the CGs unveils values of the Thomson optical depth in the range –, indicating that the regions probed around CGs contain roughly half of the total amount of baryons in the Universe at the epoch where the CGs are found. If baryons follow dark matter, the measured s are compatible with the detection all the baryons existing inside and around the CGs.
pacs:
98.52.Eh, 98.62.Py, 98.70.Vc, 98.80.EsIntroduction. The interplay between baryons and dark matter is a key problem in cosmology and galaxy formation. Understanding the distribution of baryonic and dark matter in galaxies, groups, and clusters of galaxies is an essential step towards the full picture of how these objects form and evolve. It is well known Fukugita and Peebles (2004); Cen and Ostriker (2006); Bregman (2007) that only about of all baryons in the Universe reside in the form of stellar mass, while other resides in a diffuse, mostly undetected component, if it were not for recent UV spectroscopic measurements of un-collapsed, diffuse gas in the direction of certain QSOs, (see, e.g., Shull et al., 2012; Tejos et al., 2014, and references therein.) Nowadays there is an ongoing debate (Gupta et al., 2012; Gatto et al., 2013; Planck Collaboration Int. XI, 2013; Werk et al., 2014; Le Brun et al., 2015; Miller and Bregman, 2015) on whether a significant fraction of the latter component is present in the circumgalactic medium around halos or if instead most of the gas has been expelled or never accreted due to feedback processes like galactic winds or Active Galactic Nuclei activity. This connects the missing baryon issue with the complex problems of feedback and galaxy formation. Certainly a more complete census of the baryon distribution in the universe would be of great relevance in this context.
The kinematic Sunyaev-Zeldovich effect (hereafter kSZ, Sunyaev and Zeldovich, 1980) describes the Doppler shift in frequency induced on photons of the cosmic microwave background (hereafter CMB) photons after they scatter off free electrons. This Thomson scattering induces frequency independent brightness temperature anisotropies in the CMB, which are given by (Sunyaev and Zeldovich, 1970)
| (1) |
In this expression, the integral is conducted along the line of sight (LOS) given by . We have made the approximation that the typical correlation length of LOS velocities (given by ) is much larger than the density correlation length, in such a way that the LOS velocity term may be pulled out of the kSZ integral. This is justified by the results of Planck Collaboration Int. XXXVII (2015), who find a typical correlation length of peculiar velocities of – Mpc, well above the typical galaxy correlation length ( Mpc). The expression above also shows that the kSZ constitutes an integral over the electron momentum, independently of the temperature, and thus counts all electrons in the bulk flows, regardless they belong to collapsed structures or not.
Large scale, bulk matter flows were detected via the kSZ effect firstly by Hand et al. (2012) and more recently by Planck
Collaboration Int. XXXVII (2015). We build upon the latter work and extract physical constraints on the amount of baryons contributing to the kSZ signal and the implications of those measurements in the problem of the missing baryons. As in Planck
Collaboration Int. XXXVII (2015), we use the latest Planck data release (DR2) available at the Planck’s Legacy Archive server 111Planck’s Legacy Archive:
http://pla.esac.esa.int/pla/aio/planckProducts.html, the Central Galaxy Catalogue (hereafter CGC) obtained from the Sloan Digital Sky Survey SDSS/DR7 Abazajian et al. (2009), and a mock catalogue of central galaxies obtained from the Millennium numerical simulation Springel et al. (2005), to which we henceforth refer as the GALAXY mock catalogue. In this work we quote results for the Planck SEVEM CMB map, although similar results are obtained for all the other cleaning algorithms. Our estimates of the kSZ temperature of Eq. (1) are taken from Planck
Collaboration Int. XXXVII (2015) and are obtained after applying aperture photometry (hereafter AP) in the direction of the CGC members. We defer the reader to that paper for a more detailed description of the data under use, and a deeper discussion on the measurements of the kSZ, while in this work we concentrate upon the physical interpretation of such measurements. In particular, we set constraints on and the missing baryons from our AP measurements of in Eq. 1.
Methodology and results. The two statistics presented in Planck Collaboration Int. XXXVII (2015) yielding kSZ evidence are the kSZ pairwise peculiar momentum (hereafter ) and the cross correlation function of the kSZ temperature and the recovered radial peculiar velocity (hereafter ). The reflects the gravitational infall in pairs of galaxies and is computed from the sum
| (2) |
where the weights are given by Ferreira et al. (1999)
| (3) |
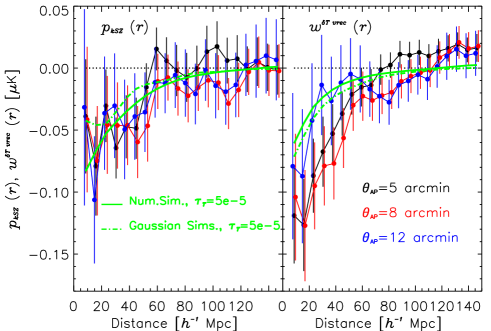
Following the convention of Hand et al. (2012), in this equation and are the vectors pointing to the positions of the -th and -th galaxies on the celestial sphere, and are the comoving distances to those objects, and refers to the distance vector for this pair of galaxies. The hat symbol () denotes a unit vector in the direction of , and is the angle separating and . Note as well that refers to the direction of the difference vector, i.e. . On the other hand, the function is computed as the spatial correlation function between the measured kSZ temperature estimates and the linear theory predictions of the radial peculiar velocity of the CGs (), , where as before the sub-indices refer to CGs and to their weights. For both statistics, the s correspond to the AP estimates of the kSZ fluctuations of Eq. (1). We refer again to Planck Collaboration Int. XXXVII (2015) for details on how linear theory predictions of CG radial peculiar velocities are obtained. Figure 1 displays the measured and functions under 5, 8, and 12 arcmin aperture radii for the SEVEM clean map of Planck (very similar estimates are found for other CMB clean maps). In order to estimate the amount of free electrons giving rise to these signals, we compare these measurements with predictions obtained from (i) the GALAXY mock catalogue of central galaxies, and (ii) a suite of 100 Gaussian simulations of the matter density contrast field that is then inverted into a peculiar velocity field by means of the linearized continuity equation. The Gaussian simulations of the density contrast are generated from a dark matter linear power spectrum compatible with Planck’s cosmology, and have no power at wavenumbers Mpc-1 since those are regarded as non-linear scales. The first approach provides velocities for the halos hosting the CGs, while the second computes an estimate of the smooth, linear peculiar velocity in a region surrounding each CG. Following the approximation in Eq. (1), green curves in Fig. 1 provide predictions for and from the GALAXY mock (solid lines) and the Gaussian simulations (dash-dotted lines), with a choice of for display purposes. We find that, while for the two predictions just differ in a % amplitude factor, for they differ both in shape and amplitude. Since the kSZ is built upon all electrons present in the volume sampled by the aperture photometry, and not necessarily bound to the CGs, we expect the real signal to lie between the two predictions.
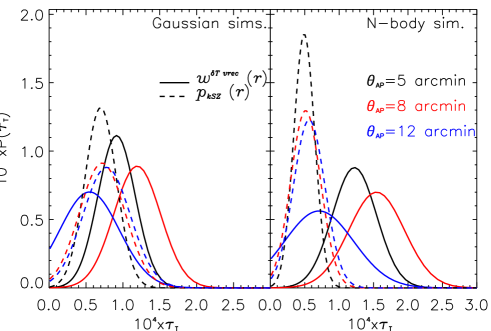
Following the template fit approach used in Planck Collaboration Int. XXXVII (2015) that conducts minimum fits of the data to the predictions while assuming Gaussian and correlated errors, we obtain the density probabilities for as given in Fig. 2. When fitting to the predictions inferred from the GALAXY catalogue, we obtain estimates from measurements falling in the – range, in slight tension (between 1 and low) compared to estimates from . A better consistency among estimates is found when fitting to the predictions provided by the Gaussian simulations (see left panel of Fig. 2). The and measurements should yield similar estimates, and hence Fig. 2 suggests that the motion of electrons in and around CGs is better described by the Gaussian simulations, which we adopt in subsequent analyses. Note that this choice is not crucial for our discussion below.
We next estimate the baryon fraction giving rise to the observed amplitudes under different apertures. For any line of sight throughout any CG, all electrons inside a cylinder whose base radius is given by the angular aperture () should contribute to the signal. The LOS depth of this cylinder corresponds to the comoving length of typical velocity correlation (), and is suggested by Fig. 1 to lie in the 20–40 Mpc range (comoving units). We find however that the baryon fraction should not depend upon for any given aperture:
| (4) |
where is the fraction of the comoving volume sampled by cylinders centred upon CGs, is the LOS depth of the cylinder in comoving units, is the average physical electron number density at redshift (whereas the “0” subscript denotes at present), is the CG comoving number density, and and are the comoving and angular distances to redshift , respectively. The brackets denote redshift averages, and thus our previous measurements of correspond to . Note that Eq. (4) holds as long as there is no overlap between cylinders along two different LOSs: we have verified that such overlap is negligible for apertures smaller than 13 arcmin, (it affects less than 1 % of pairs falling in the first distance bin at Mpc, and this ratio is still smaller for the other distance bins). We remark that this definition of baryon fraction computes the ratio of detected baryons around CGs to the total amount of baryons. Eq. 4 shows that this baryon fraction depends on the CGC completeness via the product of the average CG number density times the average measured in and around those galaxies.
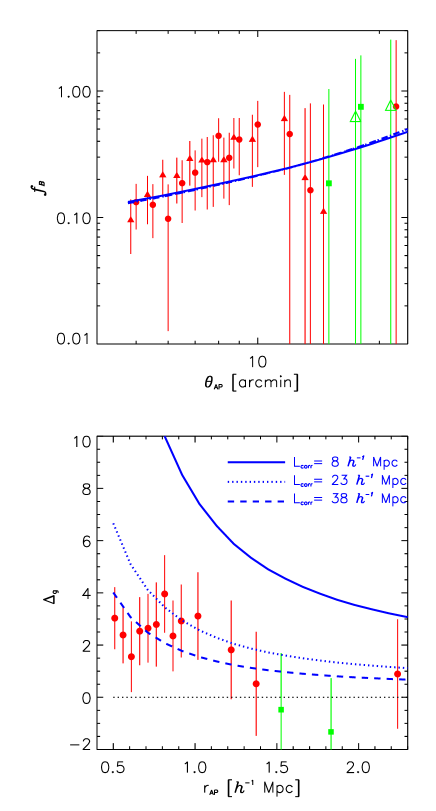
The top panel of Fig. 3 shows that the baryon fraction increases with the aperture, amounting to 45–55 % of the total of all baryons for –arcmin. For larger apertures, our measurements become compatible with noise and oscillate around zero. The blue lines provide the prediction for a scenario where the baryons trace perfectly the distribution of dark matter. These predictions follow the approach of Hayashi and White (2008), which compute the dark matter – central halo correlation function which is dependent of both mass and redshift of the halos, and requires some linear bias relation that we adopt from Sheth and Tormen (1999). These predictions compute, as in Eq. (4), the ratio between the mean dark matter overdensity inside the cosmological volume sampled by the cylinders centred upon the CGs and the inverse of the fraction of the total cosmological volume sampled by the same cylinders. We thus need to integrate inside the cylinders, and as shown in the plot these predictions are independent of the choice of . We can also incorporate the impact of our AP filter in our prediction, after taking into account the redshift and mass distribution of our CG sample for each aperture . We find that our measurements of the baryon fraction are compatible with this prediction, although slightly falling on the high amplitude side: results from are given by filled red circles (filled green squares) when positive (negative), while filled red triangles (empty green triangles) correspond to positive (negative) estimates inferred from the . A template fit to the dark matter prediction (given by the blue lines and performed as in Eqs. 11–12 in Planck Collaboration Int. XXXVII (2015), thus accounting for covariance among different apertures) yields an amplitude of for baryon fraction estimates obtained from the , and from measurements of the baryon fraction. In both cases we compare these observables to the prediction from Gaussian simulations. As mentioned above, tension at the level arises when comparing fits of the two observables to the N-body GALAXY prediction: vs from and data, respectively. We remark that calibration errors in CMB maps would impact these amplitudes while leaving the significance of the kSZ signal unchanged.
Alternatively, in the bottom panel of Fig. 3 we compare the gas overdensity values inferred from the measurements from our observations and Mpc (filled symbols) with the predictions of dark matter according to Hayashi and White (2008) (blue dot-dashed line), for different choices . In this case, the conversion between angular apertures and transversal distances accounts for the redshift distribution of the CG sources. Values for gas overdensity are obtained from estimates via
| (5) |
We find again good agreement with the dark matter prediction, finding no hints for feedback that is supposed to deplete gas from the inner halo regions. Similar results are obtained from observations.
Discussion. Observations of metallic lines in the X-ray in the direction of high energy sources provide information about the gas density in the so called circumgalactic medium of the Milky Way Gupta et al. (2012); Gatto et al. (2013); Werk et al. (2014); Miller and Bregman (2015). While some authors claim to have found evidence for all the baryons expected in our halo Gupta et al. (2012), some other authors seem to find only between to % of the expected amount of baryons Gatto et al. (2013); Werk et al. (2014); Miller and Bregman (2015). Both the thermal Sunyaev-Zeldovich (hereafter tSZ, Sunyaev and Zeldovich, 1972) and the kSZ effects provide alternative approaches to detect ionised gas, different to the window available from X-ray observations. The tSZ and kSZ effects provide statistical measurements of gas fraction in the visible halo population and do not restrict to the Milky Way host halo. In Planck Collaboration Int. XI (2013) it is claimed that there is no apparent evidence for feedback effects in the tSZ luminosity of CGs, in contradiction with X-ray observations. Those analyses have been recently revisited by Le Brun et al. (2015) after including explicitly the impact of feedback in the filters extracting the tSZ signal. They conclude that Planck tSZ observations up to are compatible with AGN-induced feedback effects, and incompatible with the no-feedback hypothesis (or self similarity in the tSZ luminosity – halo mass relation). Those results restrict however to gas collapsed in halos that is able to generate tSZ signal Hernández-Monteagudo et al. (2006). On the other hand, our kSZ study is blind to any assumed gas temperature profile in CG host halos, is not restricted to collapsed/virialised gas, and it provides lower limits to the amount of gas in CGs given the compensated structure of the AP filter. Figure 3 shows that our measurements are compatible with having detected all missing baryons in case these follow the dark matter distribution. There exist uncertainties linked to the predictions for the gas peculiar velocities, but these are relatively small if we compare the predictions from the Millennium and the Gaussian simulations in the right panel of Fig. 1. The impact of contaminants (such as dust or tSZ) seems to have been characterised and kept under control in Planck Collaboration Int. XXXVII (2015), where it is also shown that a satellite fraction (of ) in our CGC should decrease the kSZ amplitude by less than 10 %. We thus conclude that the measured kSZ signal provides evidence for all the missing baryons predicted to be inside and around the CGs, which correspond to roughly half the total amount of baryons present in the Universe at under the SDSS DR7 angular footprint. In the future, a more detailed comparison with state-of-the-art hydrodynamical numerical simulations should shed more light on these results.
Acknowledgements.
C.H.-M. acknowledges the support of the Ramón y Cajal fellowship No. RyC-2011-08262, the Marie Curie Career Integration Grant No. 294183 and the Spanish Ministerio de Economía y Competividad project No. AYA2012-30789. We also acknowledge useful discussions with S.D.M. White. Y.-Z. M thanks the support of ERC starting grant No. 307209.References
- Fukugita and Peebles (2004) M. Fukugita and P. J. E. Peebles, ApJ 616, 643 (2004), astro-ph/0406095 .
- Cen and Ostriker (2006) R. Cen and J. P. Ostriker, ApJ 650, 560 (2006), astro-ph/0601008 .
- Bregman (2007) J. N. Bregman, ARA&A 45, 221 (2007), arXiv:0706.1787 .
- Shull et al. (2012) J. M. Shull, B. D. Smith, and C. W. Danforth, ApJ 759, 23 (2012), arXiv:1112.2706 .
- Tejos et al. (2014) N. Tejos, S. L. Morris, C. W. Finn, N. H. M. Crighton, J. Bechtold, B. T. Jannuzi, J. Schaye, T. Theuns, G. Altay, O. Le Fèvre, E. Ryan-Weber, and R. Davé, MNRAS 437, 2017 (2014), arXiv:1309.5950 .
- Gupta et al. (2012) A. Gupta, S. Mathur, Y. Krongold, F. Nicastro, and M. Galeazzi, ApJ 756, L8 (2012), arXiv:1205.5037 [astro-ph.HE] .
- Gatto et al. (2013) A. Gatto, F. Fraternali, J. I. Read, F. Marinacci, H. Lux, and S. Walch, MNRAS 433, 2749 (2013), arXiv:1305.4176 [astro-ph.GA] .
- Planck Collaboration Int. XI (2013) Planck Collaboration Int. XI, A&A 557, A52 (2013), arXiv:1212.4131 .
- Werk et al. (2014) J. K. Werk, J. X. Prochaska, J. Tumlinson, M. S. Peeples, T. M. Tripp, A. J. Fox, N. Lehner, C. Thom, J. M. O’Meara, A. B. Ford, R. Bordoloi, N. Katz, N. Tejos, B. D. Oppenheimer, R. Davé, and D. H. Weinberg, ApJ 792, 8 (2014), arXiv:1403.0947 .
- Le Brun et al. (2015) A. M. C. Le Brun, I. G. McCarthy, and J.-B. Melin, ArXiv e-prints (2015), arXiv:1501.05666 .
- Miller and Bregman (2015) M. J. Miller and J. N. Bregman, ApJ 800, 14 (2015), arXiv:1412.3116 .
- Sunyaev and Zeldovich (1980) R. A. Sunyaev and I. B. Zeldovich, MNRAS 190, 413 (1980).
- Sunyaev and Zeldovich (1970) R. A. Sunyaev and Y. B. Zeldovich, Ap&SS 7, 3 (1970).
- Planck Collaboration Int. XXXVII (2015) Planck Collaboration Int. XXXVII, A&A, submitted (2015), arXiv:1504.03339 .
- Hand et al. (2012) N. Hand, G. E. Addison, E. Aubourg, N. Battaglia, E. S. Battistelli, D. Bizyaev, J. R. Bond, H. Brewington, J. Brinkmann, B. R. Brown, S. Das, K. S. Dawson, M. J. Devlin, J. Dunkley, R. Dunner, D. J. Eisenstein, J. W. Fowler, M. B. Gralla, A. Hajian, M. Halpern, M. Hilton, A. D. Hincks, R. Hlozek, J. P. Hughes, L. Infante, K. D. Irwin, A. Kosowsky, Y.-T. Lin, E. Malanushenko, V. Malanushenko, T. A. Marriage, D. Marsden, F. Menanteau, K. Moodley, M. D. Niemack, M. R. Nolta, D. Oravetz, L. A. Page, N. Palanque-Delabrouille, K. Pan, E. D. Reese, D. J. Schlegel, D. P. Schneider, N. Sehgal, A. Shelden, J. Sievers, C. Sifón, A. Simmons, S. Snedden, D. N. Spergel, S. T. Staggs, D. S. Swetz, E. R. Switzer, H. Trac, B. A. Weaver, E. J. Wollack, C. Yeche, and C. Zunckel, Physical Review Letters 109, 041101 (2012), arXiv:1203.4219 [astro-ph.CO] .
-
Note (1)
Planck’s Legacy Archive:
http://pla.esac.esa.int/pla/aio/planckProducts.html. - Abazajian et al. (2009) K. N. Abazajian, J. K. Adelman-McCarthy, M. A. Agüeros, S. S. Allam, C. Allende Prieto, D. An, K. S. J. Anderson, S. F. Anderson, J. Annis, N. A. Bahcall, and et al., ApJS 182, 543 (2009), arXiv:0812.0649 .
- Springel et al. (2005) V. Springel, S. D. M. White, A. Jenkins, C. S. Frenk, N. Yoshida, L. Gao, J. Navarro, R. Thacker, D. Croton, J. Helly, J. A. Peacock, S. Cole, P. Thomas, H. Couchman, A. Evrard, J. Colberg, and F. Pearce, Nature 435, 629 (2005), astro-ph/0504097 .
- Ferreira et al. (1999) P. G. Ferreira, R. Juszkiewicz, H. A. Feldman, M. Davis, and A. H. Jaffe, ApJ 515, L1 (1999), astro-ph/9812456 .
- Hayashi and White (2008) E. Hayashi and S. D. M. White, MNRAS 388, 2 (2008), arXiv:0709.3933 .
- Sheth and Tormen (1999) R. K. Sheth and G. Tormen, MNRAS 308, 119 (1999), astro-ph/9901122 .
- Sunyaev and Zeldovich (1972) R. A. Sunyaev and Y. B. Zeldovich, Comments on Astrophysics and Space Physics 4, 173 (1972).
- Hernández-Monteagudo et al. (2006) C. Hernández-Monteagudo, H. Trac, L. Verde, and R. Jimenez, ApJ 652, L1 (2006), arXiv:astro-ph/0606172 .