LoCuSS: The slow quenching of star formation in cluster galaxies and the need for pre-processing
Abstract
We present a study of the spatial distribution and kinematics of star-forming galaxies in 30 massive clusters at , combining wide-field Spitzer 24m and GALEX NUV imaging with highly-complete spectroscopy of cluster members. The fraction () of star-forming cluster galaxies rises steadily with cluster-centric radius, increasing fivefold by , but remains well below field values even at . This suppression of star formation at large radii cannot be reproduced by models in which star formation is quenched in infalling field galaxies only once they pass within of the cluster, but is consistent with some of them being first pre-processed within galaxy groups. Despite the increasing –radius trend, the surface density of star-forming galaxies actually declines steadily with radius, falling from the core to . This requires star-formation to survive within recently accreted spirals for 2–3 Gyr to build up the apparent over-density of star-forming galaxies within clusters. The velocity dispersion profile of the star-forming galaxy population shows a sharp peak of 1.44 at , and is 10-35% higher than that of the inactive cluster members at all cluster-centric radii, while their velocity distribution shows a flat, top-hat profile within . All of these results are consistent with star-forming cluster galaxies being an infalling population, but one that must also survive .5–2 Gyr beyond passing within . By comparing the observed distribution of star-forming galaxies in the stacked caustic diagram with predictions from the Millennium simulation, we obtain a best-fit model in which SFRs decline exponentially on quenching time-scales of Gyr upon accretion into the cluster.
Subject headings:
galaxies: active — galaxies: clusters: general — galaxies: evolution — galaxies: stellar content1. Introduction
The ability of galaxies to continuously form stars depends strongly on their global environment, with isolated central galaxies primarily evolving as star-forming spirals, while “red and dead” early-type galaxies completely dominate the cores of rich clusters, producing the SF–density or SF–radius relations (e.g. Kennicutt, 1983; Lewis et al., 2002). Various physical mechanisms have been proposed over the years to remove (or consume) gas and quench star formation in spiral galaxies within massive clusters, such as ram-pressure or viscous stripping, starvation, harassment or tidal interactions (for reviews see e.g. Boselli & Gavazzi, 2006; Haines et al., 2007).
Clusters and their member galaxies however do not exist and evolve in isolation from the rest of the Universe. In CDM models structure formation occurs hierarchically, meaning that as the most massive collapsed structures in the Universe, galaxy clusters form latest and are also the most dynamically immature (e.g. Boylan-Kolchin et al., 2009; Gao et al., 2012). Preferentially residing at the nodes of the complex filamentary web, they continually accrete dark matter (DM) halos hosting individual galaxies (M) or galaxy groups (M). The most massive clusters have on average doubled in mass since (Boylan-Kolchin et al., 2009), while half of galaxies in local clusters have been accreted since (Berrier et al., 2009).
To correctly interpret the observed evolutionary and radial trends in cluster galaxy properties, it is thus fundamental to place them in this cosmological context whereby star-forming galaxies are being continually accreted into the clusters and transformed. Moreover, it is also vital to consider projection effects as many spectroscopic cluster members are actually infalling galaxies physically located outside the virial radius, and this contribution varies strongly with projected cluster-centric radius () and line-of-sight (LOS) velocity relative to the cluster redshift (). This requires using cosmological simulations containing one or more massive clusters, and following the orbits and merger histories of the galaxies or sub-halos which are accreted into the cluster over time (e.g. Mamon et al., 2010). This approach gained early support when Balogh, Navarro & Morris (2000), Diaferio et al. (2001) and Ellingson et al. (2001) were able to reproduce the observed radial population gradients of star-forming galaxies in clusters in terms of galaxies on their first infall into the cluster.
The caustic diagram, which plots versus , has been used to constrain the kinematics and accretion epochs of different cluster galaxy populations, as well as the constrain the masses, density profiles and dynamical states of the clusters themselves (e.g. Moss & Dickens, 1977; Binggeli et al., 1987; Biviano et al., 1997, 2013; Biviano & Katgert, 2004; Gill, Knebe & Gibson, 2005; Mahajan et al., 2011; Hernández-Fernández et al., 2014; Muzzin et al., 2014; Jaffé et al., 2015).
This progress has permitted recent attempts to constrain the time-scales required to halt star formation in recently accreted cluster spirals, with results supporting gentle physical mechanisms (e.g. starvation) that slowly quench star-formation over a period of several Gyrs (Wolf et al., 2009; von der Linden et al., 2010; De Lucia et al., 2012; Wetzel et al., 2013), rather than more violent processes (e.g. mergers) that rapidly terminate star formation (although see e.g. Balogh et al., 2004; McGee et al., 2011; Wijesinghe et al., 2012).
In Haines et al. (2009) we estimated the composite radial population gradients in the fraction of star-forming galaxies () in 22 massive clusters at from the Local Cluster Substructure Survey (LoCuSS111111http://www.sr.bham.ac.uk/locuss/) based on panoramic Spitzer/MIPS 24m data. A steady systematic increase in with cluster-centric radius was observed out to , similar to those found previously (Ellingson et al., 2001; Lewis et al., 2002; Weinmann et al., 2006). By comparison to galaxies infalling and orbiting around massive clusters (M) from the Millennium Simulation (Springel et al., 2005), it was possible to approximately reproduce the radial population trends in the context of a simple infall model, in which star-forming field galaxies are accreted into the cluster and their star-formation rapidly quenched upon their first pericenter. The key limitation of this work was the lack of redshifts to identify cluster galaxies, such that we had to statistically account for the contamination for field galaxy interlopers when estimating the .
We have since completed ACReS (Arizona Cluster Redshift Survey121212http://herschel.as.arizona.edu/acres/acres.html) which provides highly-complete spectroscopy of cluster members for all 30 clusters from LoCuSS131313http://herschel.as.arizona.edu/locuss/locuss.html with wide-field Spitzer/MIPS data. With this data, Haines et al. (2013) found the specific-SFRs of massive () star-forming cluster galaxies within to be systematically 28% lower than their counterparts in the field at fixed stellar mass and redshift, a difference significant at the 8.7 level. This is the unambiguous signature of star formation in most (and possibly all) massive star-forming galaxies being slowly quenched upon accretion into clusters, and was best fit by models in which their star formation rates decline exponentially on quenching time-scales in the range 0.7–2.0 Gyr.
In this article we analyse the spatial distribution and kinematics of star-forming galaxies within the same set of 30 clusters, and by comparing with predictions from cosmological simulations, draw further independent constraints on the quenching time-scale. In particular, we determine the radial surface density profile, , of star-forming cluster galaxies and show that it declines steadily with radius, falling from the core to . We show that this simple observation provides powerful constraints for how long massive star-forming galaxies are able to continue forming stars once they are accreted into rich clusters, quickly ruling out models in which star-formation is rapidly halted in infalling spirals when they pass within . We also re-examine the radial population gradients of star-forming galaxies (–radius relation) out to , where we find a shortfall of star-forming galaxies in comparison to the coeval field population that cannot be easily explained by purely cluster-related quenching mechanisms, indicating a need for galaxies being first pre-processed within infalling galaxy groups.
In §2 we present our observational data, and in §3 the main results. In §4 we follow the infall and orbits of galaxies in the vicinity of massive galaxy clusters from the Millennium simulation, to predict their spatial distributions and kinematics as a function of accretion epoch. These model predictions are then compared to observations in §5. We discuss the resultant constraints on the time-scales required to quench star formation in recently accreted galaxies and the need for pre-processing in §6 and summarize in §7. Throughout we assume , and .
2. Data
LoCuSS is a multi-wavelength survey of X-ray luminous galaxy clusters at (Smith et al., 2010a) drawn from the ROSAT All Sky Survey cluster catalogs (Böhringer et al., 2004). The first 30 clusters from our survey benefit from a particularly rich dataset, including: Subaru/Suprime-Cam optical imaging (Okabe et al., 2010), Spitzer/MIPS maps, Herschel/PACS+SPIRE 100–500m maps, Chandra and/or XMM X-ray data, GALEX UV data, and near-infrared (NIR) imaging. All of these data embrace at least fields-of-view centered on each cluster, and thus probe them out to 1–2 virial radii (Haines et al., 2010; Pereira et al., 2010; Smith et al., 2010b). These 30 clusters were selected from the parent sample simply on the basis of being observable by Subaru on the nights allocated to us (Okabe et al., 2010), and should therefore not suffer any gross biases towards (for example) cool core clusters, merging clusters etc. Indeed, Okabe et al. (2010) show that the sample is statistically indistinguishable from a volume-limited sample.
2.1. Chandra/XMM X-ray imaging
All but two (Abell 291, Abell 2345) of the 30 clusters have available deep Chandra data (9–120 ksec). Deprojected dark matter densities, gas densities and gas temperature profiles for each cluster were derived by fitting the phenomenological cluster models of Ascasibar & Diego (2008) to a series of annular spectra extracted for each cluster (Sanderson & Ponman, 2010). The best-fitting cluster models were then used to estimate , the radius enclosing a mean overdensity of 500 with respect to the critical density of the Universe at the cluster redshift (Sanderson et al., 2009).
The value for Abell 689 is taken from Giles et al. (2012), as they separated the extended cluster X-ray emission from the central BL Lac, and for the clusters lacking Chandra data, the values are taken from the XMM analysis of Martino et al. (2014). For the 23 clusters in common with the joint Chandra–XMM analysis of the LoCuSS high- cluster sample of Martino et al. (2014), there is good consistency of the cluster radii with .
The Chandra data were also used to identify X-ray AGN as described in Haines et al. (2012). The survey limit of six broad (0.3–7 keV) X-ray counts results in on-axis sensitivity limits of for X-ray AGN at the cluster redshift for all 28 systems (Table 1 from Haines et al., 2012).
Deep XMM data was available for 23 systems, allowing other groups and clusters in the region to be identified. Each 0.5–2 keV image is decomposed into unresolved and extended emission, following the wavelet technique of Finoguenov et al. (2009). For each extended source, we attempt to identify the redshift of its associated group/cluster by examining the Subaru optical images for likely BCGs near the center of the X-ray emission and/or groups of galaxies with similar redshifts from ACReS within the X-ray contours.
2.2. Mid-infrared Observations
All 30 clusters were observed at with MIPS (Rieke et al., 2004) on board the Spitzer Space Telescope141414This work is based in part on observations made with the Spitzer Space Telescope, which is operated by the Jet Propulsion Laboratory, California Institute of Technology under a contract with NASA (contract 1407). (PID: 40872; PI: G.P. Smith). The resulting 24m mosaics were analysed with SExtractor (Bertin & Arnouts, 1996) producing catalogs which are on average 90% complete to 400Jy.
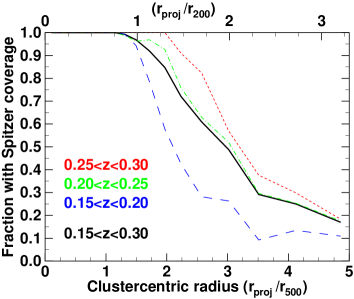
Each cluster was observed across a fixed field-of-view, resulting in the clusters being covered out to different cluster-centric radii in units of , depending on their redshift and radius, as well as the orientation of the Spitzer images. Figure 1 shows that we probe out to larger cluster-centric radii for the highest redshift clusters () than those in our lowest redshift bin (). Averaging over the full redshift range (0.15–0.30; solid black curve), our 24m coverage is essentially complete out to , falling to 5% at , based on the conversion (Sanderson & Ponman, 2003).
| Cluster | (lit) | |||||||||
|---|---|---|---|---|---|---|---|---|---|---|
| Name | (Mpc) | (km s | (sec) | (S/N=5) | ||||||
| Abell 68 | 0.2510 | 194 | (0) | 0. | 955 | 3.193 | 1186 | 6731 | 22.90 | |
| Abell 115 | 0.1919 | 213 | (36) | 1. | 304 | 7.628 | 1219 | 16217 | 23.36 | |
| Abell 209 | 0.2092 | 393 | (49)c | 1. | 230 | 6.519 | 1369 | 11616 | 23.76 | |
| Abell 267 | 0.2289 | 230 | (139)a | 0. | 994 | 3.515 | 1045 | 11268 | 23.32 | |
| Abell 291 | 0.1955 | 126 | (0) | 0. | 868 | 2.259 | 704 | 6059 | 23.16 | |
| Abell 383 | 0.1887 | 266 | (92)d | 1. | 049 | 3.958 | 950 | 6117 | 23.16 | |
| Abell 586 | 0.1707 | 247 | (21) | 1. | 150 | 5.117 | 933 | — | — | |
| Abell 611 | 0.2864 | 297 | (7) | 1. | 372 | 9.847 | 1039 | 9928 | 23.01 | |
| Abell 665 | 0.1827 | 359 | (31) | 1. | 381 | 8.975 | 1227 | 9503 | 23.26 | |
| Abell 689 | 0.2776 | 338 | (153)a | 1. | 126 | 5.390 | 721 | — | — | |
| Abell 697 | 0.2821 | 486 | (141)a | 1. | 505 | 12.93 | 1268 | 36858 | 23.89 | |
| Abell 963 | 0.2043 | 466 | (50)a | 1. | 275 | 7.226 | 1119 | 29043 | 23.96 | |
| Abell 1689 | 0.1851 | 857 | (416)a | 1. | 501 | 11.55 | 1541 | 7716 | 23.34 | |
| Abell 1758 | 0.2775 | 471 | (50)a | 1. | 376 | 9.835 | 1442 | 20977 | 23.88 | |
| Abell 1763 | 0.2323 | 423 | (126)a | 1. | 220 | 6.522 | 1358 | 13589 | 23.80 | |
| Abell 1835 | 0.2524 | 1083 | (608)a | 1. | 589 | 14.73 | 1485 | 21827 | 23.50 | |
| Abell 1914 | 0.1671 | 454 | (65)a | 1. | 560 | 12.73 | 1055 | 3804 | 23.17 | |
| Abell 2218 | 0.1733 | 342 | (49) | 1. | 258 | 6.716 | 1245 | 14617 | 23.73 | |
| Abell 2219 | 0.2257 | 628 | (297)a | 1. | 494 | 11.90 | 1332 | 9886 | 23.42 | |
| Abell 2345 | 0.1781 | 405 | (39) | 1. | 249 | 6.607 | 1000 | 9864 | 23.49 | |
| Abell 2390 | 0.2291 | 517 | (140) | 1. | 503 | 12.16 | 1372 | 6819 | 22.35 | |
| Abell 2485 | 0.2476 | 196 | (0) | 0. | 830 | 2.088 | 799 | — | — | |
| RXJ0142.0+2131 | 0.2771 | 204 | (15) | 1. | 136 | 5.531 | 1123 | — | — | |
| RXJ1720.1+2638 | 0.1599 | 473 | (114)b | 1. | 530 | 11.92 | 938 | 3074 | 22.67 | |
| RXJ2129.6+0005 | 0.2337 | 334 | (78)a | 1. | 227 | 6.648 | 879 | 36323 | 23.72 | |
| ZwCl0104.4+0048 (Z348) | 0.2526 | 185 | (1) | 0. | 760e | 1.613 | 806 | 14435 | 23.46 | |
| ZwCl0823.2+0425 (Z1693) | 0.2261 | 337 | (4) | 1. | 050 | 4.130 | 671 | 14314 | 23.41 | |
| ZwCl0839.9+2937 (Z1883) | 0.1931 | 173 | (3) | 1. | 107 | 4.674 | 834 | 21250 | 23.39 | |
| ZwCl0857.9+2107 (Z2089) | 0.2344 | 147 | (0) | 1. | 024 | 3.866 | 815 | 20225 | 23.68 | |
| ZwCl1454.8+2233 (Z7160) | 0.2565 | 157 | (1) | 1. | 128 | 5.294 | 988 | 19850 | 23.58 | |
2.3. UV, optical and near-infrared data
Wide-field - and -band near-infrared imaging was obtained for all 30 clusters using either WFCAM on the 3.8-m United Kingdom Infrared Telescope (UKIRT)151515UKIRT is operated by the Joint Astronomy Centre on behalf of the Science and Technology Facilities Council of the United Kingdom. ( field-of-view; 26/30 clusters) or NEWFIRM on the 4.0-m Mayall telescope at Kitt Peak161616Kitt Peak National Observatory, National Optical Astronomy Observatory, which is operated by the Association of Universities for Research in Astronomy (AURA) under cooperative agreement with the National Science Foundation. (; 4/30 clusters), in each case reaching depths of , .
Wide-field deep UV imaging from the Galaxy Evolution Explorer (GALEX) satellite was obtained for 26/30 clusters, primarily through the Cycle 4 (GI4-090; PI. G.P. Smith) and Cycle 6 (GI6-046; PI. S. Moran) Guest Investigator Programs. The Cycle 4 program provided far-ultraviolet (FUV) and near-ultraviolet (NUV) imaging for 14 clusters (.2–13.6 ksec), while comparable FUV+NUV data were obtained for 7 more clusters (.4–29.0 ksec) from the GALEX science archive. Sixteen clusters were observed in Cycle 6, including 8 systems not previously observed, but this provided only deep NUV imaging (.9–36.3 ksec), the operations of the FUV camera having previously been suspended. The GALEX instrument has a circular field of view of radius 0.55 deg, ensuring full ultraviolet coverage for galaxies in our near-infrared WFCAM fields. The total NUV exposure times and 5 magnitude limits, after correcting for Galactic extinction as in Wyder et al. (2007), are shown in Table 1.
Optical photometry in the bands were taken from the Sloan Digital Sky Survey, using the dereddened SDSS model magnitudes. Twenty-six of the 30 clusters lie within the DR-10 footprint, while 23 have both SDSS and deep GALEX NUV photometry, allowing star-forming galaxies to be identified from their blue colors.
2.4. MMT/Hectospec spectroscopy
We have recently completed ACReS (the Arizona Cluster Redshift Survey; Pereira et al. 2015 in preparation) a long-term spectroscopic programme to observe our sample of 30 galaxy clusters with MMT/Hectospec. Target galaxies are primarily -band selected down to a limit of or fainter (depending on the number of targets produced), to produce an approximately stellar mass-limited sample down to . Higher priorities are given to target galaxies also detected at 24m to obtain a virtually complete census of obscured star formation in the cluster population. Further details of the survey aims and targetting strategy are given in Haines et al. (2013). Eleven of our 30 clusters were also observed by the Hectospec Cluster Survey (HeCS; Rines et al., 2013), providing redshifts for an additional 971 cluster members. Redshifts for a further 112, 92 and 49 members of clusters RXJ1720.1+2638, Abell 383 and Abell 209 are included from Owers et al. (2011), Geller et al. (2014) and Mercurio et al. (2003) respectively. Table 1 lists the number of spectroscopic members for each cluster, with the contributions taken from other published surveys indicated in parentheses, giving us a grand total of 10 950 cluster members with redshifts. Averaging over all 30 systems, we achieve spectroscopic completeness levels of 66% for () cluster galaxies across the full WFCAM/NEWFIRM fields, rising to 80% for those galaxies with Spitzer coverage and 96% for those detected at 24m.
The likelihood that a given galaxy was targetted for spectroscopy depends strongly on both its location with respect to the cluster center as well as its photometric properties (-band magnitude, color, 24m flux), as detailed in Haines et al. (2013). To account for this, each galaxy is weighted by the inverse probability of it having being observed spectroscopically, following the approach of Norberg et al. (2002).
2.5. Identification of cluster members and field galaxy samples
Members of each cluster are identified from the redshift versus projected cluster-centric radius plot as lying within the “trumpet”-shaped caustic profile expected for galaxies infalling and subsequently orbiting within a massive virialized structure (Dünner et al., 2007). For most systems, there is a strong contrast in phase-space density from inside to outside these caustics (Rines & Diaferio, 2006), making their visual identification relatively simple. The central redshift and velocity dispersion of each cluster (Table 1) are iteratively measured for member galaxies within (estimated as in Finn et al., 2008), using the biweight scale estimator (; Beers, Flynn & Gebhardt, 1990), with uncertainties estimated using bootstrap resampling.
The field galaxy sample was taken from the same dataset as the primary cluster galaxy sample, but were located in narrow redshift ranges on either side of the cluster, for which our spectroscopic survey ACReS should still be complete to (for full details see Haines et al., 2013). Overall, 1398 coeval () field galaxies with and 24m coverage were identified within these narrow redshift slices either side of the clusters (699 in front, 699 behind), after excluding regions where other X-ray galaxy groups had been previously detected from our XMM data.
2.6. Stellar masses and SFRs
Rest-frame UV–optical colors and absolute magnitudes were determined using the k-corrections of Chilingarian et al. (2010). Stellar masses () were estimated from the -band luminosities using the linear relation between -band stellar mass-to-light ratio and rest-frame color from Bell et al. (2003), adjusted by -0.15 dex to be valid for a Kroupa (2002) IMF. Where SDSS photometry was unavailable we classified the galaxy as being either star-forming or passive according to whether it was 24m or NUV detected or not, and adopted appropriate M/L ratios.
For each 24-detected galaxy with known redshift, its intrinsic bolometric luminosity () and rest-frame 24m luminosity is estimated by comparison of its 24m flux to the luminosity-dependent template infrared spectral energy distributions of Rieke et al. (2009). The latter is then converted to an obscured SFR using the calibration of Rieke et al. (2009)
| (1) |
which is valid for either a Kroupa (2002) or Chabrier (2003) IMF. Our Spitzer data should be sensitive to galaxies with ongoing obscured star formation occuring at rates down to 2.0 M in our most distant clusters ().
Local quiescent early-type galaxies are known to emit in the mid-infrared at levels much higher than expected from photospheric emission alone (Clemens et al., 2009). This excess at 10–30m has been shown to be due to silicate emission from the dusty circumstellar envelopes of mass-losing evolved AGB stars (Bressan et al., 2006) rather than residual ongoing star formation. We may thus worry that some of our cluster galaxies may be mistakenly classed as star-forming due to 24m emission coming from TP-AGB stars.
The spectral energy distributions (SEDs) of evolved stellar populations including emission from dusty circumstellar envelopes peak at 10–20m, but then drop rapidly at longer wavelengths (Piovan et al., 2003), and so galaxies whose 24m emission is due to TP-AGB stars should not be detected in our Herschel/PACS data, unlike normal star-forming galaxies whose infrared SEDs peak at 70–170m (e.g. Dale et al., 2012). For the 11 nearest clusters () in our sample, 98% of galaxies with SFR and Herschel/PACS coverage were also detected at 100m, while 99% show clear H emission in our ACReS MMT/Hectospec spectra, indicating that their 24m emission is indeed due to ongoing star formation.
In a comparable Spitzer/MIPS analysis of 814 galaxies in the Shapley supercluster at , sensitive to much lower obscured star formation rates (SFR) Haines et al. (2011b) did find a significant population of quiescent (based upon a lack of H emission) cluster galaxies detected at 24m, but none with 24m luminosities that would convert to an obscured SFR above 0.5 M. They also obtained a tight correlation (0.22 dex) between the 24m and the 1.4 GHz radio luminosities for star-forming cluster galaxies, down to SFR, consistent with both the mid-infrared and radio emission being due to star formation.
3. Results
3.1. Radial population gradients
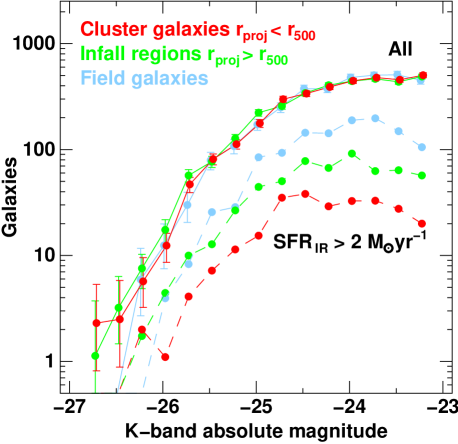
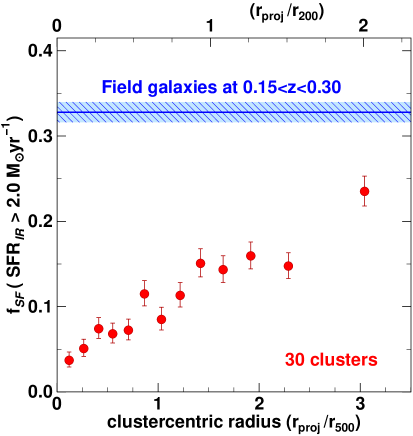
Figure 2 shows the fraction of massive () cluster galaxies with obscured star formation occurring at rates () as a function of projected cluster-centric radius in units of , across the full sample of 30 clusters. The fractions only consider cluster members covered by the Spitzer 24m maps, and exclude X-ray AGN and QSOs, as their 24m emission is usually dominated by dust heated by the active nucleus rather than star formation (e.g. Xu et al. 2015). BCGs are also excluded due to their unique evolutions (Lin & Mohr, 2004), and the direct link between BCG activity and the presence of cooling flows within clusters (Smith et al., 2010a; Rawle et al., 2012).
The fraction of obscured star-forming galaxies increases steadily with cluster-centric radius from in the cluster core to at (). However even at these large radii the remains well (1/3) below that seen in coeval field galaxies (; blue line). A simple linear extrapolation of the observed trend suggests that the should reach that of the field galaxy population at . However the limited extents of our Spitzer 24m maps mean that we cannot establish whether this occurs or not.
The fraction of star-forming cluster galaxies evolves very rapidly at these redshifts, with (Haines et al., 2013). It is thus vital to ensure that this shortfall in star-forming cluster galaxies at large radii with respect to field values is not produced by a redshift bias between the two samples. This is certainly not the case here, as the mean redshifts of each radial bin for the cluster populations all lie in the range 0.217–0.241, while for the field population . There is a marginal redshift bias within our cluster sample, as the outer two radial bins have , while the remaining bins all have mean redshifts in the range 0.217–0.231. This is due to our Spitzer data providing wider radial coverage (in terms of ) for the higher redshift systems, but it is likely only a marginal effect, artificially increasing the outer two by 0% (or .02 in the figure).
A second possible explanation for the lower among cluster galaxies would be if they were more massive on average than the field galaxy comparison sample, as is known to decline with increasing stellar mass at fixed galaxy density (e.g. Haines et al., 2007). However, the mean stellar masses of cluster galaxies for each radial bin in Fig. 2 are always within 0.04 dex of that of the coeval field population. Moreover, the -band luminosity functions of cluster galaxies within (excluding BCGs), those in the infall regions (), and the field galaxy samples are all indistinguishable (Fig. 3). We also note that due to the fixed SFR lower limit of 2.0 M used to define a star-forming galaxy, the do not vary much with stellar mass (-band luminosity). We therefore exclude secular quenching due to increased stellar masses among the cluster galaxy population as being responsible for their lower (at all radii in Fig. 2) with respect to the field. The progressive suppression in star-formation in moving from field to infall regions, and on to cluster environments is seen at all stellar masses (compare dashed curves in Fig. 3).
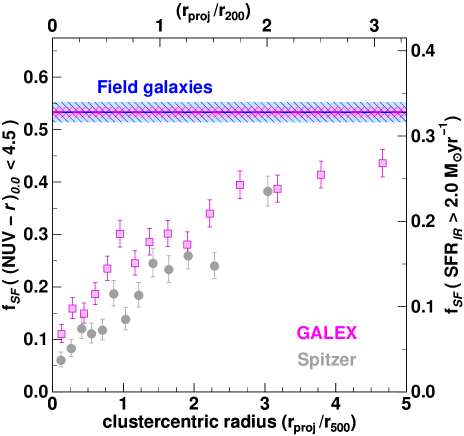
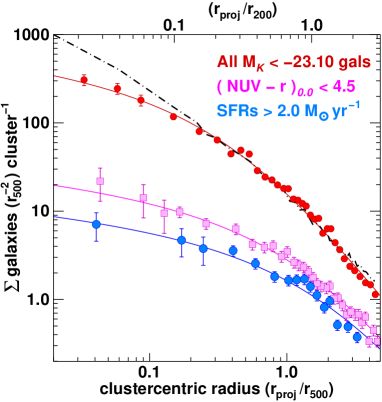
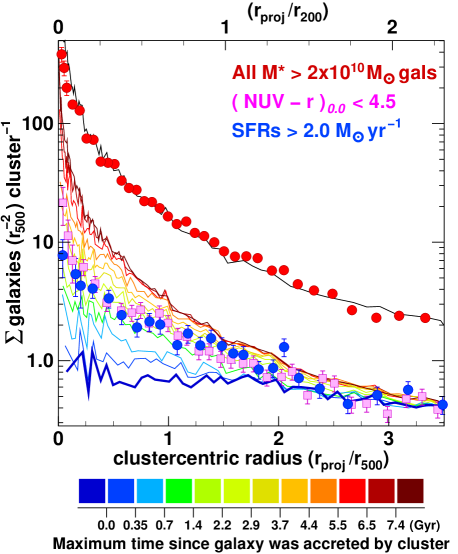
The GALEX NUV data provides a complementary means of identifying star forming galaxies from their ultraviolet emission, and an opportunity to measure the SF–radius relation out to larger cluster-centric radii. Figure 4 shows the composite radial population gradient (magenta squares) in the fraction of cluster galaxies having blue rest-frame UV–optical colors , for the 23 clusters with deep GALEX NUV data and SDSS photometry. The color limit lies in the middle of the UV–optical “green valley” (Wyder et al., 2007), and allows passively-evolving galaxies to be efficiently excluded without losing dusty star-forming galaxies due to reddening (Haines et al., 2008). Optically-quiescent early-type galaxies with residual (or “rejuvenated”) extended star formation in the form of rings or spiral arms should also still be recovered (Salim & Rich, 2010).
As before, the fraction of star-forming cluster galaxies increases steadily with cluster-centric radius from in the cluster core to at 4–5 (). The fraction of star-forming cluster galaxies remains significantly below that seen in coeval field galaxies (; magenta dashed line), even out at , the trend appearing to flatten off rather than continue upwards to field values. Again the two samples are confirmed to be coeval: each radial bin for the cluster population has a mean redshift in the range 0.217–0.236, while for field galaxies .
To allow comparison between the NUV-based and 24m-based SF–radius relations, the latter (gray points) is replotted from Fig. 2 after adjusting its vertical scale (right hand axis) to ensure that fractions of IR-selected and UV-selected star-forming field galaxies coincide on the plot. While both relations show the same steadily increasing trends with radius, the NUV-based SF–radius relation consistently lies above the re-scaled IR-based relation.
Looking at the IR-based SF-radius relation, it is tempting to suggest that the fraction of star-forming galaxies even falls to zero at the cluster core. However, we confirm that this is not the case. Further splitting each radial bin into four, the never fall below a floor value of 3–5% in the cluster core. Similarly, the NUV-based SF-radius relation never falls below 8–15% in the cluster core, when the radial bins are further sub-divided. A residual population of cluster galaxies with ongoing star formation exists at all radii.
3.2. Radial surface density profiles
The spatial distribution of galaxies within clusters provide key constraints on the primary epoch at which they were accreted into the system, as well as the effects of continual cluster mass growth on their orbital parameters and tidal and ram-pressure stripping on their stellar masses. Figure 5 shows the radial distribution of all galaxies in the stacked cluster out to , excluding BCGs (red points).
Large numerical DM simulations have found that DM halos are well described by a “universal” 2-parameter (NFW; Navarro et al., 1997) density profile from scales of 10 kpc out to 10 Mpc (Frenk et al., 1999; Gao et al., 2012). The NFW profile is characterized by a scale radius , where is the concentration parameter. The three-dimensional density profile is given by , where , and at . The NFW model has been shown to provide excellent fits to stacked tangential shear profiles of massive clusters (Okabe et al., 2013), and the distribution of cluster galaxies (Lin, Mohr & Stanford, 2004). The surface density profile, , of cluster galaxies in our ensemble cluster sample can be well described by a projected NFW profile with a concentration parameter (red curve), consistent with the value obtained by Lin, Mohr & Stanford (2004) or obtained by Budzynski et al. (2012), while Muzzin et al. (2007) obtained a higher concentration of for the stacked -band number density profile of galaxies from 15 clusters at . The value of 3.01 obtained here is still significantly lower than the value for the concentration of the overall mass distribution obtained by Okabe et al. (2013) from their weak lensing analysis of 50 clusters, including many of the systems in our sample.
The surface density, , of massive () cluster galaxies with obscured (blue points) declines steadily with radius from galaxies cluster-1 in the cluster cores to .4 by . These include corrections for spectroscopic incompleteness (§ 2.4) and the radial variation in coverage by the 24m images (§ 2.2). Even though the fraction of star-forming galaxies is falling to close to zero in cluster cores, clusters mark over-densities in the spatial distribution of star-forming galaxies in the plane of the sky. This is simply due to the cuspy density profile of the global cluster galaxy population more than compensating for the steady decrease in when approaching the cluster core. The surface density of cluster galaxies with (magenta squares) shows a similar radial profile, but is marginally steeper at small radii (). We will show in § 5.2 that these steadily declining trends in imply that star formation must survive within recently accreted spirals for several Gyr to build up the apparent over-densities of star-forming cluster galaxies.
3.3. Dynamical analysis of star-forming cluster galaxies
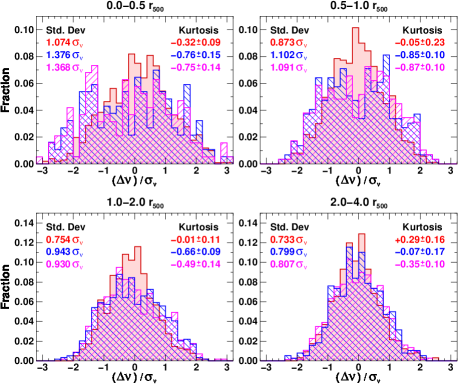
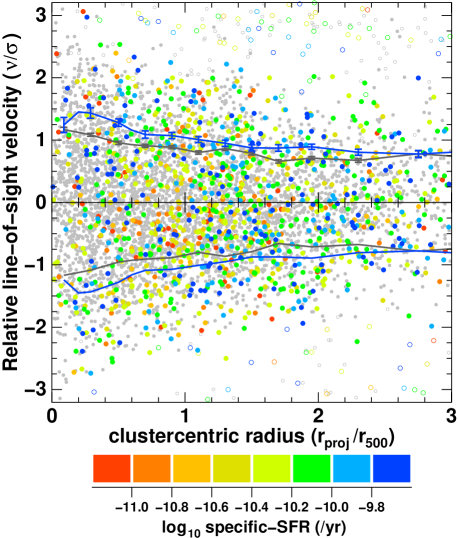
Figure 6 shows the stacked caustic diagram of all 30 clusters, in which the projected radius of each cluster member is normalized by the Chandra-based of that cluster, and the LOS velocities are scaled in units of . The 24m-detected star-forming galaxies (colored points) do not have the same spatial distribution within the caustic diagram as the remaining inactive cluster galaxy population (gray points). They appear to preferentially lie along the caustics, indicative of an infalling population. They also show a concentration at .0–1., covering the full velocity range within the caustics. The fall off in numbers towards larger radii is a selection effect due to the decline in Spitzer 24m coverage beyond . Star-forming galaxies do not entirely avoid the central region with low cluster-centric radii () and relative LOS velocities (), as X-ray AGN appear to do (Haines et al., 2012), but their frequency certainly drops off here, in marked contrast to the inactive cluster galaxy population. Some of the star-forming galaxies in these central regions of phase-space will likely appear here due to projection effects, being located along the line-of-sight of the cluster but physically still well outside (see Fig. 22).
The velocity dispersion of the star-forming cluster galaxy population (blue curve) is 10–35% higher than that of the inactive cluster galaxies (gray curve) at all radii. Averaging over all galaxies within (), star-forming galaxies have absolute LOS velocity offsets which are 26.4% (24.9%) higher than their passive counterparts at the same cluster-centric radius, a result significant at the 8.0 (10.7) level.
The same trends are obtained when selecting star-forming cluster galaxies according to their rest-frame color. Their velocity dispersion remains 10–35% higher than that of inactive cluster galaxies out to 2.5–3 , although at larger radii they become indistinguishable.
The relative LOS velocity distributions of star-forming (both 24m-detected and UV-selected) and inactive cluster galaxies for the stacked LoCuSS cluster sample are shown in Figure 7, in four bins of projected cluster-centric radius. The LOS velocity distributions of inactive galaxies (not detected at 24m and having ) can be approximately described as a Gaussian at all radii. The distributions of star-forming galaxies in the two inner radial bins () instead appear more consistent with a flat, top-hat profile than a Gaussian, including an relative excess of star-forming galaxies at in comparison to the inactive population. At 0.5–1.0 there is even marginal evidence a central dip in the LOS velocity distribution of star-forming galaxies. The kurtosis, of the LOS velocity distributions of star-forming galaxies () is significantly lower than that expected for a Gaussian distribution () at level in both inner radial bins, and closer to expectations for a uniform top-hat distribution (). At large cluster-centric radii (2.0–4.0 ), the velocity distribution of star-forming galaxies is consistent with a Gaussian function, and is almost indistinguishable from that of the inactive population, albeit with a marginally (%) higher dispersion.
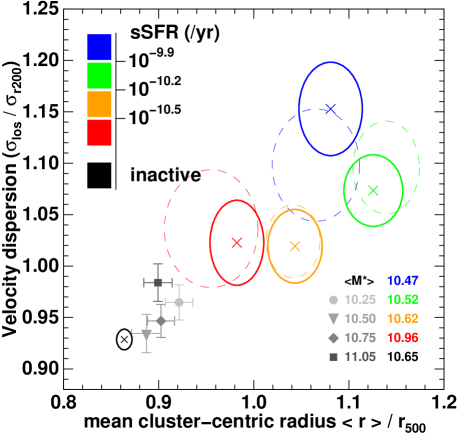
To further delineate the connection between the kinematics of cluster galaxies and their ability to form stars, the sample of 24m-detected cluster galaxies within is split into four bins of specific-SFR and their mean cluster-centric radii , and LOS velocity dispersions , compared in Figure 8. Kinematic segregation of galaxies with diverse specific-SFRs is apparent. Galaxies with the highest specific-SFRs (; blue cross) have the highest velocity dispersion as a population, and a higher mean cluster-centric radius, than those star-forming galaxies with the lowest specific-SFRs (; red cross). There is a general progression towards lower mean radii and LOS velocity dispersions with decreasing specific-SFR. This progression continues to the inactive galaxy cluster galaxy population (not detected at 24m; black cross), which has a significantly lower mean radius and velocity dispersion than any of the four sub-populations of star-forming galaxies.
The mean stellar masses of the star-forming cluster galaxies increases by 0.5 dex from the highest specific-SFR bin to those in the lowest one, reflecting the systematic decline in specific-SFR with stellar mass for star-forming cluster galaxies (Haines et al., 2013). We may thus be concerned that these kinematical differences are in fact due to mass segregation rather than a sequence in declining specific-SFR.
There is no evidence for mass segregation within our cluster galaxy population however, consistent with von der Linden et al. (2010). Splitting the cluster galaxy population into bins of stellar mass (grayscale symbols), much less variation in the mean radii and LOS velocity dispersions is seen between stellar mass bins in comparison to those split by specific-SFR, and no overall trend with stellar mass is visible. Moreover, the kinematic segregation by specific-SFR persists even if additional stellar mass cuts are applied to each specific-SFR bin to equalize their mean stellar masses (thin dashed ellipses).
4. Mapping the continual accretion of galaxies onto massive clusters in the Millennium simulation
To correctly interpret the previous observed trends in cluster galaxy properties, clusters must be placed in the cosmological context of continually accreting galaxies and groups from their surroundings. With this aim, we have examined the spatial distributions and orbits of galaxies in the vicinity of the 75 most massive clusters from the Millennium simulation (Springel et al., 2005), a cosmological dark matter simulation covering a (Mpc)3 volume. These clusters have present day virial masses in the range 4.0–23., velocity dispersions of 630–1540 km s-1, and a median formation epoch, . We have extracted volumes centered on each cluster. These volumes are extended in the -direction so that, for a distant observer viewing along this axis, all galaxies with LOS velocities within 5 000 km s-1 of the cluster redshift are included, enabling projection effects to be fully account for and quantified.
There exists a full database of properties for each galaxy in the simulation, including positions, peculiar velocities, absolute magnitudes, stellar masses etc., based upon the galform semi-analytic models (SAMs) of Bower et al. (2006) at 63 snapshots throughout the life-time of the Universe to . Similarly, another database provides the positions, velocities, masses () and radii () of each DM halo at each snapshot. For each galaxy and halo in a given snapshot, the database provides links to identify its most massive progenitor in the preceding snapshot, and so on, all the way back to its formation, allowing its mass growth and full merger history to be mapped in detail (see e.g. De Lucia & Blaizot 2007). This process also allows the orbit of each galaxy with respect to the cluster to be followed from formation to the present day, enabling us to determine its epoch of accretion () into the cluster, defined here as the redshift at which the galaxy passes within for the first time.
4.1. The infall of galaxies onto clusters
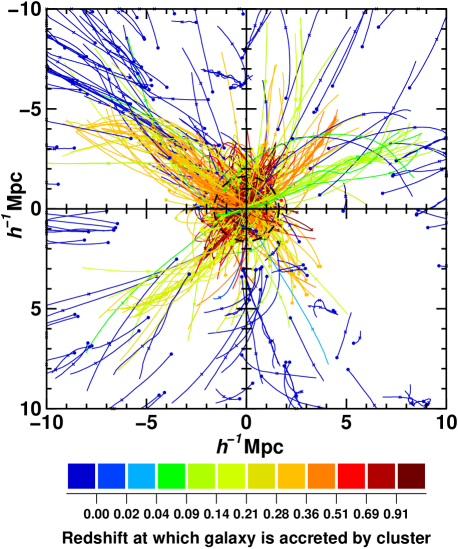
Figure 9 shows the orbits of galaxies about the tenth most massive cluster ( at ) in the Millennium simulation, color coded according to accretion epoch. Almost all the galaxies over the field-of-view are falling steadily into the cluster or have already been accreted. The complex large-scale structure around the cluster is apparent, including clear preferential directions for the galaxies to flow into the cluster, while other regions appear largely devoid of galaxies. Galaxies tend to be drawn first into the filaments from the surrounding field, then flow along the filaments into the cluster. While many galaxies are infalling as individual objects from the field, others are arriving into the cluster within galaxy groups (e.g. the tangle of green curves coming in from the right-hand side).
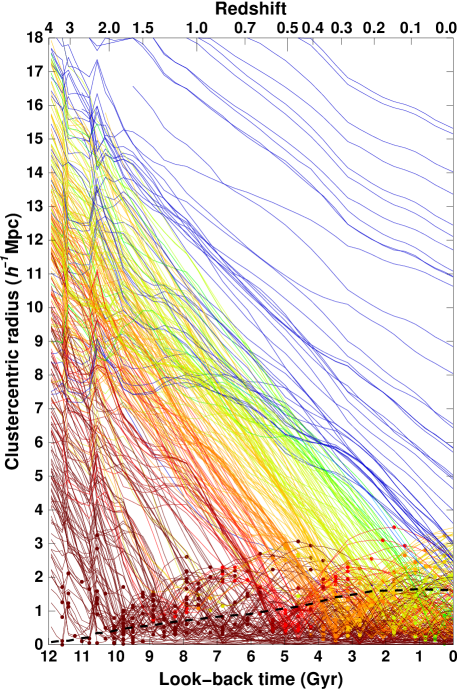
The full extent of the cluster’s gravitational sphere of influence is revealed in Fig. 10, with all galaxies within Mpc of the cluster falling steadily inwards. For all 75 clusters, the boundary between the infall regions and beyond, where galaxies remain attached to the Hubble flow, is found at a comoving distance 0–2Mpc from the cluster.
The infall of galaxies into the cluster is highly coherent, at least for : the radial velocities of infalling galaxies at the same cluster-centric radius at a given epoch are all roughly the same, and the future trajectories and accretion epochs of an infalling galaxy can be accurately estimated simply on the basis of their current cluster-centric distance. For example, almost all galaxies which were Mpc from the cluster 4 billion years ago, are due to be accreted into the cluster at , as indicated by the parallel diagonal green colored curves.
After accretion, galaxies remain bound to the cluster, but many have orbits which take them outside (black dashed curve), including some which bounce out as far as . These galaxies, rebounding out of the cluster after their first pericenter passage are known as the “back-splash” population. The time-scale required for galaxies to reach pericenter after being accreted is of the order 0.5–0.8 Gyr, while the orbital periods of the “back-splash” galaxies are much longer, only reaching their first apocenter 2–3 Gyr after passing through the cluster for the first time.
4.2. Phase-space diagrams
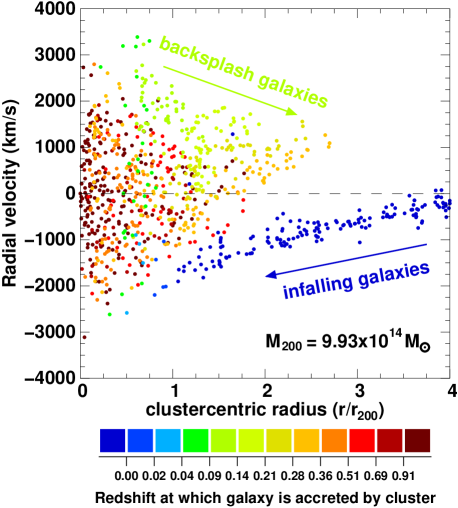
Figure 11 shows the distribution of galaxies in radial phase-space: radial velocity () versus cluster-centric radius () in units of , for the same cluster, where is the radial component of the galaxy’s velocity relative to the cluster, including a component from the Hubble expansion ().
The distribution of galaxies in phase-space splits into two reasonably well defined structures: a triangular-shaped virialized region containing galaxies which have passed through the cluster at least once; and a narrow stream of infalling galaxies (blue points) with negative radial velocities extending out to 4 (Mamon et al., 2004; Dünner et al., 2007). As the infalling galaxies plunge into the deep gravitational potential well of the cluster, they are continually accelerated, reaching infall velocities of up to 3 000 km s-1. After passing through pericenter, these galaxies reappear along the top edge of the triangular region as back-splash galaxies, coherently progressing outwards and slowing down with increasing towards the right-hand apex at that marks the apocenter of the orbits of those galaxies accreted Gyr ago. The radial phase-space diagram retains much of the information regarding the epoch of accretion of a galaxy, allowing this epoch to be accurately estimated for galaxies based on their location in the diagram, at least for those accreted within the last 3 Gyr. Only those which were accreted much earlier have had time for their orbits to become mixed.
Figure 12 shows the observable counterpart to Fig. 11: the caustic diagram, which plots the LOS velocity of galaxies relative to the cluster redshift () against projected cluster-centric radius () for the same cluster, as viewed by a distant observer along the -axis. The relative LOS velocity of galaxies combines the LOS component of their peculiar velocities with the contribution to their redshifts from the Hubble expansion: , where and are the LOS peculiar velocities of the galaxy and cluster DM halo respectively, and is the distance between the galaxy and the cluster halo along the line of sight.
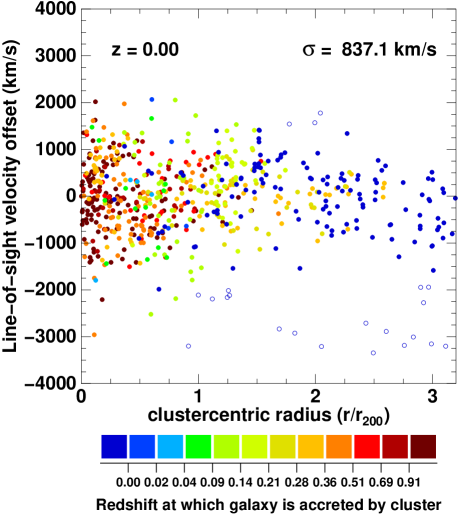
The distribution of cluster galaxies shows the typical “trumpet”-shaped caustic profile. Throughout this paper we refer to “spectroscopic” cluster members as those galaxies which lie within the caustic profiles determined for each of the 75 clusters. This is not the same as galaxies which are identified as satellites of the cluster DM halo, which are those physically located within the cluster halo (), or even the population of accreted galaxies that have passed within at some point in their history (but which may now be outside ). For this cluster, the separation between those galaxies that would be identified as “spectroscopic” cluster members, and those which are clearly background objects, roughly corresponds to a separation between those physically within Mpc of the cluster center (solid points), and those beyond this radius (open points). Indeed, all the galaxies shown earlier in Figure 10 are “spectroscopic” cluster members within a projected cluster-centric radius . Examining each of the 75 clusters individually, the cluster-centric distances that best separate “spectroscopic” members and clear fore/background objects are Mpc ().
Unlike the radial phase-space diagram, it is not possible to select individual galaxies from a specific region of the caustic diagram and then identify it as an infalling, recently accreted or virialized galaxy. However, several trends within the distribution of galaxies in the caustic diagram can be seen. First, those galaxies accreted earliest (; red points) are spatially localized in the cluster core with typical LOS velocities 000 km s-1. Second, beyond the bulk of galaxies have yet to be accreted into the cluster while the remainder all appear to be back-splash galaxies accreted Gyr ago. Finally, many of the galaxies with the largest LOS velocities ( 000 km s-1) have only recently arrived into the cluster (green points). Although these general trends hold for the vast majority of the clusters in our sample, there is significant cluster-to-cluster variation in the spatial distributions and relative contributions of galaxies accreted at different epochs, as expected given their dynamical immaturity.
4.3. Stacking the clusters
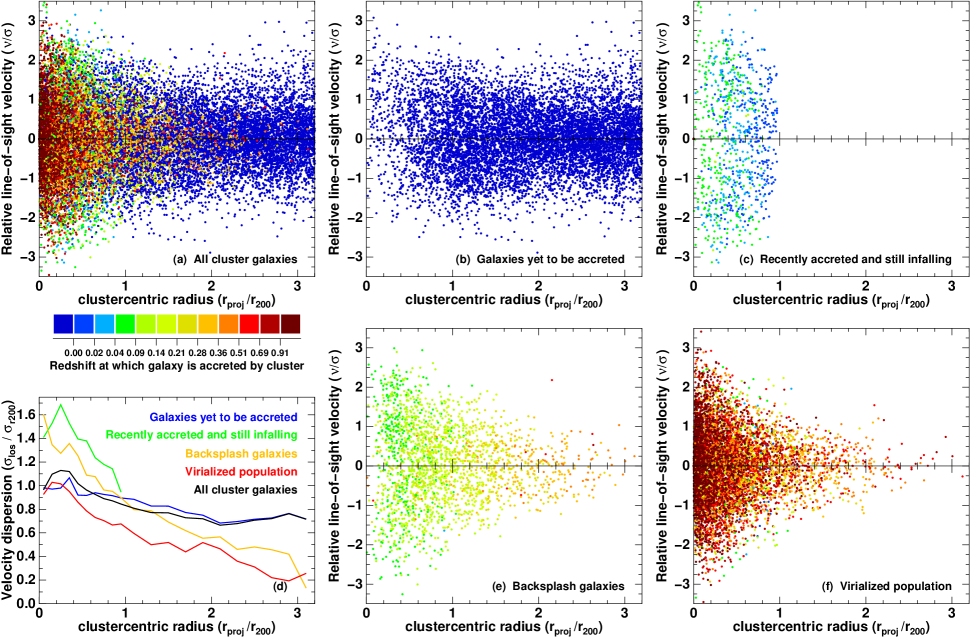
To account for the cluster-to-cluster scatter in a statistical way, the caustic diagrams for all 75 clusters are stacked to produce Fig. 13a. The cluster-centric radius of each cluster member is scaled by the of that cluster, and the LOS velocities are scaled in units of , the LOS velocity dispersion of all “spectroscopic” members within .
To demonstrate how the distribution of galaxy populations in the caustic plot provides information about their dynamical evolution and accretion history, the right-hand panels show the caustic diagrams after splitting the cluster population into four dynamical sub-populations, while panel (d) plots each of their velocity dispersion profiles alongside that for the overall cluster population. First, galaxies yet to pass within and be accreted (panel b) are found at all cluster-centric radii, becoming increasingly dominant with radius. The fall in numbers towards the cluster core () is due to the area of sky covered in any given narrow radial slice scaling as , rather than a physical decline in the surface density of such galaxies at low radii (see Fig. 17). The velocity dispersion of these galaxies remains relatively constant with radius, as they have yet to approach the cluster core
Panel (c) shows those infalling galaxies which have recently passed within for the first time, but have yet to reach pericenter. These objects are all found within by default. They have the highest LOS velocities of all our sub-populations (), being fully accelerated as they fall deep into the gravitational potential well of the cluster core, and at late epochs when the clusters are much more massive than at any previous point in their history.
Panel (e) shows the back-splash population of cluster galaxies which have passed through pericenter, and are now heading back out away from the cluster center (), but have yet to reach apocenter. These galaxies were typically accreted 1–4 Gyr ago. This population shows a triangular distribution in the caustic diagram, with high LOS-velocities (.3–1.) in the cluster core, having recently completed their first infall, which steadily fall as the galaxies rebound out of the cluster, slowing down as they attempt to climb back out of its potential well. The back-splash population extends as far out as 2–3 , where they can be differentiated from the infalling population by their characteristically low LOS-velocity dispersions (.4–0.), some 5% lower than the overall cluster population at the same cluster-centric distances (see Gill, Knebe & Gibson, 2005).
Finally, the virialized population (panel f) are those galaxies which were accreted at early epochs () and have all passed through apocenter of their first orbit. This population also presents a triangular distribution in the caustic diagram, but is much more concentrated towards the cluster core (particularly at ) than the back-splash galaxies, and has lower LOS-velocity dispersions at all radii. We identify this population with those galaxies that either formed locally or were accreted when the cluster’s core was being assembled. Their low velocities reflect the fact that the system they fell into was much less massive than the present-day cluster.
4.4. Radial population gradients
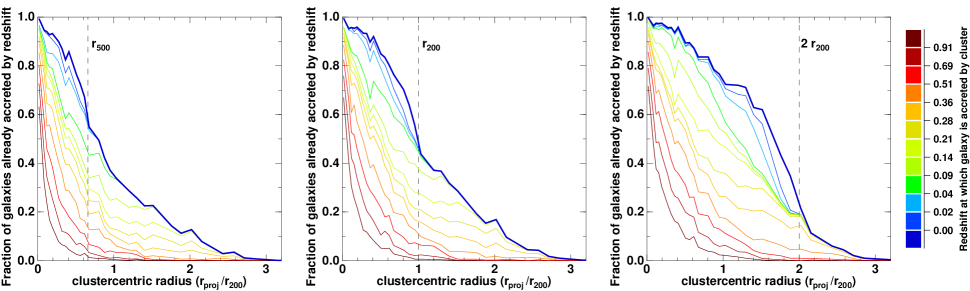
Figure 14 shows the radial population gradients obtained when stacking the 75 massive clusters as observed at . The thick blue curve in the middle panel shows how the fraction of “spectroscopic” cluster members which have been accreted varies as a function of projected cluster-centric radius, . This fraction drops slowly from 100% at the cluster core to 0% at , before falling at an ever increasing rate down to 0% by , and approaching zero by . For , this contribution represents the “back-splash” population galaxies which have previously been accreted into the cluster, but now have bounced back out beyond .
The remaining curves show the effects on this fraction by progressively excluding galaxies which were accreted after a given redshift. The first three curves () only diverge from the top curve at , as the most recently accreted galaxies haven’t had sufficient time to pass though the cluster and go back out beyond . As those galaxies accreted 1–3 Gyr ago are progressively excluded, the curves become increasingly steep within , and flatter beyond . The bulk of the “back-splash” population found beyond were accreted between and .
The remaining panels show the effect of changing the nominal radius for identifying when a galaxy has been accreted into a cluster. Reducing the accretion radius from to (left panel) simply squeezes the curves inwards by a comparable amount. Pushing the accretion radius outwards to (right panel) increases the prominence of the bump produced by recently accreted galaxies, but greatly reduces the contribution from back-splash galaxies, as so few galaxies which pass within rebound from the cluster beyond this radius.
The key aspect of all these curves is that irrespective of accretion epoch, , or the precise radius used to define accretion (within reasonable limits), the resulting radial population gradient drops from 00% in the cluster core to zero by . This steep gradient is primarily due to the complementary increase with radius in the fraction of “interloper” galaxies that have yet to be accreted into the cluster among the “spectroscopic” cluster population, from zero in the cluster core to 100% by . A second contribution to the steepness comes from the correlations between the epoch of accretion of satellite galaxies and their present cluster-centric distance (De Lucia et al., 2012), with those satellite galaxies close to the cluster core having been accreted significantly earlier on average than those located close to the virial radius (both physically or in projection). Gao et al. (2004) find the same radial trend for sub-halos, with the median accretion redshift of sub-halos in massive cluster halos decreasing from in the cluster core to at (their Fig. 15).
5. Constraining star formation quenching models by comparison to the observed SF–radius trends
Figures 2–4 showed that the fraction of massive cluster galaxies with or blue UV–optical colors increases steadily with cluster-centric radius, but at the largest radii probed, the remained significantly (20–30%) below that seen in coeval field galaxies in both cases.
In Figure 15 we attempt to reproduce these two SF-radius trends by a simple toy model in which the star formation of infalling field galaxies is instantaneously quenched at the moment they pass within of the cluster for the first time, or after a certain time delay (). The fraction of star-forming galaxies among this infalling field population is set to match our observed coeval field galaxy sample. The stacked radial population gradients for galaxies from the same 75 massive clusters in the Millennium simulation are reproduced, as they would appear if observed at , to best match the redshifts of the LoCuSS sample. The model galaxy positions and velocities relative to the cluster halo are now measured as they stood at , while the clusters are stacked using their and values measured at . At these clusters have M200 masses in the range 2.6–21., with a median of .
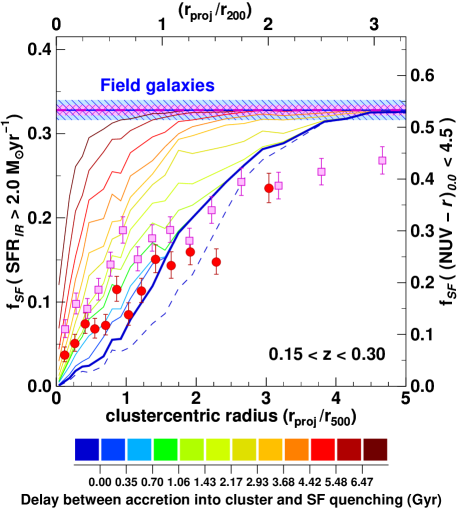
The predicted SF–radius relation in the case that star formation in all infalling galaxies is instantaneously quenched upon accretion (thick blue diagonal curve) is qualitatively similar in form to the observed trends, and consistent with the data points at , suggesting that this is to first order a reasonable assumption, as found previously by Balogh, Navarro & Morris (2000) and Haines et al. (2009). The model radial gradient is too steep however, resulting in predicted values of that are much higher than our data points in the range 1.8–3., and too low in the cluster core ().
The remaining colored curves show the effects of delaying the moment at which quenching occurs, by terminating star-formation only in those galaxies accreted into the cluster more than Gyr prior to observation, corresponding to the “delayed-then-rapid” quenching scenario of Wetzel et al. (2013). The “excess” obscured star-formation (red points) observed in the cluster core can then be reasonably reproduced by a model with a short quenching delay of the order 0.3–1.0 Gyr (light-blue/green curves). Much longer quenching time-delays ( Gyr) are clearly excluded, as they leave too many star-forming galaxies at .
One possible way to reconcile the model predictions with our data at 3–5 would be to initiate the quenching process at larger radii. The dashed curve shows the radial population gradient produced when star-formation in all infalling galaxies is immediately quenched when they pass within for the first time (rather than as before). While the fraction of star-forming galaxies has now been reduced sufficiently at , the gradient of the model trend remains much steeper than that observed, and vastly under-predicts the fraction of star-forming galaxies at .
The model curves provide little or no leeway to reproduce the low observed over 3–5 in the NUV-based SF–radius relation (magenta squares), as they all approach the field value at 3.5–4.0 (.5–3.), the radius at which the fraction of back-splash galaxies falls to zero (Fig. 14), irrespective of the radius at which quenching is initiated.
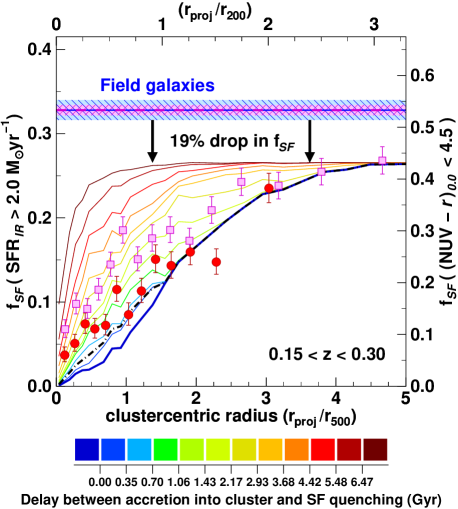
The only way to improve the model fits to these observations would be to allow the fraction of star-forming galaxies among the infalling population to be lower than that observed among the general coeval field population. We consider the simplest approach in Figure 16, that of simply reducing the of cluster galaxies by a single fixed amount (19%) from the value observed in the field, at all radii, to model the impact of whatever physical process is reducing star formation among galaxies in the infall regions of clusters. One feasible mechanism to achieve this is via the “pre-processing” of galaxies within galaxy groups which are subsequently accreted into clusters. The cosmological simulations of Gabor & Davé (2014) suggest that 0% of satellite galaxies within clusters are pre-processed, the fraction decreasing weakly with cluster-centric radius. The overall IR-based SF–radius relation can now be reproduced at all radii, via a model in which star-formation is quenched in galaxies .7–1.5 Gyr after being accreted into the cluster. This occurs on average after the galaxy has passed through the cluster core, as the observed trend lies above that predicted for the case in which star formation is quenched in galaxies at the moment they reach pericenter (black dot-dashed curve).
The NUV-based SF–radius relation is systematically above that of the IR-based inside , and is best-fit by a model is which star-formation is quenched in galaxies .1–3.6 Gyr after accretion, or slightly later than that suggested by the IR-based relation.
For all these model curves, to use the terminology of Peng et al. (2010, 2012), we assume that the environmental quenching process is 100% efficient (), i.e. all star-forming galaxies are quenched Gyr after accretion into the cluster. The result of decreasing for clusters would leave the model curves unchanged at large radii (), but squeeze the curves upwards in the core, effectively reducing the radial population gradient by a factor . The fact that the observed gradients are steep, with increasing fivefold over 0–3 , necessitates a high environmental quenching efficiency, , otherwise there would be evidence of a residual population of primordial cluster galaxies with ongoing star-formation in cluster cores ().
5.1. Uncertainties in the model trends
One concern about attempting to fit the SF–radius relation with model curves, is that the latter require the semi-analytic models to reliably follow the orbits of cluster galaxies long after their accretion, and accurately model the long-term evolution of their stellar masses once they become satellites. The Millennium simulation itself considers only the dark matter component, the baryons bolted on afterwards via SAMs.
When galaxies are accreted into massive clusters, their parent DM halos become sub-halos of the cluster halo, losing mass continuously through tidal stripping, until in many cases they fall below the resolution limit of the simulation, dissolving into the parent halo or are completely disrupted (Gao et al., 2004; Weinmann et al., 2010). The galaxies hosted by these sub-halos are much more compact and tightly bound than the dark matter, and as long as some of the surrounding sub-halo survives, are not expected to suffer significant stellar mass loss, although their diffuse hot gas halo is likely to be lost at a rate commensurate with that of the parent sub-halo (Guo et al., 2011). Prior to their accretion into the clusters, model galaxies at our lower stellar mass limit of typically have parent DM halos of masses in the Millennium simulation, comprising DM particles, and hence must suffer % stripping before their parent sub-halo falls below the mass resolution limit of 20 particles (Springel et al., 2005), a process which typically takes Gyr (Weinmann et al., 2010). Even after their parent sub-halo has been entirely disrupted, they are expected to survive as “orphan” galaxies, although now they will be likely subject to significant stellar mass loss via tidal stripping and may be completely disrupted.
The inclusion and treatment of “orphan” galaxies by SAMs is required to explain the cuspy radial satellite number density profiles observed within cluster halos (Fig. 17), which are much steeper than the relatively flat radial distributions of DM sub-halos within (Budzynski et al., 2012; Vogelsberger et al., 2014). These SAMs resort to ad hoc prescriptions for mass-stripping and adjustment of the orbits of these “orphan” galaxies within the cluster halos, resulting in strong variations in the radial satellite number density profiles within cluster cores (Budzynski et al., 2012), and the fractions of “orphans” in the cluster satellite population, from 25% in the Guo et al. (2011) model to 50% in the Bower et al. (2006) model (Gifford et al., 2013). This likely explains the inability of the predicted radial profile of model cluster galaxies from the Bower et al. (2006) SAM to match the observed radial profile at , overestimating the number density of cluster galaxies by a factor 2–3 (Fig. 5).
We should therefore be cautious about using model curves, such as those in Figs. 15 and 16, that depend upon the radial distribution and numbers of those galaxies accreted earliest into the clusters, and which have suffered repeated interactions over multiple orbits within the ever growing cluster halo. All the model curves in these two figures do this, even those referring to galaxies yet to be accreted into cluster, as they depend upon the relative contributions of those accreted after a given epoch, with all those accreted before the same epoch.
5.2. Radial galaxy surface density profiles
Figure 17 compares the radial galaxy surface density profiles, , of star-forming galaxies with model surface density profiles considering just those galaxies accreted within the last Gyr or which have not yet been accreted. This plot largely resolves the above issues, by focusing solely on star-forming galaxies, which are most likely to still have surviving parent sub-halos, and comparison model curves that contain just the most recent arrivals into clusters, and hence minimizing the uncertain contribution from “orphan” galaxies.
The surface density of star-forming () cluster galaxies from our ensemble of 30 clusters (blue points) declines steadily with radius out to , with no evidence of flattening off inside . This immediately rules out models in which star formation is instantaneously quenched when galaxies are accreted into clusters (thick blue curve), as these produce radial profiles which are essentially flat within . As recently accreted galaxies are progressively included, the radial density profile steadily builds up and steepens within . The best fitting curve to the Spitzer data is obtained by considering those model cluster galaxies accreted within the last Gyr, with a value of 21.15 for 23 data points and two degrees of freedom ( and ). The uncertainties in are derived as the values for which the value has increased by 2.30 from the minimum value.
Outside of , the shape of the profile for unobscured star-forming galaxies (magenta squares; , ), coincides well with that of the obscured star-forming population. In contrast, the profile for the UV-selected star-forming galaxies steepens more rapidly in the cluster core to form a cusp, paralleling that seen for the overall cluster population (red points). The best fitting curve to the NUV data has Gyr ( for 32 data points), implying that the NUV emission takes 1.1 Gyr longer after accretion to be shut down than the 24m emission.
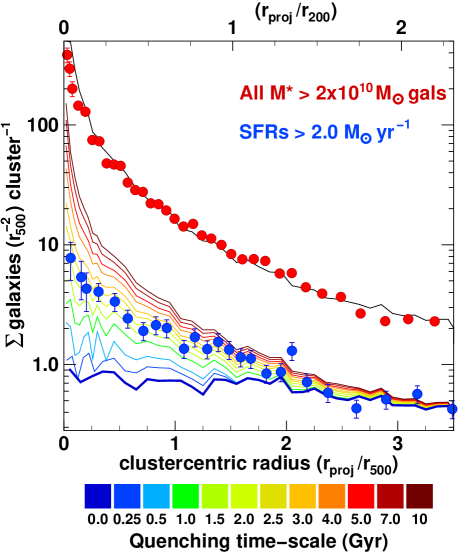
Figure 18 replots the profile for obscured star-forming cluster galaxies (blue points), but now compares it with slow quenching models. In this scenario model star-forming galaxies are accreted into the cluster and subsequently gradually quenched, their SFRs declining exponentially on a quenching time-scale until their SFRs fall below our nominal limit of 2.0 M⊙ yr-1. These model star-forming galaxies are given initial SFRs taken at random from our observed sample of coeval field star-forming galaxies (; ), the SFR distribution of which is shown in Fig. 2 of Haines et al. (2013). This should be reasonable given that the infrared luminosity functions of cluster and field galaxies are indistinguishable (Finn et al., 2010; Haines et al., 2011a, b, 2013), and the specific-SFRs of star-forming galaxies in infall regions are indistinguishable from those in coeval field samples (Haines et al., 2013). The colored curves show the predicted surface density profiles for quenching time-scales in the range 0.25–10.0 Gyr. The best fit model to observations has a quenching time-scale Gyr, with a value of 20.80 for 23 data points and two degrees of freedom (, ).
5.3. Dynamical analysis
The velocity dispersion profile (VDP) of cluster galaxies, , provides complementary constraints for the accretion epochs of galaxy sub-populations (see Fig. 13d). Figure 19 compares the observed VDPs of 24m-detected star-forming galaxies (blue points) with the predicted VDPs of model cluster galaxies, selected according to their accretion epoch.
The VDP for star-forming cluster galaxies shows a high, narrow peak of at , before dropping to the innermost radial bin, and a steady decline outwards to at large radii. This profile shape is best reproduced by model cluster populations combining infalling galaxies yet to be accreted and the most recent arrivals into the cluster. The progressive inclusion of these recently accreted galaxies causes the velocity dispersion within to rise rapidly, producing a characteristic sharp peak at which reaches a maximum height of when Gyr, along with a corresponding sharp drop off to the cluster core. The best overall match to observations is produced for models with .5–2.2 Gyr (light blue/green curves), comparable with the time-scales required for infalling galaxies to approach the pericenter of their orbits through the cluster and achieve the high velocities required to produce the observed peak in . The observed profile is inconsistent with models with much longer delays between accretion into the cluster and quenching ( Gyr), and models in which star-formation is quenched instantaneously upon accretion ( Gyr; thick blue curve), due to their predicted low, relatively flat LOS VDPs within .
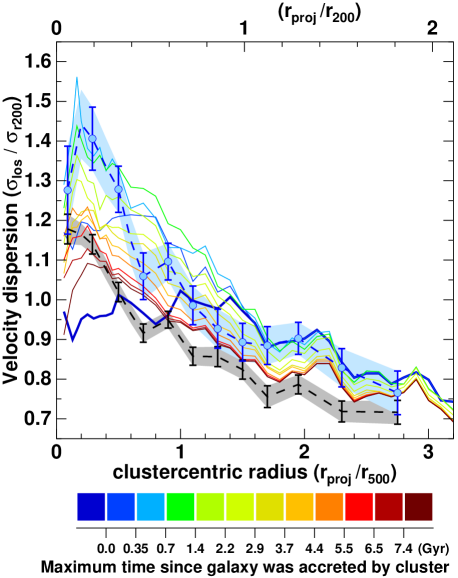
The observed VDP considering all cluster members (black dashed curve) is not well matched by any model profile. While the predicted VDP considering all “spectroscopic” cluster galaxies peaks at and drops off sharply towards the cluster core (dark red curve), the observed VDP shows no corresponding dip in the cluster core. The instead declines steadily from its peak value 1.18 in the innermost radial bin, falling to values of over the range 1.6–2., significantly below the velocity dispersions predicted by simulations at these radii. Our observed VDP is qualitatively similar to that obtained by Rines et al. (2003) by stacking the member galaxies of eight X-ray luminous clusters: their also drops from 1.1 in the cluster core to by , albeit with marginal evidence for a decline within . At larger radii (), their drops to values of , which is even lower than ours and hence poses further problems for the simulations.
One possible explanation is that the mis-match is linked to the prediction of too many model galaxies in the cluster core (; Fig. 5), which assuming that the excess population were all accreted early, could artificially increase the contribution from low-velocity virialized cluster members, reducing the estimates for each cluster, and pushing the resultant model curves upwards.
Irrespective of the difficulties in reproducing the observed VDP of all cluster members, the key finding that the velocity dispersion of star-forming galaxies is 10–35% higher than that of the overall cluster population at all radii, along with the apparent sharp peak in the VDP at , unambiguously identifies the star-forming cluster galaxy population as recent arrivals. Considering a simple kinematical treatment of infalling and virialized cluster galaxies in a cluster-scale gravitational potential well leads to for infalling galaxies and for the virialized population, where and are the kinematic and potential energies. Thus, the velocity dispersions of the two populations are naively related by (Colless & Dunn, 1996).
From the first dynamical studies of cluster galaxies, the velocity dispersions of spiral galaxies have been found to be systematically higher than early types (Tammann, 1972; Moss & Dickens, 1977). Based on much larger samples, the stacked velocity dispersions of blue/emission-line galaxies were found to be 20% higher than the remaining inactive galaxies (Biviano et al., 1997; Aguerri et al., 2007). Biviano & Katgert (2004) showed that if early-type galaxies are assumed to have isotropic orbits within clusters, as supported by their Gaussian velocity distributions, the kinematic properties of late-type spirals are inconsistent with being isotropic at the % level. Instead they indicate that spirals and emission-line galaxies follow radial orbits in clusters, pointing towards many of them being on their first cluster infall.
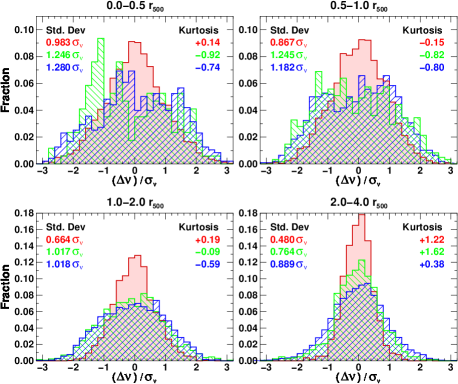
Figure 7 showed that the LOS velocity distribution of star-forming cluster galaxies within to have a rather flat, top-hat profile, a high LOS velocity dispersion and a negative kurtosis () strongly inconsistent with the Gaussian distribution typical of a virialized cluster population. This flat-topped distribution is well reproduced by model cluster galaxy populations that are either infalling into the cluster for the first time, or back-splash galaxies which are currently rebounding out of the cluster and are yet to reach apocenter (Fig. 20). The velocity distributions of these two dynamical sub-populations appear indistinguishable within , both having velocity dispersions and negative kurtosis values . At 1–2 the velocity distribution of star-forming galaxies becomes more rounded, albeit still with a negative kurtosis (), which again is well reproduced by the model infalling galaxy population (). At these radii, the back-splash population is expected to show a more Gaussian-like distribution with , inconsistent with observations. However, there are only expected to be 40% as many back-splash galaxies in this radial bin as infalling ones, and so we cannot rule out the possibility these star-forming galaxies represent a mixture of infalling and back-splash populations.
5.4. Distribution of galaxies in the caustic diagram
The information gained from the galaxy surface density profiles and VDPs can be combined by comparing the observed spatial distribution of star-forming galaxies in the stacked caustic diagram (Fig. 6) with those obtained from the Millennium simulation (Fig. 13). Using the stacked sample of model galaxies from the 75 clusters extracted from the Millennium simulation, the distribution of model star-forming galaxies in the phase-space diagram versus was determined using the adaptive kernel estimator, for a range of quenching time-scales from 0–10 Gyr.
As in Section 5.2 model star-forming cluster galaxies are given initial SFRs taken at random from our observed sample of coeval field star-forming galaxies (; ). These are then set to decline exponentially on a quenching time once they pass within of the cluster, until their SFRs fall below our nominal limit of 2.0 M. The redshift at which each model galaxy was accreted into the cluster is known, from which the number of quenching time-scales passed between the epoch of accretion and the epoch of observation () can be determined, and hence its final SFR and whether it would still be classified as star forming. Those galaxies yet to be accreted are assumed to still be identified as star forming. For each quenching time-scale, , the spatial distribution of star-forming model galaxies in phase-space, , is determined using the adaptive Gaussian kernel method. Each model galaxy is represented by a 2D Gaussian kernel of width , where is the geometric mean of the local densities of the model galaxies in phase-space, and is the initial kernel width 0.2. To remove the effects of the discontinuity at , the phase-space distribution is mirrored about both velocity and radial axes. The distribution is normalized to unity when summed over the region , so that it can be considered a probability distribution function, P(, ).
The probability distributions of model star-forming galaxies for each value of are then compared with the observed distribution of star-forming galaxies in the stacked phase-space diagram (Fig. 6). The best-fitting model cluster population is identified using a maximum-likelihood analysis, determining the value of for which the likelihood is maximized, taking into account corrections for spectroscopic incompleteness and radial variation in coverage by our 24m images as before.
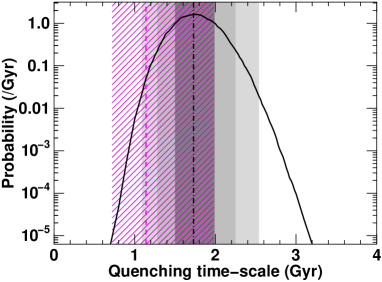
Figure 21 displays the resulting likelihood function as well as the 1, 2 and 3- confidence limits in . The closest match to the observed distribution of star-forming galaxies is obtained for a value of Gyr. Quenching time-scales below 1 Gyr and above 3 Gyr are both excluded at level, primarily due to the radial distribution of star-forming galaxies observed in our clusters (Fig. 18).
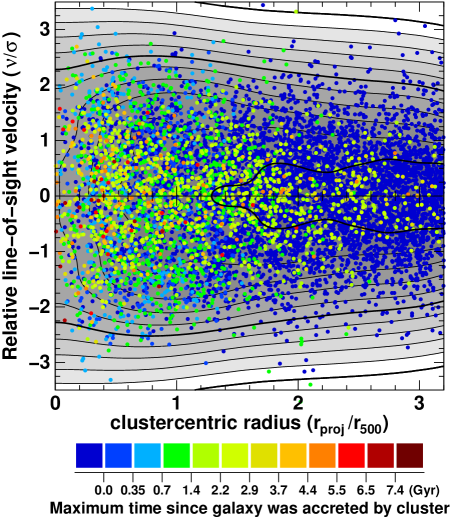
Figure 22 shows the corresponding stacked caustic diagram of model star-forming cluster galaxies for .73 Gyr. Each cluster galaxy is color coded according to its accretion epoch, and the overall phase-space density distribution is shown by the grayscale contours. The model star-forming galaxies are most frequently found at large cluster-centric radii () and low velocity offsets (). The phase-space density of star-forming galaxies drops by a factor as , for , producing the vertical contours in the left-center of the plot.
Averaging over the 75 simulated clusters, 42% of the model star-forming galaxies with and line-of-sight velocities identifying them as “spectroscopic” cluster members are physically located outside at the time of observation () and have not been inside this radius at any time (mid-blue points), 33% have been accreted within the last Gyr (light blue/green points), 19% were accreted 1–3 Gyr ago, and just 6% were accreted Gyr prior to observation. With the model SFRs declining exponentially upon accretion on a time-scale of 1.73 Gyr, overall the model SFRs and specific-SFRs of the star-forming cluster galaxies () are reduced by 25% from their values prior to accretion, consistent with the systematic reduction of 28% in their specific-SFRs found in Haines et al. (2013).
6. Discussion
We have shown via two independent methods that star formation in galaxies infalling into clusters is not extinguished immediately upon their arrival into the cluster, but requires a significant time of the order 1–3 Gyr to be quenched. First the steadily increasing surface density of star-forming galaxies towards the cluster core (Fig. 18), as opposed to the flat radial profile predicted for instantaneous quenching models, simply requires star-forming galaxies to survive for a certain period within the cluster to build up the over-density seen in the cluster core, with a best-fit exponential quenching time-scale Gyr. Second, the velocity dispersion profile of star-forming cluster galaxies is consistently 10–35% higher than inactive cluster galaxies at all radii, rising up to a sharp peak of at , which is inconsistent with instantaneous quenching models, but similar to the predicted VDPs of models in which star-forming galaxies survive for 0.5–2.2 Gyr after being accreted (Fig. 20). Combining both radial and velocity information, we compared the spatial distribution of star-forming galaxies within the caustic diagram with predictions from the Millennium simulation, to obtain a best-fit value of Gyr.
While these results robustly confirm that star-forming galaxies are able to continue forming stars for some significant period after being accreted into massive clusters, it is not possible simply based upon the kinematics or distribution of star-forming galaxies within clusters to distinguish between slow quenching models whereby star-formation declines exponentially (or linearly) over a long time-scale, or a “delayed-then-rapid” quenching model in which recent arrivals continue to form stars normally for a certain period , before suddenly stopping (Wetzel et al., 2012), as demonstrated by the similarity of the model curves in Figures 17 and 18.
6.1. The slow quenching of star formation in cluster galaxies
The key distinguishing feature of the “slow quenching” model is its impact on the distribution of SFRs or specific-SFRs among star-forming cluster galaxies, systematically lowering the mean specific-SFRs as a significant fraction of star-forming cluster galaxies are observed during this process of slow quenching, while the “delayed-then-rapid” quenching model leaves the specific-SFR distribution of star-forming cluster galaxies unchanged. Figure 8 supports the slow quenching model by finding kinematic segregation between star-forming cluster galaxies with normal or enhanced star formation, and those with reduced star-formation, indicative of ongoing quenching. This suggests that the process of quenching occurs over a sufficiently long time-scale that the kinematics and cluster-centric radii of quenching star-forming galaxies to have evolved significantly. More definitively, in Haines et al. (2013) we found that the specific-SFRs of massive () star-forming cluster galaxies within to be systematically 28% lower than their counterparts in the field at fixed stellar mass and redshift, a difference significant at the 8.7 level. The entire specific-SFR distribution was seen to be shifted to lower values, marking the unambiguous signature of star formation in most (and possibly all) star-forming galaxies being slowly quenched upon their arrival into massive clusters. Assuming a model in which the SFRs decline exponentially upon passing within , we obtained a best-fit quenching time-scale of Gyr (magenta dashed line and hashed region in Fig. 21), consistent with the time-scales obtained here.
As well as skewing the specific-SFR distribution of cluster galaxies on or near the star-forming main sequence, the slow quenching model is expected to result in significant numbers of galaxies with specific-SFRs of (or SFRs of 0.1–1 M), well below the sensitivity of our Spitzer data, and filling in the “green valley” gap between star-forming and passive galaxies. Wetzel et al. (2013) found no evidence of this large transition population, leading them to prefer a delayed-then-rapid quenching model. One possible way of reconciling these two results would be a slow-then-rapid quenching model, whereby star formation is slowly quenched for the first 1–3 Gyr, to explain the results of Haines et al. (2013), followed-by a second short phase in which the residual star-formation is rapidly terminated, in order to retain the observed bimodal specific-SFR distribution of satellite/cluster galaxies (Haines et al., 2011b; Wetzel et al., 2013).
Taranu et al. (2014) studied the bulge and disk colors of giant galaxies in clusters, finding shallow, gradual radial trends in disk colors that could be reproduced by slow quenching models similar to our own, but requiring slightly longer time-scales of 3–3.5 Gyr. They ruled out short ( Gyr) quenching time-scales and “delayed-then-rapid” quenching models as both produced much larger and sharper radial changes in the median disk colors than observed. A number of other studies have also argued for relatively long time-scales (1–4 Gyr) for the quenching of star formation in recently accreted cluster galaxies (Balogh, Navarro & Morris, 2000; Moran et al., 2007; Finn et al., 2008; von der Linden et al., 2010; De Lucia et al., 2012; Wetzel et al., 2013).
Muzzin et al. (2014) found a population of post-starburst galaxies in nine clusters, whose stacked spectrum could be fit by the rapid quenching ( Gyr) of typical star-forming galaxies, and which traced a coherent “ring” at 0.25–0.50 in the stacked caustic diagram that could be reproduced by recently accreted galaxies quenched 0.1–0.5 Gyr after passing within 0.5 . This much more rapid quenching in high redshift clusters could be due to the shorter gas consumption time-scales of galaxies at (Carilli & Walter, 2013) or shorter cluster crossing time-scales.
Slow quenching on Gyr time-scales matches predictions of starvation models, in which infalling galaxies are stripped of their diffuse gaseous halos as they pass through the ICM, preventing further gas accretion onto the galaxies from the surrounding inter-galactic medium (Larson et al., 1980; Bekki et al., 2002; McCarthy et al., 2009). The galaxy then slowly uses up its existing molecular and Hi gas reservoir over a period of 2–3 Gyr, based on the gas consumption time-scales observed for nearby spiral galaxies (Bigiel et al., 2011; Boselli et al., 2014). This process may be effective well beyond the virial radius, with the extended gaseous halo of clusters remaining hot (K) and sufficiently dense to strip the hot gas atmospheres of infalling galaxies out to (Bahé et al., 2013; Gabor & Davé, 2014).
Moreover, the growth of galactic DM halos is suppressed by tidal effects due to the presence of nearby cluster-mass halos (Hahn et al., 2009), which results in the peak mass of galactic halos infalling into clusters occurring at () on average (Behroozi et al., 2014). Given the tight correspondance between DM mass accretion and gas accretion onto galactic halos, including a significant fraction of gas accreted onto the galaxy via cold, dense filamentary streams at all redshifts (van de Voort et al., 2011), the radius of peak halo mass marks the end of continual gas replenishment of the ISM, signalling the beginning of the end for star formation in the host galaxy (Sánchez Almeida et al., 2014).
As these galaxies continue their journey towards the cluster core, the ICM they encounter becomes increasingly dense and the resultant ram pressures () become strong enough to progressively strip their gas disks from the outside in (Brüggen & de Lucia, 2008), producing truncated Hi, H2 gas and H disks (e.g. Koopmann & Kenney, 2004; Boselli et al., 2006, 2014), and outer regions showing recently quenched stellar populations (Crowl & Kenney, 2008). Hydrodynamical simulations predict that the moderate ram pressures acting on infalling massive spirals as they pass within are sufficient to strip half their gas contents on 500–1000 Myr time-scales (Roediger & Hensler, 2005), while observations confirm that ram pressure stripping is effective at removing gas and quenching star formation as far out as (Chung et al., 2007; Merluzzi et al., 2013). The effective time-scale for quenching via ram-pressure stripping then becomes the Gyr required for galaxies to travel from the cluster outskirts to the pericenter where the peak in ram pressure occurs (Roediger & Hensler, 2005). The complete absence of Hi-normal spirals within the radius of Virgo and Coma clusters (Boselli & Gavazzi, 2006), and the .5–0.8 dex Hi deficiencies of Virgo spirals at fixed stellar mass, color and stellar mass surface density, cannot be reproduced by predictions from chemospectrophotometric models involving starvation alone and can only be explained by ram-pressure stripping actively removing the gas (Cortese et al., 2011).
In typical spirals, the dust-to-gas ratio and internal extinction () decline steadily with radius (Muñoz-Mateos et al., 2009), meaning that for ram pressure stripping events where gas is removed from the outside in, the more extended unobscured star formation component should be preferentially quenched prior to the more concentrated and bound obscured SF. This is supported by the finding of a significant cluster population of 24m-detected spirals with reduced SFRs, indicative of ongoing slow quenching, reddened by dust onto the optical red sequence (Wolf et al., 2009). This appears inconsistent with our finding that the quenching time-scale for UV-selected star-forming cluster galaxies is Gyr longer than that for 24m-selected galaxies. We suggest that the longer for the NUV-selected star-forming galaxies is due to the 1–1.5 Gyr time-scale required for recently quenched galaxies to migrate from the blue cloud to red sequence in the versus C-M diagram (Kaviraj et al., 2007), while the 24m emission mostly originates from Hii regions with ongoing star formation (e.g. Calzetti et al., 2005).
6.2. Pre-processing
In the SF–radius trends of Figs. 2–4, the fraction of star-forming cluster galaxies rises steadily with radius, but crucially the remain stubbornly 20–30% below that seen in coeval field populations even out at , well beyond the maximal distances back-splash galaxies are expected to rebound to. As a result, these trends cannot be reproduced by models in which star formation is quenched in infalling galaxies via processes that are only initiated when they are accreted into the clusters (Fig. 15). Our SF–radius trends are very similar to those of Chung et al. (2011), who analysed 69 clusters covered by both SDSS spectroscopy and WISE 22m photometry, finding that the fraction of star-forming galaxies with increases steadily with cluster-centric radius, but remains well below the field value even at . von der Linden et al. (2010) found that suppression of star-formation in cluster galaxies could be traced out to . Wetzel et al. (2012) found their suppressed with respect to field values as far out as 10 around cluster-mass halos (M), but interestingly saw this suppression entirely limited to satellite galaxies, with no evidence of suppression among centrals found beyond 1–2 .
The best way to reproduce the observed SF–radius trends appears to require a certain fraction of infalling galaxies to arrive onto the clusters having already been quenched (Fig. 16). One commonly identified mechanism by which galaxies may be transformed at large distances from the cluster center is through “pre-processing” in infalling galaxy groups (e.g. Kodama et al., 2001; Fujita, 2004; Berrier et al., 2009; McGee et al., 2009; Dressler et al., 2013). Star formation is suppressed in group galaxies, with values intermediate between those of field and cluster galaxy populations (Wilman et al., 2005; Bai et al., 2010; McGee et al., 2011; Rasmussen et al., 2012) up to at least (Balogh et al., 2011; Ziparo et al., 2014). The fraction of star-forming galaxies within groups declines steadily with increasing group mass (at fixed stellar mass and group-centric distance) and proximity to the group center (Weinmann et al., 2006; Wetzel et al., 2012; Woo et al., 2013). The fractions and specific-SFRs of star-forming galaxies within groups both show accelerated declines since with respect to the coeval field population (Popesso et al., 2014) and also “filament-like” environments with comparably high galaxy densities but no X-ray emission (Ziparo et al., 2014), indicative of ongoing slow quenching within groups (Balogh et al., 2011), comparable to that seen in our clusters (Haines et al., 2013). Galaxies in groups with masses are Hi-deficient at fixed stellar mass and color, suggesting that ram-pressure stripping can remove atomic gas from spirals in such groups (Catinella et al., 2013).
Galaxy groups are ubiquitous, and host 0% of galaxies in the local Universe (McGee et al., 2009). The impact of environmental quenching in groups will be manifest also in a reduced global fraction of star-forming galaxies in our coeval field sample. Hence, in order to reproduce the observation that the fraction of star-forming galaxies in the infall regions of clusters (2–3 ) remains significantly lower than that seen in coeval field galaxies, a specific form of “pre-processing” is required, in which the galaxies infalling into clusters are more likely to be existing members of groups and hence more likely to be “pre-processed” than the cosmic average. That is we require the mass function of DM halos hosting galaxies in the surroundings of clusters (not including the cluster itself) to be top heavy and biased towards group-scale masses with respect to the cosmic average, as expected in such over-dense regions of the universe (Faltenbacher et al., 2010).
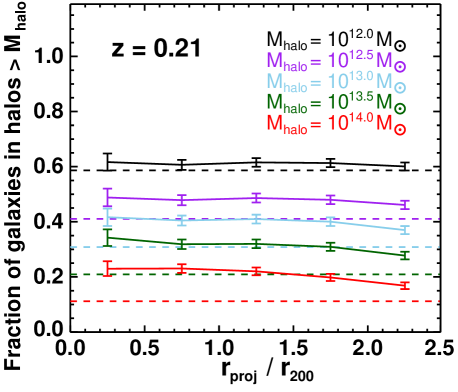
To examine this issue, we construct the mass function of the DM halos hosting galaxies at different cluster-centric radii and compare it with that of coeval field galaxies. We select galaxies within 4000 km s-1 of the mean redshifts of rich clusters (M) in the Millennium simulation at (see Lu et al., 2012, for details), excluding those galaxies already accreted into the clusters. Figure 23 shows the resulting fractions of these model galaxies which reside in halos over a given mass as a function of projected cluster-centric radius (solid curves) for five values of minimum halo mass from to . The dashed lines show the corresponding fractions for coeval field galaxies over the whole Millennium simulation. This confirms that galaxies infalling into clusters are indeed more likely to already reside within DM halos of a given mass than coeval field galaxies, for each halo mass range. While the effect is marginal for mass halos, galaxies infalling into massive clusters are 5% more likely to already be residing in group-mass halos with and twice as likely to already be residing in halos than their counterparts in the field.
We find numerous potential sites where infalling galaxies can be pre-processed before being accreted into the LoCuSS clusters (e.g. Pereira et al., 2010). Across the 23 clusters with XMM imaging, a total of 30 X-ray groups (with extended X-ray emission detected at levels) have been identified with redshifts placing them inside the cluster caustics, indicating that they are most likely infalling into the primary cluster (Haines et al. 2015, in preparation). Only six further “isolated” X-ray groups were detected (at ) in the same XMM images over the rest of the 0.15–0.30 redshift range.
The observed ratio of 5 X-ray groups associated with the clusters for every field X-ray group in the remainder of the volume covered by XMM, is double (quadruple) the ratio obtained for cluster and field (24m-detected) galaxies in the same two volumes. This suggests that infalling galaxies are 2–4 more likely to be members of X-ray groups than in typical field regions, assuming that both group samples have similar numbers of members per group.
A second factor in the shortfall in at large radii could arise from a bias in the mass assembly history of the infalling galaxies and groups themselves. Maulbetsch et al. (2007) find that galactic halos in high-density regions, such as the infall regions of massive clusters, form earlier, have more active merger histories, and have much lower mass accretion rates (and commensurate gas accretion rates; van de Voort et al., 2011) at late epochs () than those which form in low-density field environments. Such halos in high-density regions are likelier to not be accreting any mass (or even losing it) at late epochs than those in low-density regions.
7. Summary
We present an analysis of the radial distribution and kinematics of star-forming galaxies in 30 massive clusters at , combining wide-field Spitzer 24m and GALEX NUV photometry with highly-complete spectroscopy of cluster members. To gain insights into how the observed trends relate to the continual accretion of star-forming spirals onto massive clusters and subsequent quenching of star formation, we follow the infall and orbits of galaxies in the vicinity of the 75 most massive clusters in the Millennium cosmological simulation, obtaining a series of predicted model trends that should have general applicability for understanding galaxy evolution in cluster environments. Our main results are summarized below:
-
1.
The surface density of star-forming galaxies declines steadily with radius, falling from the cluster core to . This simple observation requires star formation to survive within recently accreted spirals for 2–3 Gyr to build up the apparent over-density of star-forming galaxies within clusters.
-
2.
The velocity dispersion profile of the star-forming cluster galaxy population shows a sharp peak of 1.44 at 0.3 , and is 10–35% higher than that of the inactive cluster members at all cluster-centric radii, while their velocity distribution shows a flat, top-hat profile within . All of these results are consistent with star-forming cluster galaxies being an infalling population, but one that must also survive .5–2 Gyr beyond passing within to achieve the high observed velocities.
-
3.
The distribution of star-forming galaxies in the stacked caustic diagram are best-fit by models in which their SFRs decline exponentially on quenching time-scales Gyr upon accretion into the cluster. The above results, and the observed kinematic segregation of star-forming galaxies according to their specific-SFRs, support the conclusion from Haines et al. (2013) that star formation in most (and possibly all) high-mass star-forming galaxies is slowly quenched on accretion into rich clusters on 0.7–2.0 Gyr time-scales
-
4.
The fraction () of star-forming cluster galaxies rises steadily with cluster-centric radius, increasing five-fold by , but remains well below field values even at . Pre-processing in infalling galaxy groups appears the most likely explanation for this suppression of star-formation at large distances from the cluster.
Acknowledgements
CPH was funded by CONICYT Anillo project ACT-1122. GPS acknowledges support from the Royal Society. FZ and GPS acknowledge support from the Science and Technology Facilities Council. We acknowledge NASA funding for this project under the Spitzer program GO:40872. This work was supported in part by the National Science Foundation under Grant No. AST-1211349. The Millennium simulation databases used in this paper and the web application providing online access to them were constructed as part of the activities of the German Astrophysical Virtual Observatory.
References
- Aguerri et al. (2007) Aguerri J. A. L., Sánchez-Janssen R., Muñoz-Tuñón C., 2007, A&A, 471, 17
- Ascasibar & Diego (2008) Ascasibar Y., Diego J. M., 2008, MNRAS, 383, 369
- Bahé et al. (2013) Bahé Y. M., McCarthy I. G., Balogh M. L., Font A. S., 2013, MNRAS, 430, 3017
- Bai et al. (2010) Bai L., Rasmussen J., Mulchaey J. S., Dariush A., Raychaudhury S., Ponman T. J., 2010, ApJ, 713, 637
- Balogh, Navarro & Morris (2000) Balogh M. L., Navarro J. F., Morris S. L., 2000, ApJ, 540, 113
- Balogh et al. (2004) Balogh M. L., et al., 2004, MNRAS, 348, 1355
- Balogh et al. (2011) Balogh M. L., et al., 2011, MNRAS, 412, 2303
- Beers, Flynn & Gebhardt (1990) Beers T. C., Flynn K., Gebhardt K., 1990, AJ, 100, 32
- Behroozi et al. (2014) Behroozi P. S., Wechsler R. H., Lu Y., Hahn O., Busha M. T., Klypin A., Primack J. R., 2014, ApJ, 787, 156
- Bekki et al. (2002) Bekki K., Couch W. J., Shioya Y., 2002, ApJ, 577, 651
- Bell & de Jong (2001) Bell E. F., de Jong R. S., 2001, ApJ, 550, 212
- Bell et al. (2003) Bell E. F., McIntosh D. H., Katz N., Weinberg M.D., 2003, ApJS, 149, 289
- Berrier et al. (2009) Berrier J. C., Stewart K. R., Bullock J. S., Purcell C. W., Barton E. J., 2009, ApJ, 690, 1292
- Bertin & Arnouts (1996) Bertin E., & Arnouts S., 1996, A&AS, 117, 393
- Bigiel et al. (2011) Bigiel F., Leroy A. K., Walter F., et al. 2011, ApJ, 730, L13
- Binggeli et al. (1987) Binggeli B., Tammann G. A., Sandage A., 1987, AJ, 94, 251
- Biviano & Katgert (2004) Biviano A., Katgert P., 2004, A&A, 424, 779
- Biviano et al. (1997) Biviano A., et al., 1997, A&A, 321, 84
- Biviano et al. (2013) Biviano A., et al., 2013, A&A, 558, 1
- Böhringer et al. (2004) Böhringer H., et al., 2004, A&A, 425, 367
- Boselli et al. (2006) Boselli A., et al. 2006, ApJ, 651, 811
- Boselli et al. (2014) Boselli A., et al. 2014, A&A, 564, 67
- Boselli & Gavazzi (2006) Boselli A., & Gavazzi G., 2006, PASP, 118, 517
- Bower et al. (2006) Bower R. G., et al., 2006, MNRAS, 370, 645
- Boylan-Kolchin et al. (2009) Boylan-Kolchin M., Springel V., White S. D. M., Jenkins A., Lemson G., 2009, MNRAS, 398, 1150
- Bressan et al. (2006) Bressan A., et al. 2006, ApJ, 639, L55
- Brüggen & de Lucia (2008) Brüggen M., de Lucia G., 2008, MNRAS, 383, 1336
- Budzynski et al. (2012) Budzynski J. M., Koposov S. E., McCarthy I. G., McGee S. L., Belokurov V., 2012, MNRAS, 423, 104
- Calzetti et al. (2005) Calzetti D., et al., 2005, ApJ, 633, 871
- Carilli & Walter (2013) Carilli C. L., Walter F., 2013, ARA&A, 51, 105
- Catinella et al. (2013) Catinella B., et al., 2013, MNRAS, 436, 34
- Chabrier (2003) Chabrier G., 2003, PASP, 115, 763
- Chilingarian et al. (2010) Chilingarian I. V., Melchior A.-L., Zolotukhin I. Y. 2010, MNRAS, 405, 1409
- Chung et al. (2007) Chung A., van Gorkom J. H., Kenney J. D. P., Vollmer B., 2007, ApJ, 659, L115
- Chung et al. (2011) Chung S. M., Eisenhardt P. R., Gonzalez A. H., Stanford S. A., Brodwin M., Stern D., Jarrett T., 2011, ApJ, 743, 34
- Clemens et al. (2009) Clemens M. S., Bressan A., Panuzzo P., Rampazzo R., Silva L., Buson L., Granato G. L., 2009, MNRAS, 392, 982
- Colless & Dunn (1996) Colless M., Dunn A. M., 1996, ApJ, 458, 435
- Cortese et al. (2011) Cortese L., Catinella B., Boissier S., Boselli A., Heinis S., 2011, MNRAS, 415, 1797
- Crowl & Kenney (2008) Crowl H. H., Kenney J. D. P., 2008, AJ, 136, 1623
- Dale et al. (2012) Dale D. A., et al., 2012, ApJ, 745, 95
- De Lucia et al. (2007) De Lucia G., Blaizot J. 2007, MNRAS, 375, 2
- De Lucia et al. (2012) De Lucia G., Weinmann S., Poggianti B. M., Aragón-Salamanca A., Zaritsky D., 2012, MNRAS, 423, 1277
- Diaferio et al. (2001) Diaferio A., Kauffmann G., Balogh M. L., White S. D. M., Schade D., Ellingson E., 2001, MNRAS, 323, 999
- Dressler et al. (2013) Dressler A., Oemler A. Jr., Fritz J., Poggianti B. M., Gladdders M. D., Abramson L., Vulcani B., 2013, ApJ, 770, 62
- Dünner et al. (2007) Dünner R., Reisenegger A., Meza A., Araya P. A., Quintana H., 2007, MNRAS, 376, 1577
- Ellingson et al. (2001) Ellingson E., Lin H., Yee H. K. C., Carlberg R. G., 2001, ApJ, 547, 609
- Faltenbacher et al. (2010) Faltenbacher A., Finoguenov A., Drory N., 2010, ApJ, 712, 484
- Finn et al. (2008) Finn R. A., Balogh M. L., Zarizsky D., Miller C. J., Nichol R. C., 2008, ApJ, 679, 279
- Finn et al. (2010) Finn R. A., et al. 2010, ApJ, 720, 87
- Finoguenov et al. (2009) Finoguenov A., et al. 2009, ApJ, 704, 564
- Frenk et al. (1999) Frenk C. S., et al. 1999, ApJ, 525, 554
- Fujita (2004) Fujita Y., 2004, PASJ, 56, 29
- Gabor & Davé (2014) Gabor J. M., Davé R., preprint (arXiv:1405.1043)
- Gao et al. (2004) Gao L., White S. D. M., Jenkins A., Stoehr F., Springel V., 2004, MNRAS, 355, 819
- Gao et al. (2012) Gao L., Navarro J. F., Frenk C. S., Jenkins A., Springel V., White S. D. M., 2012, MNRAS, 425, 2169
- Gehrels (1986) Gehrels N., 1986, ApJ, 303, 336
- Geller et al. (2014) Geller M. J., et al. 2014, ApJ, 784, 52
- Gifford et al. (2013) Gifford D., Miller C., Kern N., 2013, ApJ, 773, 116
- Giles et al. (2012) Giles P. A., Maughan B. J., Birkinshaw M., Worrall D. M., Lancaster K., 2012, MNRAS, 419, 503
- Gill, Knebe & Gibson (2005) Gill S. P. D., Knebe A., Gibson B. K., 2005, MNRAS, 356, 1327
- Guo et al. (2011) Guo Q., White S., Boylan-Kolchin M., et al. 2011, MNRAS, 413, 101
- Hahn et al. (2009) Hahn O., Porciani C., Dekel A., Carollo C. M., 2009, MNRAS, 398, 1742
- Haines et al. (2007) Haines C. P., Gargiulo A., La Barbera F., Mercurio A., Merluzzi P., Busarello G., 2007, MNRAS, 381, 7
- Haines et al. (2008) Haines C. P., Gargiulo A., Merluzzi P., 2008, MNRAS, 385, 1201
- Haines et al. (2009) Haines C. P. et al. 2009, ApJ, 704, 126
- Haines et al. (2010) Haines C. P. et al. 2010, A&A, 518, L19
- Haines et al. (2011a) Haines C. P. et al. 2011a, MNRAS, 412, 127
- Haines et al. (2011b) Haines C. P. et al. 2011b, MNRAS, 412, 145
- Haines et al. (2012) Haines C. P. et al. 2012, ApJ, 754, 97
- Haines et al. (2013) Haines C. P. et al. 2013, ApJ, 775, 126
- Hernández-Fernández et al. (2014) Hernández-Fernández J. D., et al. 2014, MNRAS, 438, 2186
- Jaffé et al. (2015) Jaffé Y. L., Smith R., Candlish G. N., Poggianti B. M., Sheen Y.-K., Verheijen M. A. W., 2015, MNRAS, 448, 1715
- Kaviraj et al. (2007) Kaviraj S., Kirkby L. A., Silk J., Sarzi M., 2007, MNRAS, 382, 960
- Kennicutt (1983) Kennicutt R. C., Jr. 1983, AJ, 88, 483
- Kodama et al. (2001) Kodama T., Smail I., Nakata F., Okamura S., Bower R. G., 2001, ApJ, 562, L9
- Koopmann & Kenney (2004) Koopmann R. A., Kenney J. D. P., 2004, ApJ, 613, 866
- Kroupa (2002) Kroupa P., 2002, Science, 295, 82
- Larson et al. (1980) Larson R. B., Tinsley B. M., Caldwell C. N., 1980, MNRAS, 237, 692
- Lewis et al. (2002) Lewis I., et al., 2002, MNRAS, 334, 673
- Lin & Mohr (2004) Lin Y.-T. & Mohr J. J., 2004, ApJ, 617, 879
- Lin, Mohr & Stanford (2004) Lin Y.-T., Mohr J. J., Stanford S. A., 2004, ApJ, 610, 745
- Lu et al. (2012) Lu T., Gilbank D. G., McGee S. L., Balogh M. L., Gallagher S., 2012, MNRAS, 420, 126
- Mahajan et al. (2011) Mahajan, S., Mamon G. A., Raychaudhury S. 2011, MNRAS, 416, 2882
- Mamon et al. (2004) Mamon G. A., Sanchis T., Salvador-Solé E., Solanes J. M., 2004, A&A, 414, 445
- Mamon et al. (2010) Mamon G. A., Biviano A., Murante G., 2010, A&A, 520, 30
- Martino et al. (2014) Martino R., Mazzotta P., Bourdin H., Smith G. P., Bartalucci I., Marrone D. P., Finoguenov A., Okabe N., 2014, MNRAS, 443, 2342
- Maulbetsch et al. (2007) Maulbetsch C., Avila-Reese V., Colín P., Gottlöber S., Khalatyan A., Steinmetz M., 2007, ApJ, 654, 53
- McCarthy et al. (2009) McCarthy I. G., et al. 2009, MNRAS, 383, 593
- McGee et al. (2009) McGee S. L., Balogh M., L., Bower R. G., Font A. S., McCarthy I. G., 2009, MNRAS, 400, 937
- McGee et al. (2011) McGee S. L., Balogh M., L., Wilman D. J., Bower R. G., Mulchaey J. S., Parker L. C., Oemler A., 2011, MNRAS, 413, 996
- Mercurio et al. (2003) Mercurio A., et al., 2003, A&A, 397, 431
- Merluzzi et al. (2013) Merluzzi P., et al., 2013, MNRAS, 429, 1747
- Moran et al. (2007) Moran S. M., Ellis R. S., Treu T., Smith G. P., Rich R. M., Smail I., 2007, ApJ, 671, 1503
- Moss & Dickens (1977) Moss C., Dickens R. J., 1977, MNRAS, 178, 701
- Muñoz-Mateos et al. (2009) Muñoz-Mateos J. C., et al. 2009, ApJ, 701, 1965
- Muzzin et al. (2007) Muzzin A., et al., 2007, ApJ, 659, 1106
- Muzzin et al. (2014) Muzzin A., et al., 2014, ApJ, 796, 65
- Navarro et al. (1997) Navarro J. F., Frenk C. S., White S. D. M., 1997, ApJ, 490, 493
- Norberg et al. (2002) Norberg P. et al., 2002, MNRAS, 336, 907
- Okabe et al. (2010) Okabe N., Takada M., Umetsu K., Futamase T., Smith G. P., 2010, PASJ, 62, 811
- Okabe et al. (2013) Okabe N., Smith G. P., Umetsu K., Takada M., Futamase T.,2013, ApJ, 769, L35
- Owers et al. (2011) Owers M. S., Nulsen P. E. J., Couch W. J., 2011, ApJ, 741, 122
- Peng et al. (2010) Peng Y. et al., 2010, ApJ, 721, 193
- Peng et al. (2012) Peng Y. et al., 2012, ApJ, 757, 4
- Pereira et al. (2010) Pereira M. J. et al. 2010, A&A, 518, L40
- Piovan et al. (2003) Piovan L., Tantalo R., Chiosi C., 2003, A&A, 408, 559
- Popesso et al. (2014) Popesso P., et al. 2014, preprint (arXiv:1407.8214)
- Rasmussen et al. (2012) Rasmussen J., Mulchaey J. S., Lei B., Ponman T. J., Raychaudhury S., Dariush A., 2012, ApJ, 757, 122
- Rawle et al. (2012) Rawle T. D., et al. 2012, ApJ, 747, 29
- Rieke et al. (2004) Rieke G. H., et al. 2004, ApJS, 154, 25
- Rieke et al. (2009) Rieke G. H., Alonso-Herrero A., Weiner B. J., Pérez-González P. G., Blalock M., Donley J. L., Marcillac D., 2009, ApJ, 556
- Rines et al. (2003) Rines K., Geller M. J., Kurtz M. J., Diaferio A., 2003, AJ, 126, 2152
- Rines & Diaferio (2006) Rines K., Diaferio A., 2006, AJ, 132, 1275
- Rines et al. (2013) Rines K., Geller M. J., Diaferio A., Kurtz M. J., 2013, ApJ, 767, 15
- Roediger & Hensler (2005) Roediger E., Hensler G., 2005, A&A, 433, 875
- Salim & Rich (2010) Salim S., Rich R. M., 2010, ApJL, 714, 290
- Sánchez Almeida et al. (2014) Sánchez Almeida J., Elmegreen B. G., Muñoz-Tuñón C., Elmegreen D. M., 2014, A&ARv, 22, 71
- Sanderson & Ponman (2003) Sanderson A. J. R., & Ponman T. J., 2003, MNRAS, 345, 1241
- Sanderson & Ponman (2010) Sanderson A. J. R., & Ponman T. J., 2010, MNRAS, 402, 65
- Sanderson et al. (2009) Sanderson A. J. R., Edge A. C., Smith G. P., 2009, MNRAS, 398, 1698
- Smith et al. (2010a) Smith G. P., et al., 2010a, MNRAS, 409, 169
- Smith et al. (2010b) Smith G. P., et al., 2010b, A&A, 518, L18
- Springel et al. (2005) Springel V., et al., 2005, Nature, 435, 629
- Tammann (1972) Tammann G. A., 1972, A&A, 21, 355
- Taranu et al. (2014) Taranu D. S., et al. 2014, MNRAS, 440, 1934
- van de Voort et al. (2011) van de Voort F., Schaye J., Booth C. M., Haas M. R., Dalla Vecchia C., 2011, MNRAS, 414, 2458
- Vogelsberger et al. (2014) Vogelsberger M., Genel S., Springel V., et al. 2014, Nature, 509, 177
- von der Linden et al. (2010) von der Linden A., Wild V., Kauffmann G., White S. D. M., Weinmann S., 2010, MNRAS, 404, 1231
- Weinmann et al. (2006) Weinmann S. M., van den Bosch F. C., Yang X., Mo H. J., 2006, MNRAS, 366, 2
- Weinmann et al. (2010) Weinmann S. M., Kauffmann G., von der Linden A., de Lucia G., 2010, MNRAS, 406, 2249
- Wetzel et al. (2012) Wetzel A. R., Tinker J. L., Conroy C., 2012, MNRAS, 424, 232
- Wetzel et al. (2013) Wetzel A. R., Tinker J. L., Conroy C., van den Bosch F., 2013, MNRAS, 432, 336
- Wijesinghe et al. (2012) Wijesinghe D. B., et al., 2012, MNRAS, 423, 3679
- Wilman et al. (2005) Wilman D. J., Balogh M. L., Bower R. G., et al., 2005, MNRAS, 358, 88
- Wolf et al. (2009) Wolf C., et al., 2009, MNRAS, 393, 1302
- Woo et al. (2013) Woo J., Dekel A., Faber S. M., et al., 2013, MNRAS, 428, 3306
- Wyder et al. (2007) Wyder T. K., et al., 2007, ApJS, 173, 293
- Ziparo et al. (2014) Ziparo F., et al., 2014, MNRAS, 437, 458