Effect of inhomogeneities and substrate on the dynamics of the metal-insulator transition in thin films
Abstract
We study the thermal relaxation dynamics of films after the ultrafast photo-induced metal-insulator transition for two film samples grown on and substrates. We find two orders of magnitude difference in the recovery time (a few ns for the sample vs. hundreds of ns for the sample). We present a theoretical model to take into account the effect of inhomogeneities in the films on the relaxation dynamics. We obtain quantitative results that show how the microstructure of the film and the thermal conductivity of the interface between the film and the substrate affect long time-scale recovery dynamics. We also obtain a simple analytic relationship between the recovery time-scale and the film’s parameters.
I Introduction
Vanadium dioxide () undergoes a metal-insulator transition (MIT) around room temperature Morin (1959) enabling a wide range of potential applications. It has recently been shown that it is possible to photo-induce the insulator-to-metal transition in in the sub-picosecond timescale Cavalleri and Linde (1999); Cavalleri et al. (2001, 2004, 2005); Kim et al. (2006a); Nakajima et al. (2009); Cocker et al. (2010). This finding makes a material of great interest for electronic and photonic applications, such as ultra-fast switches or transistors. The realization of -based switches requires the ability to control the MIT dynamics using external fields, as well as a better understanding of the recovery mechanisms after the external field is turned off and the material returns to its normal state. The mechanism by which the photo-induced insulator-to-metal takes place in is still not fully understood due to the complexity of the electronic behavior of arising from the presence of strong electron-lattice coupling and electron-electron interactions Goodenough (1971); Zylbersztejn and Mott (1975); Pouget et al. (1975); Eyert (2002). As a result, is a unique material of great fundamental and practical interest.
At low temperatures ( K) the lattice has a monoclinic structure, whereas at high temperatures ( K) it has a tetragonal structure. This difference in lattice structure is reflected in the band structure: is an insulator in the monoclinic phase and a metal in the tetragonal phase. This simple picture is complicated by the fact that in electron-electron correlations are very strong and can provide an important contribution to the localization of the electronic states via the Mott mechanism Zylbersztejn and Mott (1975); Pouget et al. (1975); Paquet and Leroux-Hugon (1980); Stefanovich et al. (2000). It appears that a full account of the MIT must take into account the interplay of the lattice dynamics and the electron dynamics driven by strong electron-electron interactions. This is a fascinating and extremely challenging problem that in addition is complicated by the unavoidable presence of inhomogeneities Qazilbash et al. (2007); Wang et al. (2014).
Several works Becker et al. (1994); Kim et al. (2006a); Kübler et al. (2007); Hilton et al. (2007); Rini et al. (2008); Pashkin et al. (2011); Abreu et al. (2012); Cocker et al. (2012); Wall et al. (2013); Radue et al. (2015) have investigated the short timescale dynamics after the photo-induced transition. In particular, Ref. Lysenko et al., 2007 presented a comparison of the long timescale recovery dynamics between films on a crystal substrate or a glass substrate and found that the recovery time for the films on the glass substrate was much longer than for the films on a crystal substrate. The recovery time was modeled using the heat equation to describe the heat flow across the interface between the film and the substrate. The difference in the characteristic time between the two types of substrates was attributed to the fact that the thermal conductivity of the interface was expected to be much smaller for glass substrates than for crystal substrates.
In this work we present a theory to properly take into account the effect of inhomogeneities on the recovery dynamics of films. Our theory describes simultaneously: (i) the profile of the reflectivity across a thermal induced MIT; (ii) the long timescale recovery dynamics of the reflectivity after a photo-induced insulator-to-metal transition; (iii) the observed difference of two orders of magnitude between samples with different substrates. Inhomogeneities are due to the fact that the film is comprised of grains with different sizes and different local properties, such as strain Brassard et al. (2005); Aliev et al. (2006) and chemical composition.
The presence of inhomogeneities induces a distribution of values for the transition temperature within the film. To take this into account we derive a generalized heat equation that includes the fact that during the recovery from the photo-induced insulator-to-metal transition, at any given time a fraction of the sample is undergoing the metal-to-insulator transition, another fraction is still cooling in the metallic phase, and another fraction is already cooling in the insulating phase. A key ingredient of the generalized heat equation is the correct description of the time evolution of the fraction of the sample that is metallic, insulating, or undergoing the phase transition. We then use our theoretical model to obtain the scaling relation between the characteristic recovery time and the parameters of the films. Our theoretical model, and the underlying assumptions, are strongly supported by our experimental results. Differently than in Ref. Lysenko et al., 2007 our films have all crystal substrates, no glass. Yet, we find that can be more than two orders of magnitude different depending on the crystal substrate, or , Fig. 1.
The generalized heat equation, Eqs. (9), which properly takes into account the effect of the films inhomogeneities on the recovery dynamics is the main result of our work. Our theory allows the description of the recovery dynamics consistently with the measurements obtained for the thermally driven MIT. The scaling between the characteristic recovery time and the parameters of the film is another important result of our work.
Our work is relevant to the more general problem of how spatial inhomogeneities affect a first order phase transition. The ability of our treatment to contribute to this general problem relies on the fact that in the two phases across the first-order phase transition have very different electronic properties (metallic vs. insulating behavior) that allows us to get an accurate phase mapping, via optical reflectivity measurement, of the time evolution of the metallic (insulating) fraction and, indirectly, of the spatial inhomogeneities present during the transition.
The work is organized as follows. Sec. II describes the experimental arrangements to measure the optical reflectivity time-evolution. The details of the theoretical model that we use to characterize the distribution of the films’ inhomogeneities and the long-time dynamics of the reflectivity after a photo-induced insulator-to-metal transition are presented in Secs. III and IV, respectively. In Sec. V we demonstrate how the variations in statistical properties of the two films result in a significant difference in the relaxation timescales, and in Sec. VI we provide our conclusions.
II Experimental setup
In our experiments we studied two VO2 thin-film samples, both of which were produced using reactive-bias target ion beam deposition (RBTIBD) West et al. (2008). One sample was grown on mm thick c-Al2O3, and the thickness of the VO2 film was 80 nm. The other sample was grown on a mm thick TiO2 (011) substrate, and was measured to be 110 nm thick. X-ray diffraction (XRD) evaluation of both films showed them to be crystalline, and detailed characterization information is available in previous reports Wang et al. (2012); Radue et al. (2013).
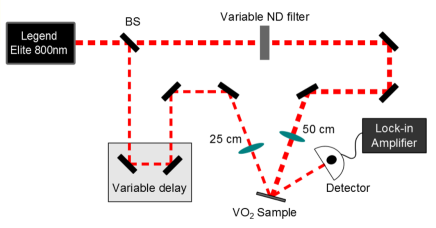
For the photo-induced insulator-to-metal transition experiments we used an ultrafast laser system (Coherent Mantis oscillator and Legend Elite regenerative amplifier) with approximately fs pulses with a central wavelength at nm and a repetition rate of 1 kHz. The properly attenuated output of the laser was split into strong pump pulses and weaker probe pulses using a beam splitter in a standard pump-probe configuration, shown in Fig. 2. The more powerful pump beam, focused to a m diameter spot on the surface of the sample, was used to induce the insulator-to-metal transition, and its fluence was controlled using a variable neutral-density filter (VF). The fluence of the probe beam was further attenuated to a value well below the insulator-to-metal threshold (J/cm2), and we used its reflectivity from the sample to monitor the instantaneous optical properties of the VO2 film. The probe pulses were directed along a variable delay stage to accurately control the relative timing between the pump and probe pulses by up to ns with a few fs precision. The probe beam was focused on the sample at the same spot as the pump beam, using a shorter focal length lens. When tuned to the center of the pump beam focal spot, the smaller probe beam diameter (m) ensured probing a region of uniform pump intensity.
The reflected probe power was measured using a silicon photodetector, and further analyzed using a lock-in amplifier. To minimize the effects of probe pulse instabilities, as well as long-terms drifts due to environmental changes, we report the relative change in probe reflection with the pump beam on or off.
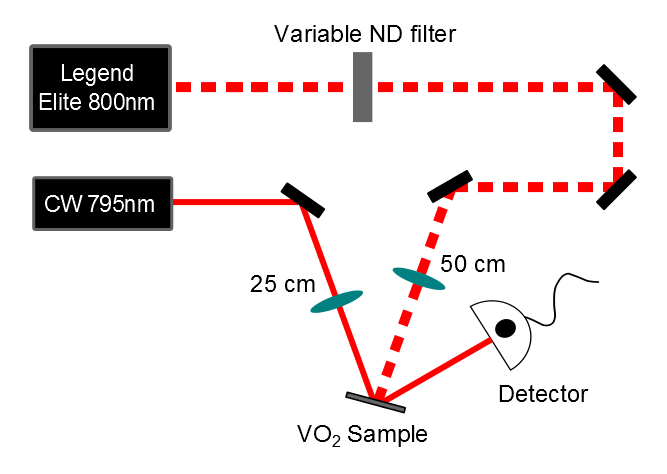
Notably the MIT relaxation of the / sample was not measurable with the femtosecond probe, as its characteristic decay time exceeded the ns maximum pulse separation, determined by the length of the delay stage. To measure the relaxation of the metallic VO2 grown on the rutile sample we modified our experimental setup by replacing the femtosecond probe pulses with a continuous-wave (CW) diode laser operating at nm and a fast photodiode (measured response time of approximately ns), as shown in Fig. 3. This detection method allowed us to measure changes in reflectivity for times longer than ns after the insulator-to-metal transition, that were inaccessible with the femtosecond probe arrangement.
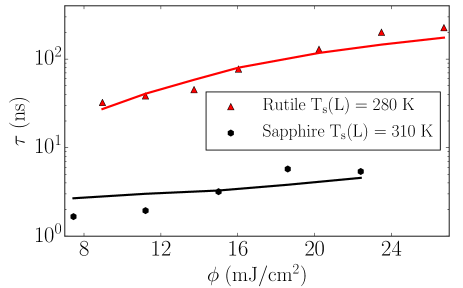
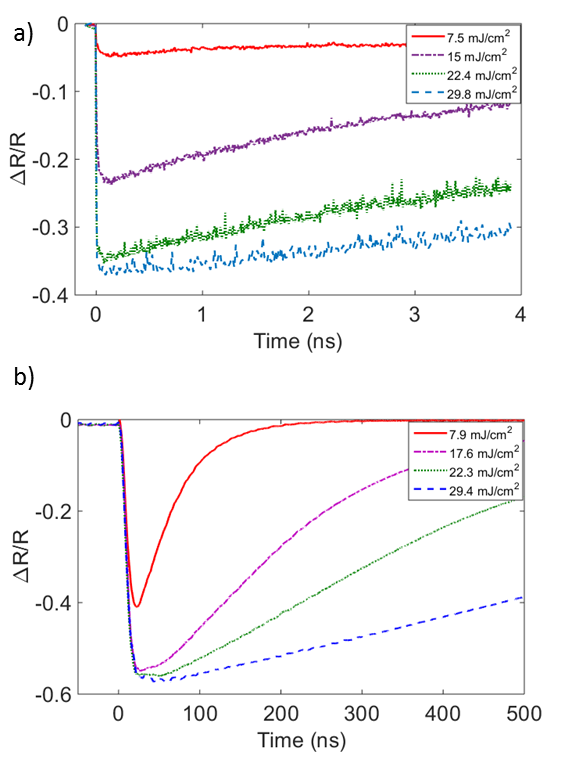
Figure 1 shows sample measurements of both the and films, using the femtosecond and CW probe arrangements respectively. The overall reflectivity depends on the refractive index of both the film and the substrate, and the refractive indices of and are different. Because it is easier to average the CW laser reflection signal, the curves for are smoother than the curves for the . The rutile reflection spectra recorded using the ultrafast probe had the same noise as for the sapphire samples, indicating that the differences in the noise are due to differences in the probes, not in the samples.
For values of the pump fluence higher than a threshold, which depends on the substrate temperature, we can see that the reflectivity, soon after the pump pulse, remains almost constant for some time, i.e. its dynamics exhibits a “flat” region, see in particular Fig. 1 (b). The observed “flattening” of the curves is due to the pump pulse heating the sample to a temperature above the threshold value for the thermally-induced insulator-to-metal transition Cocker et al. (2012); Radue et al. (2015). In this case the reflectivity stays unchanged at the level corresponding to a fully metallic phase until a non-negligible fraction of the sample cools down to the transition temperature. For all experimental curves only the later exponential part of the measured reflectivity was included into the fitting thermal relaxation time analysis.
The analysis of the relative reflectivity for both samples demonstrate that after the initial rapid change during the ultra-fast insulator-to-metal transition, its time evolution during the recovery is well fitted by a single exponential function with a recovery time constant :
| (1) |
where corresponds to the reflectivity in the insulating phase, and corresponds to the reflectivity at s. The results of such measurements are shown in Fig. 4: for films we obtained values of of the order of few nanoseconds, whereas it took the sample a few hundred nanoseconds to relax back to the insulating state. This two orders of magnitude difference in the recovery times was even more surprising considering that the characteristic times for the transition itself were quite similar, as demonstrated in previous studies Radue et al. (2015). In the discussion below we demonstrate that the relaxation dynamics strongly depend on the microstructure of the films which in turn is strongly influenced by the properties of the substrate and their interface. Figure 4 also reveals that the rate of thermal relaxation for both samples increases with higher pump power.
III Theoretical modeling of inhomogeneities
In order to take into account the effect of the inhomogeneities on the MIT dynamics the first step is to characterize them. To do this we can use the profile of the reflectivity across the thermally induced MIT. The dotted lines in Figures 5 (a), and (b) show the measured reflectivity as a function of temperature across the thermally induced MIT for a film grown on sapphire and , respectively.
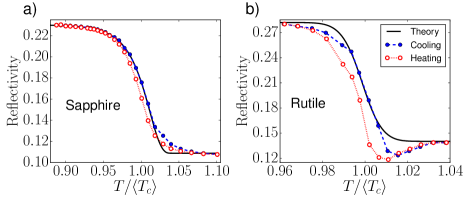
The temperature driven MIT in is a first-order transition. In the ideal case the reflectivity is expected to exhibit a finite, step-like, change at the critical temperature , at which the sample goes from a low-temperature insulating state to a high-temperature metallic state. In thin films, however, the optical reflectivity smoothly changes from the value corresponding to the insulating phase () to the value characteristic to the metallic phase () as the temperature increases, as Fig. 5 illustrates. For our samples the hysteresis loop is very narrow Radue et al. (2013). The fact that the MIT takes place over a range of temperatures implies that different regions of the sample have different values of . This is different from the case of an ideal, homogeneous, system for which the whole sample exhibits the coexistence of metallic and insulating regions only for . As a consequence the MIT in the films is characterized not by a single critical temperature but by a distribution of critical temperatures. This is due to the fact that the films are inhomogeneous: they are formed by crystal grains with different local properties. Different grains in general have different sizes, slightly different stoichiometry, and experience different local strains. It is very challenging to characterize the distribution of all the local properties that can affect the transition temperature of each grain. However, for our purposes, we only need and, as we show below, this can obtained directly from the profiles of without having to characterize the distribution of the local properties affecting . Let be the fraction of the sample in the insulating phase. At a given temperature we have:
| (2) |
Let be the fraction of the film in the metallic phase. To obtain the evolution of across the MIT, and therefore , considering that changes in the fraction of the film that is metallic (insulating) are the dominant cause of changes in the reflectivity, we can use a two-fluid effective medium theory (EMT) Bruggeman (1935); Landauer (1952); Zeng et al. (1988); Rossi et al. (2009). In the EMT the inhomogeneous system is replaced by an effective homogeneous medium having the same, bulk, electric properties. Let , be the dielectric constants (at the probing frequency) of in the metallic and insulating phase respectively. Then, the dielectric constant of the effective medium, , is given by the following equation:
| (3) |
In Eq. (3) is a factor that depends on the shape of the grain. Without loss of generality we set . Let and be the real and imaginary parts respectively of the index of refraction, so that for the effective medium and therefore
| (4) |
where corresponds to the probe incidence angle. Given our experimental setup we can reliably obtain the imaginary part of the index of refraction by measuring the absorption. For this reason we set the value of the imaginary part of the complex index of refraction , () for the metallic and (insulating) phase to the measured values, consistent with the values reported in the literature Verleur et al. (1968); Kana Kana et al. (2011), and then use Eq. (4) and the measured value of () in the metallic (insulating) phase to fix the corresponding value of (see Table 1).
Using Eqs. (2)-(4) we can obtain the profile of across the MIT for a given . Assuming to be a Gaussian distribution, by fitting the measured profile of to the one obtained using Eqs. 2-4 we can obtain the average value of the critical temperature and its standard deviation . For samples we find K, K, for samples K, K. The solid lines in Fig. 5 show the profiles of obtained using Eqs. (2)-(4) and the above values for and .
The difference in the value of between and samples can be attributed to the fact that , having a rutile structure, might induce strains into the film that should favor the metallic phase of . In general, strain effects are expected to play an important role in the physics of the MIT phase transition of films. In our approach such effects enter indirectly, via the form of the probability distribution , and the value of the thermal conductivity of the interface between the film and the substrate.
As we discuss in the following section, for our theoretical treatment of the recovery dynamics over long timescales of films the knowledge of , i.e., and , is all that is needed. As mentioned before the fact that is nonzero is due to inhomogeneities, of different nature, present in the film. It is practically impossible to know the distribution in the films of the properties affecting . However, it is interesting to consider the limit in which the grain size is the dominant property affecting . The reason is that in this limit it is possible to extract, using strong and fundamental arguments, the distribution, , for the grain size. In particular, it is possible to obtain the average grain size, , and its standard deviation, quantities that are of great practical interest. can be compared to estimates obtained using more direct experimental techniques, such as XRD. In the remainder of this section we use the experimental results for across the MIT to extract and its standard deviation.
Theoretical and experimental evidenceGranqvist and Buhrman (1976) indicates that for thin films the distribution of the grain size typically follows a logarithmic-normal distribution,
| (5) |
In Eq. (5) is the effective diameter of a grain, is the grain size (diameter) such that , and is the standard deviation of .
From general and fundamental arguments Fisher and Berker (1982); Challa et al. (1986); Zhang et al. (2000); Jiang et al. (2002) we have:
| (6) |
where is the bulk transition temperature and , equal to 2 nm in our case, is the grain’s diameter below which the grain is so small that is not possible to unambiguously identify its crystal structure. We set K, that is the temperature above which the samples is completely metallic. This value is higher than the value of bulk due to the strain experienced by the films Brassard et al. (2005); Aliev et al. (2006). The relation between and is given by:
| (7) |
Using Eqs. (2)-(7), by fitting the measured profile of across the MIT, we can obtain and therefore and its standard deviation. Figures 6 (a), (b) show the profiles of used to obtain the good theoretical fit to the evolution of shown in Fig. 5. These profiles correspond to nm nm for samples, and nm nm samples. It is interesting to compare the values of obtained using this approach to the values estimated using XRD. From XRD data Radue et al. (2015) we estimated nm for and nm for (see Table 1). These values are in remarkable semi-quantitative agreement with the values extracted from the profiles of across the MIT suggesting that the assumption that the grain size is the dominant property affecting the local value of might be qualitatively correct. It is therefore interesting to obtain the profiles of corresponding to the distributions of grain sizes shown in Figs. 6 (a), (b). Such profiles are shown in Figs. 6 (c), (d). The evolution of across the MIT obtained using these profiles is shown in Fig. 7.
| K | K | |
| K | ||
| nm | nm | |
| nm | nm | |
| nm | nm | |
| W/(K cm2) | W/(K cm2) |
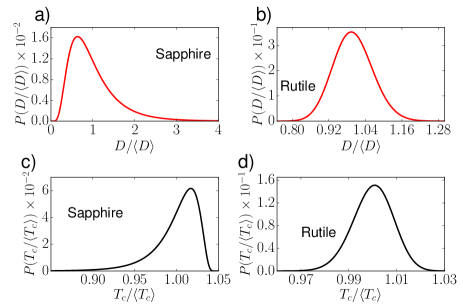
Our analysis suggest that the profiles could be an indirect method to characterize the distribution of grain sizes in films, a very challenging quantity to obtain using direct imaging experiments.
IV Theoretical modeling of the relaxation dynamics of the MIT
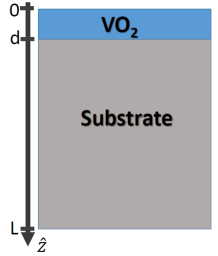
In our experiment the films have a thickness equal to or smaller than nm (see Fig. 8), which is comparable with the laser penetration depth nm Radue et al. (2015). Thus, we can assume that the pump pulse heats the film uniformly throughout its thickness. To describe the heat transfer process between the film and the substrate, we assume the temperature to be uniform throughout the film for all times. Effectively, given these conditions, the heat transfer problem becomes a one-dimensional problem, and the equation for the rate of change of the heat () in the film takes the form:
| (8) |
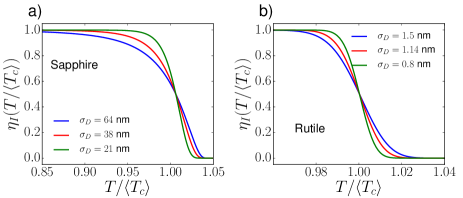
where is the film temperature, is the area of the film, () is the density in the insulating (metallic) phase, , () is the heat capacity in the insulating (metallic) phase, is the specific heat and is the fraction of the sample undergoing the MIT in the time interval during which the film temperature is in the interval . Here is the distribution of critical temperatures due to the inhomogeneities that we have obtained in the previous section. Using Eq. (2) and the fact that we can rewrite Eq. (8) in a form that more explicitly shows the effect due to the inhomogeneities, i.e. the fact that the MIT is not characterized by a single , but by a distribution of ’s:
| (9) |
Equation (9) is the main result of our work: it allows to properly take into account the effect of inhomogeneities on the long timescale dynamics across a first order phase transition. The key quantity entering Eq. (9) is the distribution that, as we have shown in the preceding section, can be obtained from the profile of across the thermally activated MIT. Our work is the first to combine the information from the thermally activated MIT to obtain a physically accurate heat equation to describe the recovery dynamics after a photo-induced MIT.
For the latent heat we have Fisher and Berker (1982); Challa et al. (1986); Zhang et al. (2000)
| (10) |
where is the value of the specific heat for bulk . Given Eq. (6), Eq. (10) implies .
The rate of change of heat in the film given by Eq. (8) must be equal to the heat current () across the interface between the film and the substrate:
| (11) |
where is the Kapitza constant characterizing the thermal conductivity of the interfaces Kapitza (1941); Pollack (1969); Stoner and Maris (1993); Wen et al. (2013), and is the temperature of the substrate at the surface facing the film. Combining Eq. (9) and Eq. (11), for we obtain the equation:
| (12) |
In Eq. (12) the only undetermined quantity is . We fix by fitting the theoretically obtained time evolution of to the one measured experimentally, for fixed experimental conditions such as the temperature of the substrate and the pump fluence. The robustness of the theory presented is evidenced by the fact that, the same fixed value of provides a good agreement between the theoretical and the experimental results for a broad range of experimental conditions.
To completely define the problem we need to supplement Eq. (12) with proper boundary conditions. The temperature distribution within the substrate, , satisfies the diffusion equation:
| (13) |
where , , are the thermal conductivity, heat capacity, and mass density, respectively, of the substrate. The bottom of the substrate, for which (see Fig. 8), is kept at a fixed temperature . At the film/substrate interface the heat transferred from the film must be equal to the heat current . We then have that the boundary conditions completing Eq. (13) are:
| (14) | |||
| (15) |
Equations (10),(12)-(15), combined with knowledge of the distribution completely define the temperature evolution of the film. Notice that in these equations the only unknown parameter is the Kapitza constant . All the other quantities are known from direct measurements. is obtained from the profile of across the MIT, independently from the dynamics of after the photo-induced insulator-to-metal transition. Also, the relation between the specific heat and is fixed by general and fundamental results Fisher and Berker (1982); Challa et al. (1986); Zhang et al. (2000).
While these equations can in general be solved only numerically, some qualitative understanding of the decay time can be gained if we make some simplifications. Let . At a temperature the insulating volume fraction is given by . Then assuming that the pump pulse is strong enough to drive the entire film into a fully metallic state at , the time-dependence of the insulating volume fraction can be approximated by a simple exponential form . In this case, an expression for the temperature can be obtained through the relationship . Furthermore, assuming that the substrate temperature does not change with time, and the latent heat to be temperature-independent, we can calculate the decay constant :
| (16) |
where the constants , and can only be determined by solving the full system of equations (12)-(15)
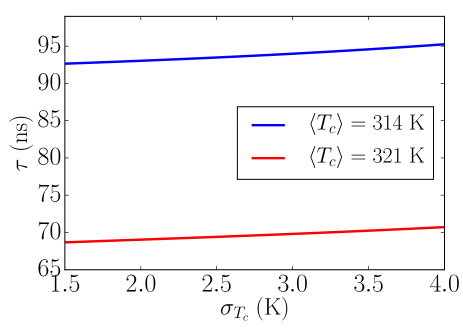
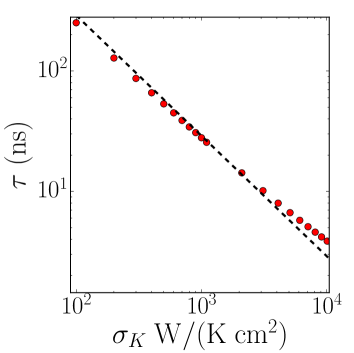
It is interesting to note that despite its many limitations, Eq.(16) captures many important qualitative traits of the actual relaxation process. For example, Figure (9) shows a plot of the decay constant as a function of obtained solving the full system of equations (12)-(14) for two different values of the average critical temperature, and same initial temperature K. It is easy to see that the decay time follows the linear trend predicted by Eq. (16) in the limit . Similarly, an exact solution shows the inverse dependence of on the Kapitza constant, , as shown in Figure 10.
The relation (16) is another important result of our work, it shows how the characteristic time of the recovery dynamics is related to the properties of the films. In particular it shows the novel result that grows linearly with , the standard deviation of . can be reliably obtained from the profile of across the MIT.
| VO2 heat capacity insulating phase Berglund and Guggenheim (1969) | 0.656 J/(g K) |
|---|---|
| heat capacity metallic phase Berglund and Guggenheim (1969) | 0.78 J/(g K) |
| density insulating phase Wen et al. (2013) | 4.57 g/cm3 |
| density metallic phase Wen et al. (2013) | 4.65 g/cm3 |
| thermal conductivity insulating phase Oh et al. (2010) | 3.5 W/(m K) |
| thermal conductivity metallic phase Oh et al. (2010) | 6 W/(m K) |
| bulk latent heat Berglund and Guggenheim (1969) | 51.8 J/g |
| TiO2 heat capacity de Ligny et al. (2002) | 0.686 J/(g K) |
| density Wen et al. (2013) | 4.25 g/cm3 |
| thermal conductivity Thurber and Mante (1965) | 8 W/(m K) |
| Al2O3 heat capacity Pishchik et al. (2009) | 0.779 J/(g K) |
| density Pishchik et al. (2009) | 3.98 g/cm3 |
| thermal conductivity Pishchik et al. (2009) | 30 W/(m K) |
| absorption coefficient at 800 nm Radue et al. (2015) | 0.01 nm-1 |
| absorption coefficient at 800 nm Radue et al. (2015) | 0.0076 nm-1 |
V Effect of inhomogeneities on the relaxation dynamics of the photo-induced MIT
Using the theoretical approach described in Sec. IV we can obtain the time evolution of the optical reflectivity through the MIT, as well as explain the significant difference in relaxation timescales between the two samples considered. In all the numerical calculations we assume , , , to be equal to the bulk values for insulating and metallic , see Table 2.
The initial film temperature is fixed by the pump fluence taking into account the Gaussian profile of the pulse and the fact that some of the heat is lost by the film during the time interval for which our analysis does not apply, is time at which the pump pulse hits the film and ns for films and ns for films.
As discussed in Sec. IV, is the only unknown parameter. For the case of samples, by fitting one of the curves for the dynamics of the reflectivity, we find W/(K cm2). We find that all experimental curves are well approximated assuming the same value for the Kapitza constant, see Fig. 11 (a). For the case of the characteristic timescale of the recovery is much shorter than for samples. As discussed in Sec. III the two samples have very different inhomogeneities: is almost 4 times larger in than . All other things being equal, Eq. (16) implies, see Fig. 12, that should be larger in than in , the opposite of what is observed experimentally. We are then led to conclude that in must be much higher than in . Figure 13 shows the measured evolution of for the sample for a fixed value of the fluence and substrate temperature, and the theoretical curves for this case that we obtain using the distribution obtained for and two different values of . We see that by choosing for the same value used for , there is no agreement between theory and experiment. By setting W/(K cm2) we obtain excellent agreement. Indeed, all the experimental curves for are well approximated by the theoretical results assuming W/(K cm2).
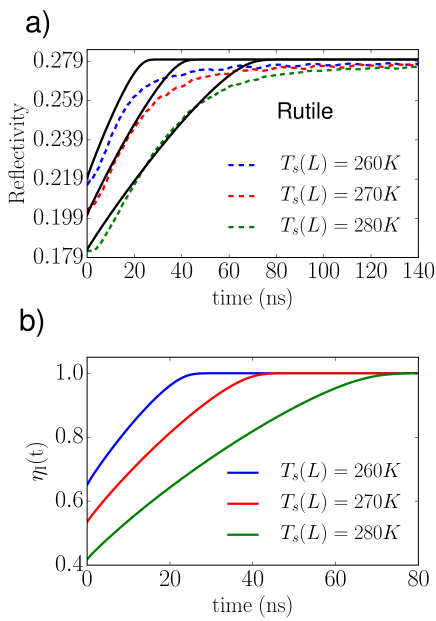
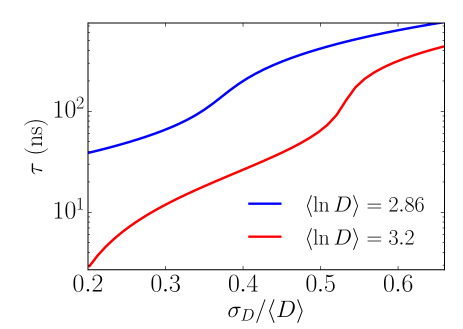
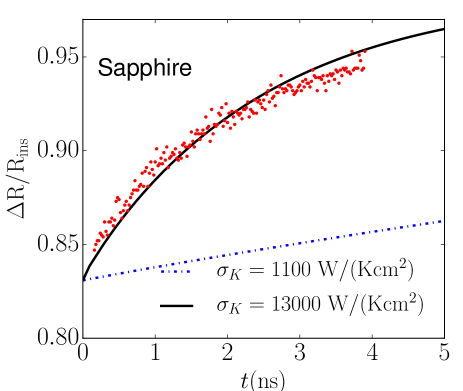
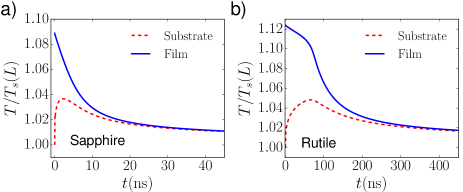
Figure 14 shows the time evolution of the film and substrate temperatures (close to the interface) for the film, panel (a), and for the film, panel (b), using the parameter values summarized in Table 2. It helps to qualitatively understand the differences in the thermal relaxation between the two samples. Due to the lower values of the Kapitza constant, thermal energy stays more concentrated near the - interface, keeping the temperature of the film above longer.
To investigate the temperature dependence of the thermal relaxation we repeated the measurements while changing the base substrate temperature of the sample. For these measurements the sample was placed inside a cryostat, and cooled down to temperatures between K and K. The results of these measurements, along with the theoretical calculations, are shown in Figure 15. We again observe a good semiquantitative agreement between theoretical and experimental results. Also, note that the simple expression for the decay constant Eq. (16) captures the overall decay rate drop at lower substrate temperatures .
We point out that all the theoretical curves are obtained using the fixed set of parameters shown in Table 2. As mentioned above, the only unknown parameter that enters the theory is . In the results presented above was fixed to a single value for each film, and this value was then used to obtain the results for a range of experimental conditions with different substrate temperatures and pump fluences. For example, Fig. 4 shows an excellent agreement between the experimental measurements and theoretical calculations across the entire range of pump fluences, limited on the lower end by our ability to reliably detect the variation in the probe reflectivity, and on the upper end by the damage threshold of our sample (pump fluence mJ/cm2).
VI Conclusions
In conclusion, we have presented a combined experimental and theoretical study of the long timescale recovery dynamics of films following an ultrafast photo-induced insulator-to-metal transition. We have developed a theoretical approach that is able to properly take into account the effect of inhomogeneities. The main results of our work are: (i) The derivation of the generalized heat equation (9) that properly takes into account that during the recovery, due to the inhomogeneities, only fraction of the sample is undergoing the metal-to-insulator transition and correctly tracks the evolution in time of the metallic (insulating) phase; (ii) The clarification of the connection between the temperature dependent profile ()) of the reflectivity across the thermally induced MIT and its dynamics after a photo-induced insulator-to-metal transition; (iii) The approximate relation, Eq. (16), between the characteristic time of the recovery dynamics and the parameters of the film, in particular to the standard deviation of the distribution of critical temperatures as extracted from ; (iv) The ability of our theory to describe, using a fixed value of the Kapitza constant, the recovery dynamics for different values of the substrate temperature and pump fluence. By changing the pump fluence the characteristic time of the recovery can be changed, experimentally, by two orders of magnitude: our theory is able to account for such a change.
The theoretical approach that we present is general and can be used to describe the dynamics (in the adiabatic limit) of inhomogeneous systems across a first order phase transition. The approximate relation between the characteristic time and the parameters of the system shows that is directly proportional to the width of the thermally activated transition. This result allows to estimate the recovery time of films solely on the basis of a measurement of across the MIT.
Assuming that variations of the size of the grains forming the films are the main source of inhomogeneities, using very general and fundamental relations between the grain size and the grain’s critical temperature, we have been able to obtain the distribution of the grain sizes. In particular, we have been able to estimate the average grain’s size and its standard deviation. We find that the calculated average grain’s size is in remarkable semi-quantitative agreement with the one obtained from XRD measurements. For systems in which inhomogeneities are mostly due to variations of the size of the grains, our analysis provides a way to obtain the size distribution from the temperature dependent profile of the reflectivity across the thermally induced MIT. This could be very useful considering that is a very challenging quantity to obtain via direct measurements.
VII Acknowledgments
This work was funded in part by NSF, DMR-1006013: Plasmon Resonances and Metal Insulator Transitions in Highly Correlated Thin Film Systems, Jeffress Trust Awards program in Interdisciplinary Research, ONR-N00014-13-1-0321, and the NASA Virginia Space Grant Consortium. We also acknowledge support from the NRI/SRC sponsored ViNC center and the Commonwealth of Virginia through the Virginia Micro-Electronics Consortium (VMEC).
References
- Morin (1959) F. J. Morin, “Oxides which show a metal-to-insulator transition at the neel temperature,” Phys. Rev. Lett. 3, 34–36 (1959).
- Cavalleri and Linde (1999) A Cavalleri and D Von Der Linde, “Rapid communication Single-pulse time- and fluence-resolved optical measurements at femtosecond excited surfaces,” Applied Physics A 579, 577–579 (1999).
- Cavalleri et al. (2001) A. Cavalleri, Cs. Tóth, C. Siders, J. Squier, F. Ráksi, P. Forget, and J. Kieffer, “Femtosecond Structural Dynamics in VO2 during an Ultrafast Solid-Solid Phase Transition,” Physical Review Letters 87, 237401 (2001).
- Cavalleri et al. (2004) A. Cavalleri, Th. Dekorsy, H. Chong, J. Kieffer, and R. Schoenlein, “Evidence for a structurally-driven insulator-to-metal transition in VO2: A view from the ultrafast timescale,” Physical Review B 70, 3–6 (2004).
- Cavalleri et al. (2005) A. Cavalleri, M. Rini, H. Chong, S. Fourmaux, T. Glover, P. Heimann, J. Kieffer, and R. Schoenlein, “Band-Selective Measurements of Electron Dynamics in VO2 Using Femtosecond Near-Edge X-Ray Absorption,” Physical Review Letters 95, 067405 (2005).
- Kim et al. (2006a) Hyun-Tak Kim, Yong-Wook Lee, Bong-Jun Kim, Byung-Gyu Chae, Sun Jin Yun, Kwang-Yong Kang, Kang-Jeon Han, Ki-Ju Yee, and Yong-Sik Lim, “Monoclinic and correlated metal phase in VO(2) as evidence of the Mott transition: coherent phonon analysis.” Physical Review Letters 97, 4 (2006a).
- Nakajima et al. (2009) M. Nakajima, N. Takubo, Z. Hiroi, Y. Ueda, and T. Suemoto, “Study of photo-induced phenomena in VO2 by terahertz pump-probe spectroscopy,” Journal of Luminescence 129, 1802–1805 (2009).
- Cocker et al. (2010) T. L. Cocker, L. V. Titova, S. Fourmaux, H. C. Bandulet, D. Brassard, J. C. Kieffer, M. A. El Khakani, and F. A. Hegmann, “Terahertz conductivity of the metal-insulator transition in a nanogranular VO[sub 2] film,” Applied Physics Letters 97, 221905 (2010).
- Goodenough (1971) John B. Goodenough, “The two components of the crystallographic transition in VO2,” Journal of Solid State Chemistry 3, 490–500 (1971).
- Zylbersztejn and Mott (1975) A. Zylbersztejn and N. F. Mott, “Metal-insulator transition in vanadium dioxide,” Phys. Rev. B 11, 4383–4395 (1975).
- Pouget et al. (1975) J. P. Pouget, H. Launois, J. P. D’Haenens, P. Merenda, and T. M. Rice, “Electron localization induced by uniaxial stress in pure v,” Phys. Rev. Lett. 35, 873–875 (1975).
- Eyert (2002) V. Eyert, “The metal-insulator transitions of VO2: A band theoretical approach,” Annalen der Physik 514, 650 (2002), arXiv:cond-mat/0210558 .
- Paquet and Leroux-Hugon (1980) D. Paquet and P. Leroux-Hugon, “Electron correlations and electron-lattice interactions in the metal-insulator, ferroelastic transition in v: A thermodynamical study,” Phys. Rev. B 22, 5284–5301 (1980).
- Stefanovich et al. (2000) G Stefanovich, A Pergament, and D Stefanovich, “Electrical switching and mott transition in vo 2,” Journal of Physics: Condensed Matter 12, 8837 (2000).
- Qazilbash et al. (2007) M. M. Qazilbash, M. Brehm, B. G. Chae, P. C. Ho, G. O. Andreev, B. J. Kim, S. J. Yun, A. V. Balatsky, M. B. Maple, F. Keilmann, H. T. Kim, and D. N. Basov, “Mott transition in VO2 revealed by infrared spectroscopy and nano-imaging,” Science 318, 1750 (2007).
- Wang et al. (2014) Lei Wang, Irina Novikova, John M. Klopf, Scott Madaras, Gwyn P. Williams, Eric Madaras, Jiwei Lu, Stuart A. Wolf, and Rosa A. Lukaszew, “Distinct length scales in the vo2 metal–insulator transition revealed by bi-chromatic optical probing,” Advanced Optical Materials 2, 30–33 (2014).
- Becker et al. (1994) Michael F. Becker, A. Bruce Buckman, Rodger M. Walser, Thierry Lépine, Patrick Georges, and Alain Brun, “Femtosecond laser excitation of the semiconductor metal phase transition in vo2,” Applied Physics Letters 65, 1507–1509 (1994).
- Kübler et al. (2007) C. Kübler, H. Ehrke, R. Huber, R. Lopez, A. Halabica, R. Haglund, and A. Leitenstorfer, “Coherent Structural Dynamics and Electronic Correlations during an Ultrafast Insulator-to-Metal Phase Transition in VO2,” Physical Review Letters 99, 116401 (2007).
- Hilton et al. (2007) D. J. Hilton, R. P. Prasankumar, S. Fourmaux, A. Cavalleri, D. Brassard, M. A. El Khakani, J. C. Kieffer, A. J. Taylor, and R. D. Averitt, “Enhanced photosusceptibility near for the light-induced insulator-to-metal phase transition in vanadium dioxide,” Phys. Rev. Lett. 99, 226401 (2007).
- Rini et al. (2008) M. Rini, Z. Hao, R. W. Schoenlein, C. Giannetti, F. Parmigiani, S. Fourmaux, J. C. Kieffer, A. Fujimori, M. Onoda, S. Wall, and A. Cavalleri, “Optical switching in vo2 films by below-gap excitation,” Applied Physics Letters 92 (2008).
- Pashkin et al. (2011) A. Pashkin, C. Kübler, H. Ehrke, R. Lopez, A. Halabica, R. F. Haglund, R. Huber, and A. Leitenstorfer, “Ultrafast insulator-metal phase transition in VO_{2} studied by multiterahertz spectroscopy,” Physical Review B 83, 195120 (2011).
- Abreu et al. (2012) Elsa Abreu, Mengkun Liu, Jiwei Lu, Kevin G West, Salinporn Kittiwatanakul, Wenjing Yin, Stuart A Wolf, and Richard D Averitt, “Thz spectroscopy of vo 2 epitaxial films: controlling the anisotropic properties through strain engineering,” New Journal of Physics 14, 083026 (2012).
- Cocker et al. (2012) T. L. Cocker, L. V. Titova, S. Fourmaux, G. Holloway, H.-C. Bandulet, D. Brassard, J.-C. Kieffer, M. A. El Khakani, and F. A. Hegmann, “Phase diagram of the ultrafast photoinduced insulator-metal transition in vanadium dioxide,” Physical Review B 85, 155120 (2012).
- Wall et al. (2013) S. Wall, L. Foglia, D. Wegkamp, K. Appavoo, J. Nag, R. F. Haglund, J. Stähler, and M. Wolf, “Tracking the evolution of electronic and structural properties of vo2 during the ultrafast photoinduced insulator-metal transition,” Phys. Rev. B 87, 115126 (2013).
- Radue et al. (2015) E Radue, L Wang, S Kittiwatanakul, J Lu, S A Wolf, E Rossi, R A Lukaszew, and I Novikova, “Substrate-induced microstructure effects on the dynamics of the photo-induced metal–insulator transition in vo 2 thin films,” Journal of Optics 17, 025503 (2015).
- Lysenko et al. (2007) S. Lysenko, A. Rúa, V. Vikhnin, F. Fernández, and H. Liu, “Insulator-to-metal phase transition and recovery processes in thin films after femtosecond laser excitation,” Phys. Rev. B 76, 035104 (2007).
- Brassard et al. (2005) D. Brassard, S. Fourmaux, M. Jean-Jacques, J. C. Kieffer, and M. A. El Khakani, “Grain size effect on the semiconductor-metal phase transition characteristics of magnetron-sputtered vo2 thin films,” Applied Physics Letters 87, 051910 (2005).
- Aliev et al. (2006) R.A. Aliev, V.N. Andreev, V.M. Kapralova, V.A. Klimov, A.I. Sobolev, and E.B. Shadrin, “Effect of grain sizes on the metal-semiconductor phase transition in vanadium dioxide polycrystalline thin films,” Physics of the Solid State 48, 929–934 (2006).
- West et al. (2008) Kevin G. West, Jiwei Lu, Jiani Yu, David Kirkwood, Wei Chen, Yonghang Pei, John Claassen, and Stuart a. Wolf, “Growth and characterization of vanadium dioxide thin films prepared by reactive-biased target ion beam deposition,” Journal of Vacuum Science & Technology A: Vacuum, Surfaces, and Films 26, 133 (2008).
- Wang et al. (2012) L Wang, E Radue, S Kittiwatanakul, C Clavero, J Lu, S a Wolf, I Novikova, and R a Lukaszew, “Surface plasmon polaritons in VO2 thin films for tunable low-loss plasmonic applications.” Optics letters 37, 4335–7 (2012).
- Radue et al. (2013) E. Radue, E. Crisman, L. Wang, S. Kittiwatanakul, J. Lu, S. A. Wolf, R. Wincheski, R. A. Lukaszew, and I. Novikova, “Effect of a substrate-induced microstructure on the optical properties of the insulator-metal transition temperature in vo2 thin films,” Journal of Applied Physics” 113, 233104 (2013).
- Bruggeman (1935) D. A. G. Bruggeman, “Berechnung verschiedener physikalischer konstanten von heterogenen substanzen. i. dielektrizitätskonstanten und leitfähigkeiten der mischkörper aus isotropen substanzen [engl. trans.: Computation of different physical constants of heterogeneous substances. i. dielectric constants and conductivities of mixtures of isotropic substances.” Ann. Physik 416, 636 (1935).
- Landauer (1952) R. Landauer, “The electrical resistance of binary metallic mixtures,” J. Appl. Phys. 23, 779 (1952).
- Zeng et al. (1988) X. C. Zeng, D. J. Bergman, P. M. Hui, and D. Stroud, Phys. Rev. B 38, 10970–10973 (1988).
- Rossi et al. (2009) E. Rossi, S. Adam, and S. Das Sarma, “Effective medium theory for disordered two-dimensional graphene,” Phys. Rev. B 79, 245423 (2009).
- Verleur et al. (1968) Hans W. Verleur, A. S. Barker Jr, and C. N. Berglund, “Optical Properties of VO 2 between 0.25 and 5 eV,” Physical Review 172, 788–798 (1968).
- Kana Kana et al. (2011) J.B. Kana Kana, J.M. Ndjaka, G. Vignaud, a. Gibaud, and M. Maaza, “Thermally tunable optical constants of vanadium dioxide thin films measured by spectroscopic ellipsometry,” Optics Communications 284, 807–812 (2011).
- Granqvist and Buhrman (1976) C. G. Granqvist and R. A. Buhrman, Journal of Applied Physics 47, 2200–2219 (1976).
- Fisher and Berker (1982) Michael E. Fisher and A. Nihat Berker, “Scaling for first-order phase transitions in thermodynamic and finite systems,” Phys. Rev. B 26, 2507–2513 (1982).
- Challa et al. (1986) Murty S. S. Challa, D. P. Landau, and K. Binder, “Finite-size effects at temperature-driven first-order transitions,” Phys. Rev. B 34, 1841–1852 (1986).
- Zhang et al. (2000) M. Zhang, M. Yu. Efremov, F. Schiettekatte, E. A. Olson, A. T. Kwan, S. L. Lai, T. Wisleder, J. E. Greene, and L. H. Allen, “Size-dependent melting point depression of nanostructures: Nanocalorimetric measurements,” Phys. Rev. B 62, 10548–10557 (2000).
- Jiang et al. (2002) Q Jiang, J.C Li, and B.Q Chi, Chemical Physics Letters 366, 551 (2002).
- Kapitza (1941) P. L. Kapitza, “The Study of Heat Transfer in Helium II,” J. Phys. USSR 4, 181 (1941).
- Pollack (1969) Gerald L. Pollack, “Kapitza Resistance,” Reviews of Modern Physics 41, 48–81 (1969).
- Stoner and Maris (1993) Rj Stoner and Hj Maris, “Kapitza conductance and heat flow between solids at temperatures from 50 to 300 K.” Physical review. B, Condensed matter 48, 16373–16387 (1993).
- Wen et al. (2013) Haidan Wen, Lu Guo, Eftihia Barnes, June Hyuk Lee, Donald A. Walko, Richard D. Schaller, Jarrett A. Moyer, Rajiv Misra, Yuelin Li, Eric M. Dufresne, Darrell G. Schlom, Venkatraman Gopalan, and John W. Freeland, “Structural and electronic recovery pathways of a photoexcited ultrathin vo2 film,” Phys. Rev. B 88, 165424 (2013).
- Berglund and Guggenheim (1969) C. N. Berglund and H. J. Guggenheim, “Electronic properties of v near the semiconductor-metal transition,” Phys. Rev. 185, 1022–1033 (1969).
- Oh et al. (2010) Dong-Wook Oh, Changhyun Ko, Shriram Ramanathan, and David G. Cahill, “Thermal conductivity and dynamic heat capacity across the metal-insulator transition in thin film vo2,” Applied Physics Letters 96, 151906 (2010).
- de Ligny et al. (2002) D. de Ligny, P. Richet, E. F. Westrum Jr, and J. Roux, “Heat capacity and entropy of rutile (TiO 2 ) and nepheline (NaAlSiO 4 ),” Physics and Chemistry of Minerals 29, 267–272 (2002).
- Thurber and Mante (1965) W. R. Thurber and A. J. H. Mante, “Thermal conductivity and thermoelectric power of rutile (ti),” Phys. Rev. 139, A1655–A1665 (1965).
- Pishchik et al. (2009) Valerian Pishchik, Leonid a. Lytvynov, and Elena R. Dobrovinskaya, Sapphire: Material, Manufacturing, Applications, 1st ed. (Springer US, 2009).