A Ring of C2H in the Molecular Disk Orbiting TW Hya
Abstract
We have used the Submillimeter Array to image, at 1.5′′ resolution, C2H emission from the circumstellar disk orbiting the nearby ( pc), 8 Myr-old, 0.8 classical T Tauri star TW Hya. The SMA imaging reveals that the C2H emission exhibits a ring-like morphology. Based on a model in which the C2H column density follows a truncated radial power-law distribution, we find that the inner edge of the ring lies at 45 AU, and that the ring extends to at least 120 AU. Comparison with previous (single-dish) observations of C2H emission indicates that the C2H molecules are subthermally excited and, hence, that the emission arises from the relatively warm ( K), tenuous ( cm-3) upper atmosphere of the disk. Based on these results and comparisons of the SMA C2H map with previous submm and scattered-light imaging, we propose that the C2H emission most likely traces particularly efficient photo-destruction of small grains and/or photodesorption and photodissociation of hydrocarbons derived from grain ice mantles in the surface layers of the outer disk. The presence of a C2H ring in the TW Hya disk hence likely serves as a marker of dust grain processing and radial and vertical grain size segregation within the disk.
1 Introduction
Models of protoplanetary disks orbiting low-mass, pre-main sequence (T Tauri) stars predict that gas-grain processes and high-energy stellar irradiation are important ingredients in determining disk chemical composition and dust grain evolution (Walsh et al., 2014; Dutrey et al., 2014, and refs. therein). These evolutionary processes, in turn, have profound implications for planet-building scenarios, since disk dust and gas characteristics — such as characteristic dust grain sizes, the presence or absence of grain ice mantles, and gas-phase molecular abundances — should regulate the rate of planetesimal buildup and the compositions of bodies ranging from comets to giant planet envelopes (e.g., Dutrey et al., 2014, and refs. therein).
Interferometric imaging of molecule-rich disks orbiting nearby T Tauri star/disk systems — whose archetype is TW Hya ( pc, age 8 Myr; Torres et al., 2008; Ducourant et al., 2014) — provides key insight into these and other planet formation processes (e.g., Qi et al., 2004, 2008; Hughes et al., 2011; Rosenfeld et al., 2012; Andrews et al., 2012). Recently, for example, imaging with the Atacama Large Millimeter Array (ALMA) established that N2H+ emission from the TW Hya disk displays a central hole of radius 30 AU (Qi et al., 2013b). On the basis of simple gas-phase chemistry, Qi et al. (2013b) interpreted the 30 AU outer edge of the N2H+ depletion region as tracing the CO “snow line,” i.e., the innermost radius at which CO freezes out onto dust grains.
In an unbiased molecular line survey of TW Hya spanning the wavelength range 0.85-1.1 mm, carried out with the Atacama Pathfinder Experiment (APEX) 12 m telescope, we detected strong C2H emission (Kastner et al., 2014). From analysis of the hyperfine splitting of this transition, we determined that the emission is optically thick and either arises from very cold disk layers or is subthermally excited. We furthermore determined a very large beam-averaged C2H column density of cm-2, suggesting that, in specific regions of the outer disk, the abundance of C2H in the gas phase may rival or perhaps exceed that of CO. As C2H is potentially a product of the photodissociation of more complex hydrocarbons and dissociative recombinations of molecular ions with electrons, its radio emission may trace the influence of stellar irradiation on molecular, protoplanetary disks (Henning et al., 2010; Walsh et al., 2010). To ascertain the surface brightness distribution of C2H in the TW Hya disk, which is viewed nearly pole-on (, assuming a central star mass of 0.8; Qi et al., 2004; Andrews et al., 2012), we have carried out imaging of C2H emission of TW Hya with the Submillimeter Array (SMA).
2 Observations and Data Reduction
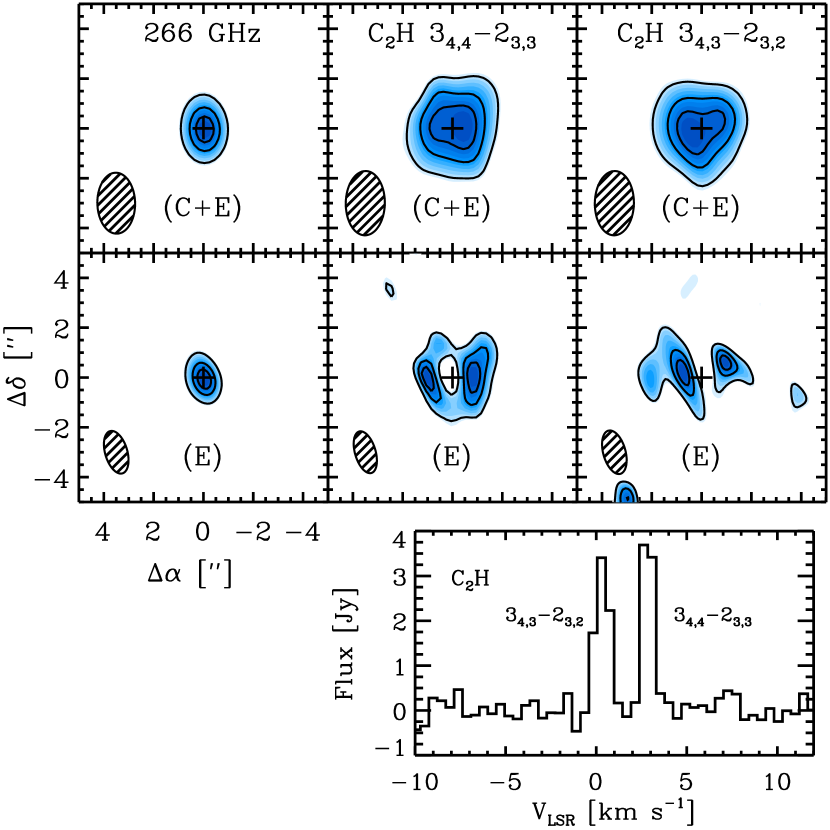
Observations of 262 GHz C2H emission and adjacent continuum centered at the position of TW Hya were obtained on 2013 April 5 and 2014 April 8 in the SMA’s compact (C) and extended (E) array configurations, respectively, with projected baselines ranging from 6.3 m to 164.8 m. The correlator setup included the four brightest hyperfine structure transitions of the C2H rotational transition (which lie in the 262.004–262.067 GHz region; Table 1). The and transitions were observed in lower sideband correlator 104 MHz chunk S01, and were blended due to the coarse spectral resolution of 1.86 km s-1, while the and transitions were observed in lower sideband correlator 104 MHz chunk S02 with spectral resolutions of 0.46 km s-1 (C) and 0.23 km s-1 (E), which resolves the two lines (Fig. 1, bottom panel). The observing loops used J1037–295 as the gain calibrator, and the bandpass response was calibrated using observations of 3C279. Flux calibration was performed using observations of Titan and Callisto. The derived fluxes of J1037–295 were 0.79 Jy on 2013 April 5 and 0.70 Jy on 2014 April 8. All data were phase- and amplitude-calibrated with the MIR software package 111http://www.cfa.harvard.edu/cqi/mircook.html. Continuum and spectral line maps were then generated and CLEANed using the MIRIAD software package.
3 Results and Analysis
In Fig. 1, we display continuum (266 GHz) and C2H emission line maps for the spectral region encompassing the and transitions of C2H. From the merged (C+E) data, we measure a 266 GHz continuum flux of 7373 mJy (averaged over both upper and lower sidebands) and integrated intensities of 3.74 and 3.25 Jy km s-1 (0.06 Jy km s-1), respectively, for the and transitions (with absolute calibration uncertainties of 10%). These total flux measurements likely account for all of the 266 GHz continuum flux and C2H line emission from the TW Hya disk, given the angular scales probed by the shortest (6 m) SMA baselines at this frequency (e.g., Wilner & Welch, 1994). The C2H emission is evidently well resolved in the merged C+E configuration data (top row of Fig. 1). The E configuration map (lower middle panel of Fig. 1) reveals that the C2H () emission has a ring-like morphology, with brightened limbs (ansae) in the E-W direction. In the C2H () E configuration emission-line map (lower right panel), only the ansae are apparent.
The inner radius of the ring of C2H () emission in the TW Hya disk, as imaged by the SMA, appears to be larger than that of the ring of N2H+ (4–3) emission as imaged by ALMA (Qi et al., 2013b). This comparison — which we further explore below (§3.2, 4.1) — suggests that despite their morphologically similar surface brightness distributions, C2H and N2H+ may trace different physical and/or chemical processes in the disk. The continuum emission is only marginally resolved in these maps, consistent with previous mm-wave interferometric imaging observations that established that the continuum emission from the TW Hya disk is quite compact relative to the disk molecular line emission (continuum and CO outer radii of 60 AU and 200 AU, respectively; e.g., Andrews et al., 2012).
3.1 Excitation of C2H
Our analysis of the C2H hyperfine emission complex had previously indicated that the C2H emission either arises from very cold (midplane) disk layers, or that the C2H molecules are subthermally excited (Kastner et al., 2014). The latter interpretation would suggest that the relative abundance of C2H peaks high in the disk and, hence, is more consistent with the chemical simulations of protoplanetary disks presented by Walsh et al. (2010), in which the relative C2H abundance peaks at relative heights .
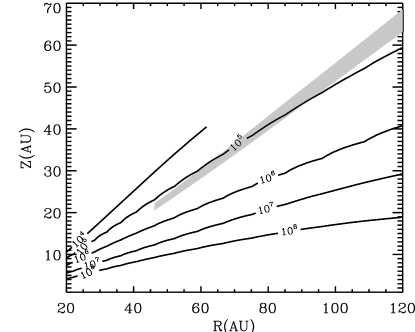
To investigate whether and how the ratio of C2H to line intensities as measured with APEX (2.7 Jy km s-1 for the 349.3375 GHz transition; Kastner et al., 2014) and SMA (3.74 Jy km s-1 for the 262.0042 GHz transition; §3), respectively, constrains the physical conditions (hence height) of the layers of the disk from which the C2H emission originates, we constructed a grid of models with the web-based RADEX tool222http://www.sron.rug.nl/ṽdtak/radex/index.shtml (van der Tak et al., 2007). RADEX calculates the emergent line flux under the local velocity gradient approximation, employing the same molecular data as used for the morphological analysis in §3.2. The resulting model C2H (4–3)/(3–2) line ratios were then compared with the observed ratio, i.e., (4–3)/(3–2) 0.72. The results, which are illustrated in Fig. 2, indicate that the observed (4–3)/(3–2) line ratio can be reproduced in two specific regimes of physical conditions: (1) –25 K and , or (2) K and –6. The latter conditions correspond to subthermal excitation of C2H; specifically, the critical densities for excitation of the 3–2 and 4–3 transitions of C2H for a gas kinetic temperature K are 0.6 cm-3 and 2 cm-3 respectively (and the values of increase for smaller assumed values of ).
In our tests of models that can reproduce the ring-like morphology of the C2H emission (§3.2), we find that models in which the C2H is assumed to lie at relatively deep, dense layers of the disk consistently overpredict the observed (4–3)/(3–2) line ratio by a factor 2 or more, whereas models in which the C2H lies high in the disk surface layers can reproduce the observed (4–3)/(3–2) line ratio to within 30%. Furthermore, the very low excitation temperature inferred from the C2H modeling ( K; Kastner et al., 2014) is inconsistent with the observed (4–3)/(3–2) line ratio, under conditions of thermal excitation (Fig. 2). Hence, it appears that the C2H is confined to low- (surface) disk layers, where it is subthermally excited.
3.2 Modeling the C2H emission morphology
To constrain the dimensions of the C2H ring in the TW Hya disk, we modeled the SMA C2H data via the same methodology used to analyze the ALMA N2H+ (4–3) data (Qi et al., 2013b). This methodology utilizes a model for the TW Hya disk (described in detail in Qi et al., 2004, 2006, 2013b) in which the non-local thermodynamic equilibrium, accelerated 2D Monte Carlo radiative transfer code RATRAN (Hogerheijde & van der Tak, 2000) serves to calculate the molecular excitation. The data for the excitation calculations were drawn from Schöier et al. (2005), supplemented with H2 collisional rate coefficients from Spielfiedel et al. (2012) and electron impact rates appropriate for C2H from A. Faure (2014, private comm.). As in the Qi et al. (2013b) treatment of N2H+, the C2H emission is assumed to be produced within a vertical disk layer, of constant molecular abundance, whose boundaries are expressed in terms of vertically integrated hydrogen column densities as measured from the disk surface. The emitting molecular layer is confined to a ring with inner and outer edges and , respectively, with a column density that follows a power-law distribution, i.e., .
As noted earlier (§3.1), comparison of the SMA and APEX measurements indicates that the C2H molecules are subthermally excited and, hence, reside in tenuous disk surface layers. In applying the foregoing ring-like molecular density distribution to model the TW Hya C2H emission, we therefore focused on simulations in which the C2H is confined to a thin surface layer. The specific models described here, which are representative of this family of simulations, have upper and lower vertical C2H boundaries at H2 column densities of cm-2 and cm-2, respectively.
With this vertical distribution fixed, we performed fits to the combined (C+E) visibilities for the resolved C2H hyperfine lines, with the ring inner and outer ring edges , and the density power-law index left as free parameters. We find that the best-fit model, obtained by minimizing for the weighted residuals in the visibilities, has AU, AU, and . Based on a comparison of models with the foregoing values of and fixed but allowed to vary, we find that only models with in the range 40–50 AU well reproduce the observations (Fig. 3). The outer radius is considerably less well constrained, due to degeneracy with the value of during the model fitting (this degeneracy between and is a well-known aspect of power-law disk models; e.g., Mundy et al., 1996). We note that these results for the radial distribution of C2H within the disk (i.e., the best-fit values for , , and ) are not sensitive to the assumed vertical placement of the layer from which the C2H emission arises.
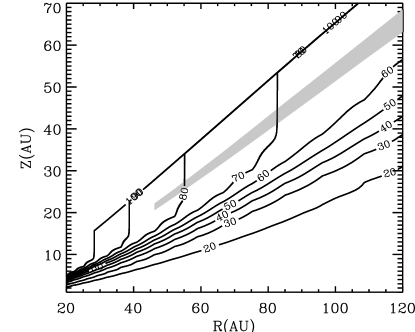
The distribution of C2H in the best-fit surface layer model is shown schematically in Fig. 4. This distribution is qualitatively similar to that obtained in the simulations by Walsh et al. (2010), but lies at lower (in our model, the C2H emitting layer corresponds to a disk density cm-3). The column density and approximate relative abundance of C2H (with respect to H2) are cm-2 and , respectively, near the inner emission boundary at AU and AU. The best-fit value of is similar to, though somewhat smaller than, that estimated from measurements of C2H 4–3 with APEX (Kastner et al., 2014). The value cm-2 likely represents a lower limit on the C2H column density at AU, given that the C2H emitting layer could lie somewhat deeper in the disk without violating the constraints imposed by considerations of excitation (§3.1). The inferred value of suggests that the relative abundance of C2H may rival that of CO in the gas phase, in this region of the disk (see, e.g., Qi et al., 2013b). The result for is highly uncertain, however, given that the model values of and are poorly constrained in the tenuous disk layers at high , and that the precise C2H emitting layer height and thickness is somewhat arbitrary.
4 Discussion
4.1 Radial distribution of C2H
The modeling described in §3.1 (and illustrated in Fig 4) indicates that the inner edge of the C2H ring imaged by the SMA, AU, lies roughly midway between the inner edge of N2H+ emission as imaged by ALMA (30 AU; Qi et al., 2013b) and the outer radius of submm continuum emission (60 AU, as mapped at 870 m and 806 m with the SMA and ALMA, respectively; Andrews et al., 2012; Qi et al., 2013b). The N2H+ emission inner cutoff likely traces the radius at which CO freezes out onto grain surfaces (Qi et al., 2013b), whereas the submm continuum outer cutoff marks the radius at which the large (radius 1 mm) dust grain population drops precipitously. These two markers (at 30 AU and 60 AU) are well defined in the respective interferometric data, and neither disk radius is consistent with the C2H inner hole dimensions (Fig. 3). The location of the C2H emission inner cutoff with respect to the CO snow line — and the persistence of C2H emission at disk radii well beyond the drop in large-grain surface density — suggests that the C2H abundance is enhanced in radial zones where small, ice-coated grains are plentiful. Indeed, at radii AU, such small grains likely dominate the disk’s dust grain mass, based on the comparison between the aforementioned submm imaging and the extended (200 AU radius) scattered-light “halo” seen in optical and near-infrared coronagraphic imaging with the Hubble Space Telescope (e.g., Debes et al., 2013, see §4.2.3).
4.2 C2H production mechanisms
In the following, we consider three potential processes that might enhance the abundance of C2H in the surface layers of the TW Hya disk beyond 45 AU: (i) pure gas-phase production of C2H, involving significant destruction of CO; (ii) X-ray photodesorption of organic ices on grains; and (iii) photodestruction of very small, C-rich grains and PAHs by UV and X-rays. As we describe below, mechanisms (ii) and (iii) may be acting in concert to produce the large inferred values of .
4.2.1 Gas-phase production
A large number of pure gas-phase processes could be responsible for production of C2H (see, e.g., Fig. 7 in Henning et al., 2010). Many of these channels are initiated via destruction of CO and the consequent generation of ionized C (e.g., Aresu et al., 2011; Cleeves et al., 2013). Near the disk surface — above the layer where CO is photodissociated by stellar UV and X-ray photons — C ions and atoms can react with H2 and CH, respectively, to form C2H, followed by recombination and dissociation to C2H. This stellar-photon-driven process should produce a uniform (as opposed to ring-like) C2H column density distribution over the disk surface, however, unless the C2H-free region within 45 AU is shadowed from high-energy stellar irradiation by material in the inner disk (e.g., in a puffed-up inner rim at 4 AU; Andrews et al., 2012) .
In regions of the disk shielded from UV and X-rays, CR ionization of He results in the generation of free C. If the C2H ring were generated via such a (CR-initiated) process, then it should be confined to the disk midplane, where high-energy CRs dominate the ionization rates (Cleeves et al., 2013). Indeed, our preliminary tests of pure gas-phase chemical models (utilizing a physical structure for the TW Hya disk described in detail in Gorti et al., 2011) do yield a ring-like distribution of enhanced C2H, with inner radius 50 AU, deep within the disk. However, this placement of the emitting C2H (near the disk midplane) appears to be inconsistent with considerations of molecular excitation (§3.1). Furthermore, we find that these pure gas-phase models underpredict the C2H column densities by at least an order of magnitude (similar modeling results were obtained by Henning et al., 2010). It therefore appears that pure gas-phase processes fail to explain the presence of the observed bright C2H ring in the TW Hya disk.
4.2.2 X-ray photodesorption of organic ices
In disk environments such as TW Hya’s, where primitive organics (e.g., CN, HCN and C2H2) are relatively abundant (Kastner et al., 2014), it is likely that more complex organic molecules form and freeze out onto dust grains. Desorption of such ice-coated grains by stellar high-energy radiation — especially X-rays — can then be a rich source of dissociation products of the parent organics (Mendoza et al., 2013). It is not clear, however, whether an X-ray-dominated mechanism could produce C2H high in the atmosphere of the outer disk, given that the stellar X-rays should penetrate relatively deeply within the disk (Cleeves et al., 2013). It is also possible that increasing gas/dust ratios in these more remote disk regions can facilitate the dredging of small, ice-coated grains to the disk surface, where they are efficiently irradiated by ice-destroying UV. However, this UV-driven photodesorption process should result in efficient C2H production at radii 45 AU, i.e., at least to the CO “snow line” at 30 AU (see also Walsh et al., 2010). Hence — as in the case of pure gas-phase processes that are driven by stellar irradiation (§4.2.1) — “shadowing” of the disk outer regions (by inner disk material) might be required to explain the fact that the C2H generated by ice photodesorption is evidently restricted to somewhat larger disk radii (45 AU).
4.2.3 Photodestruction of small grains and PAHs
Dust grain fragmentation/coagulation equilibrium models (e.g., Birnstiel et al., 2011; Gorti et al., 2015) predict both a faster rate of grain growth in the inner disk, where gas densities are high, and more efficient collisional shattering of grains at large disk radii, where the gas surface densities are lower. The combination of the relatively sharp cutoff of submm emission in the TW Hya disk at 60 AU (Andrews et al., 2012) and the much larger extent of the disk in scattered near-infrared light (Debes et al., 2013) is consistent with such modeling. This contrast likely reflects a transition within the disk from efficient dust grain coagulation and settling to more efficient grain fragmentation and levitation.
The outer disk environment hence may harbor an enhanced abundance of very small grains and polycyclic aromatic hydrocarbons (PAHs), particularly in the disk’s upper layers (see, e.g., Fig. 7 in Gorti et al., 2015). Once exposed to stellar UV and X-rays, these small grains and PAHs would undergo photodegradation to form loose C2H2 groups (Allain et al., 1996), which would then photodissociate to produce the observed C2H. Preliminary calculations, based on a simple scheme whereby UV irradiation breaks PAHs into C2H2 units, suggest that to explain the C2H column density inferred here (i.e., cm-2), the relative abundance of PAHs per H nucleus in the upper layers of the disk would need to be perhaps an order of magnitude larger than the canonical relative PAH abundance in the interstellar medium (; Tielens, 2008). As noted, such an enhanced PAH abundance could be a byproduct of the steeply falling gas surface density in the outer disk, which should yield disk conditions favorable for the production of small grains. Furthermore, inclusion of X-rays in the PAH photodestruction model would lower the required PAH abundance. Hence, in light of the modeling results presented in (§3.1, 3.2), we consider photodestruction of small grains and PAHs in disk surface layers to be a plausible source of the observed C2H. The C2H production rates from irradiated small grains would be further enhanced if organic ices coat these grains (§4.2.2).
4.3 Origin of the C2H ring
We propose the following schematic model to explain the C2H spatial distribution, and its apparently subthermal excitation, within the TW Hya disk. Large surface densities are required to form submm-sized grains, which also drift radially as the disk evolves; such grain growth and migration manifests itself as a sharp edge in the submm dust grain distribution (Andrews et al., 2012). A corresponding increase in small grain surface density in the disk upper layers moving radially outward, evidently beginning at radii as small as 45 AU, then provides “fertile ground” for UV and soft X-rays generated at TW Hya (via chromospheric activity and accretion shocks; e.g., Kastner et al., 2002) to efficiently destroy small grains, PAHs, and/or grain mantles composed of organic ices. These photodestruction and photodesorption processes generate hydrocarbons (predominantly C2H2) and, via subsequent photodissociations, C2H. Although pure gas-phase reactions (catalyzed by high-energy stellar irraditation) could also be responsible for C2H production, it is unclear whether such processes could produce the observed ring-like C2H morphology at the large abundances and low densities inferred from the data.
Additional observations and modeling of C2H emission from other, nearby protoplanetary disks are necessary to test and expand on the mechanisms proposed here to explain the spatial distribution and production of C2H in the TW Hya disk. Indeed, few radio measurements of C2H toward disks, either interferometric or single-dish, have been published thus far, and the scant interferometric data that do exist (e.g., Henning et al., 2010) are not of sufficient quality to determine disk C2H emission morphologies. The results of our recent single-dish line surveys of V4046 Sgr (Kastner et al., 2014) and LkCa 15 (Punzi et al., 2015) indicate that these two disks are particularly deserving of followup interferometric imaging in C2H. In each case, the inferred C2H abundance and excitation is similar to that of TW Hya, indicating that both disks may also display ring-like C2H surface brightness distributions.
We further note that in PAH-rich, UV-irradiated environments such as the Orion Bar, C2H is merely the most abundant of a series of gas-phase hydrocarbons that are potentially detectable in the submm, including C4H, c-C3H2, and c-C3H, among others (e.g., Cuadrado et al., 2015). Of these, only c-C3H2 has thus far been detected in a circumstellar molecular disk (HD 163296; Qi et al., 2013a). Sensitive searches for this molecule and other simple hydrocarbons are warranted for TW Hya and the other two disks just mentioned, to further test the various C2 production scenarios proposed in §4.2.
5 Conclusions
The SMA imaging reported here reveals that C2H(3–2) emission from the TW Hya disk exhibits a ring-like morphology with inner and outer radii of 1′′ and 3′′, respectively. Radiative transfer modeling indicates that the inner edge of the C2H ring lies at 45 AU and that the ring extends to at least 120 AU; we estimate a lower limit on the C2H column density of cm-2 near the inner edge of the ring. The inferred inner cutoff of the C2H emission lies roughly midway between the CO “snow line” at 30 AU (as inferred from N2H+ emission line imaging) and the sharp decline in submm-sized dust grains at 60 AU (as inferred from submm continuum emission). Comparison with single-dish observations of C2H(4–3) suggests that the C2H emission emanates from tenuous upper layers of the disk (characterized by disk heights and gas densities cm-3), where the molecules are subthermally excited. While we cannot rule out the possibility that the C2H arises in colder ( K), higher-density regions of the disk, it is more difficult for such a model to explain the ensemble of observations obtained to date.
We propose that the C2H emission most likely traces particularly efficient photo-destruction of small grains and/or photodesorption and photodissociation of hydrocarbons in the surface layers of the outer disk. The presence of a C2H ring in the TW Hya disk therefore may be a byproduct of dust grain processing and migration, which is in turn associated with recent or ongoing giant planet building interior to the ring. Given such a scenario, it remains to explain why the inner cutoff in C2H at 45 AU evidently lies interior to the outer cutoff in the large grain surface density. These results hence stress the need for higher-resolution (i.e., ALMA) imaging to confirm and extend the results presented here for TW Hya, and to establish the radial and vertical distributions of C2H within additional examples of nearby, evolved protoplanetary disks orbiting actively accreting T Tauri stars (e.g., V4046 Sgr, MP Mus, T Cha, LkCa 15; Sacco et al., 2014; Punzi et al., 2015).
References
- Allain et al. (1996) Allain, T., Leach, S., & Sedlmayr, E. 1996, A&A, 305, 602
- Andrews et al. (2012) Andrews, S. M., et al. 2012, ApJ, 744, 162
- Aresu et al. (2011) Aresu, G., Kamp, I., Meijerink, R., Woitke, P., Thi, W.-F., & Spaans, M. 2011, A&A, 526, A163
- Birnstiel et al. (2011) Birnstiel, T., Ormel, C. W., & Dullemond, C. P. 2011, A&A, 525, A11
- Cleeves et al. (2013) Cleeves, L. I., Adams, F. C., & Bergin, E. A. 2013, ApJ, 772, 5
- Cuadrado et al. (2015) Cuadrado, S., Goicoechea, J. R., Pilleri, P., Cernicharo, J., Fuente, A., & Joblin, C. 2015, A&A, 575, A82
- Debes et al. (2013) Debes, J. H., Jang-Condell, H., Weinberger, A. J., Roberge, A., & Schneider, G. 2013, ApJ, 771, 45
- Ducourant et al. (2014) Ducourant, C., Teixeira, R., Galli, P. A. B., Le Campion, J. F., Krone-Martins, A., Zuckerman, B., Chauvin, G., & Song, I. 2014, A&A, 563, A121
- Dutrey et al. (2014) Dutrey, A., et al. 2014, Protostars and Planets VI, 317
- Gorti et al. (2015) Gorti, U., Hollenbach, D., & Dullemond, C. 2015, ArXiv e-prints
- Gorti et al. (2011) Gorti, U., Hollenbach, D., Najita, J., & Pascucci, I. 2011, ApJ, 735, 90
- Henning et al. (2010) Henning, T., et al. 2010, ApJ, 714, 1511
- Hogerheijde & van der Tak (2000) Hogerheijde, M. R., & van der Tak, F. F. S. 2000, A&A, 362, 697
- Hughes et al. (2011) Hughes, A. M., Wilner, D. J., Andrews, S. M., Qi, C., & Hogerheijde, M. R. 2011, ApJ, 727, 85
- Kastner et al. (2014) Kastner, J. H., Hily-Blant, P., Rodriguez, D. R., Punzi, K., & Forveille, T. 2014, ApJ, 793, 55
- Kastner et al. (2002) Kastner, J. H., Huenemoerder, D. P., Schulz, N. S., Canizares, C. R., & Weintraub, D. A. 2002, ApJ, 567, 434
- Mendoza et al. (2013) Mendoza, E., Almeida, G. C., Andrade, D. P. P., Luna, H., Wolff, W., Rocco, M. L. M., & Boechat-Roberty, H. M. 2013, MNRAS, 433, 3440
- Mundy et al. (1996) Mundy, L. G., et al. 1996, ApJ, 464, L169
- Punzi et al. (2015) Punzi, K., Hily-Blant, P., Kastner, J. H., Forveille, T., & Sacco, G. G. 2015, ApJ, submitted
- Qi et al. (2013a) Qi, C., Öberg, K. I., Wilner, D. J., & Rosenfeld, K. A. 2013a, ApJ, 765, L14
- Qi et al. (2008) Qi, C., Wilner, D. J., Aikawa, Y., Blake, G. A., & Hogerheijde, M. R. 2008, ApJ, 681, 1396
- Qi et al. (2006) Qi, C., Wilner, D. J., Calvet, N., Bourke, T. L., Blake, G. A., Hogerheijde, M. R., Ho, P. T. P., & Bergin, E. 2006, ApJ, 636, L157
- Qi et al. (2004) Qi, C., et al. 2004, ApJ, 616, L11
- Qi et al. (2013b) —. 2013b, Science, 341, 630
- Rosenfeld et al. (2012) Rosenfeld, K. A., et al. 2012, ApJ, 757, 129
- Sacco et al. (2014) Sacco, G. G., Kastner, J. H., Forveille, T., Principe, D., Montez, R., Zuckerman, B., & Hily-Blant, P. 2014, A&A, 561, A42
- Schöier et al. (2005) Schöier, F. L., van der Tak, F. F. S., van Dishoeck, E. F., & Black, J. H. 2005, A&A, 432, 369
- Spielfiedel et al. (2012) Spielfiedel, A., Feautrier, N., Najar, F., Ben Abdallah, D., Dayou, F., Senent, M. L., & Lique, F. 2012, MNRAS, 421, 1891
- Tielens (2008) Tielens, A. G. G. M. 2008, ARA&A, 46, 289
- Torres et al. (2008) Torres, C. A. O., Quast, G. R., Melo, C. H. F., & Sterzik, M. F. 2008, Young Nearby Loose Associations, ed. Reipurth, B., 757–+
- van der Tak et al. (2007) van der Tak, F. F. S., Black, J. H., Schöier, F. L., Jansen, D. J., & van Dishoeck, E. F. 2007, A&A, 468, 627
- Walsh et al. (2010) Walsh, C., Millar, T. J., & Nomura, H. 2010, ApJ, 722, 1607
- Walsh et al. (2014) Walsh, C., Millar, T. J., Nomura, H., Herbst, E., Widicus Weaver, S., Aikawa, Y., Laas, J. C., & Vasyunin, A. I. 2014, A&A, 563, A33
- Wilner & Welch (1994) Wilner, D. J., & Welch, W. J. 1994, ApJ, 427, 898
| C2H transition | Frequency | Resolution |
|---|---|---|
| (GHz) | (km s-1) | |
| , () | 262.004266 | 0.46 (C), 0.23 (E) |
| , () | 262.0064034 | 0.46 (C), 0.23 (E) |
| , () | 262.0648433 | 1.86 |
| , () | 262.0673312 | 1.86 |