Birefringence Measurements on Crystalline Silicon
Abstract
Crystalline silicon has been proposed as a new test mass material in third generation gravitational wave detectors such as the Einstein Telescope (ET).
Birefringence can reduce the interferometric contrast and can produce dynamical disturbances in interferometers.
In this work we use the method of polarisation-dependent resonance-frequency analysis of Fabry-Perot-cavities containing silicon as a birefringent medium.
Our measurements show a birefringence of silicon along the (111) axis of the order of at a laser wavelength of 1550 nm and room temperature.
A model is presented that explains the results of different settings of our measurements as a superposition of elastic strains caused by external stresses in the sample and plastic strains possibly generated during the production process.
An application of our theory on the proposed ET test mass geometry suggests no critical effect on birefringence due to elastic strains.
DCC number: LIGO-P1500040-V1
1 Introduction
The initial as well as the advanced version of gravitational wave (GW) detectors, which are currently being installed, such as aLIGO and advanced Virgo, use suspended fused silica optics as test masses [1, 2]. These observatories are set up as dual-recycled cavity-enhanced Michelson-type laser interferometers with a kilometer-scale baseline and are operated at room temperature. The KAGRA observatory [3] and parts of the proposed Einstein Telescope (ET) [4] will be operated at cryogenic temperatures and will use new test mass materials in order to reduce thermal noise. In the case of the low frequency interferometer of the Einstein Telescope (ET-LF) [4] crystalline silicon has been suggested as test mass material. The test masses of GW detectors need to have low mechanical loss [5] to limit thermal noise and low optical loss at the laser wavelength to avoid the formation of excessive thermal lenses and an overall heating of test masses. The optical absorption of silicon at the designated ET wavelength of 1550 nm is currently being investigated [6, 7, 8, 9]. The test masses also need to have a low birefringence to allow a high interferometer contrast and high power- and signal-recycling gains [10, 11, 12, 13].
In this paper we investigate birefringence and its effects in silicon test masses at room temperature. The effect of birefringence and an upper birefringence limit for GW detectors is discussed in the next section. We use a Fabry-Perot-cavity to detect the birefringence of silicon which allows the sensing of the integrated birefringence along the axis of the cavity mode. An overview of the measurement method is given in section 2. We present experimental results for the birefringence in silicon samples and a model reproducing the observed behavior. Based on our results we estimate the expected birefringence in the test-masses of ET.
1.1 Effect of birefringence in a Michelson-type interferometer
In GW detectors, linearly polarized laser light is coupled into a resonant arm cavity formed by the test masses of a GW detector (designated TM1 and TM2, respectively), see Figure 1. Due to the orthogonal axes of the indices of refraction ( and , respectively) which are generally not precisely aligned with the polarization of the incident light, the light field is split into two components which sense different optical path lengths inside the test mass. The two orthogonal fields transmitted through the test mass will then be out of phase, resulting in elliptically polarized light inside the cavity (Figure 1). In this work, birefringence-free coatings are assumed. This assumption will be justified in detail in section 4.3 (see also [14, 15, 16]). In this case both polarizations experience the same phase shift under reflection at the cavity mirrors, hence no further change in polarization inside the cavity is added. When leaving the cavity through the incoupling mirror TM1, the birefringence will (in general) further increase the ellipticity (Figure 1). When superimposed on the beam splitter of a GW detector, the two light fields emerging from the two arms (generally having experienced different levels of birefringence) show different polarizations and lead to a reduced contrast of the interferometer. This is of concern as GW detectors are operated close to their dark fringe [4, 17, 18], which is the typical procedure to reduce the light power on the photodetector and to enable power recycling [17].
Furthermore, each polarization dependent optical component implemented in a GW detector, such as optical isolators or polarization-dependent beam splitters, will give rise to additional optical losses once the incident polarization is modified. These losses would reduce the efficiency of advanced techniques such as the use of squeezed light [19, 20]. If the orientation of the birefringence of the test mass materials does not depend on the location of beam transmission through the test masses, an easy solution would be to align the beam polarization and the test masses in a way such that the incident polarization is aligned with one of the orthogonal components of the index of refraction. In this case the effects of birefringence could be suppressed. In practice, however, such an alignment may be not perfect, and furthermore, the birefringence orientation may be a function of the position inside the mirror substrate.
In addition, dynamic effects caused by birefringence, have to be considered; for example an oscillatory rotation of the test mass around the beam axis. If in this case no birefringence is present, there will be no modulation of the light field. But, once there are two different indices of refraction, there will be an oscillatory coupling to the other polarization generating an oscillating intensity at the detection port of the interferometer, which cannot be distinguished from a gravitational wave signal.

The birefringence of fused silica test masses has been estimated to be between [13]. These values were sufficiently low for the initial generation of GW detectors. In Ref. [13], Winkler et al. gave a detailed description on how birefringence can limit a power recycled GW detector with arm cavities. Let be the power losses due to depolarization in a GW detector, then in order to not limit the power build-up in the interferometer
has to be fulfilled, where G is the power-recycling gain of the interferometer.
Making further use of the equations given in [13], we can derive an upper limit for the acceptable birefringence assuming that the axes of the indices of refraction (designated and in Figure 1) of silicon are oriented at an angle of to the linear polarization of the laser light used in the GW detector. An angle of is the worst case since it maximizes the resulting ellipticity. According to [13]
| (1) |
with L being the substrate length and being the laser wavelength. The ET-LF test masses are planned to be cylindrical silicon substrates having a thickness of about 50 cm and a diameter of at least 45 cm. Using parameters provided in the ET Design Study [4] ( nm, and two transmissions through the 50 cm silicon optics) yields as an upper limit for the tolerable birefringence. Please note that this derivation neither takes into account signal-recycling nor the injection of squeezed states. Signal-recycling uses an additional mirror, called Signal Recycling Mirror (SRM), placed between the beam splitter and the photo diode to resonantly influence the amplitude of the signal sidebands created by GWs. The SRM reflects a fraction of the light, leaving the interferometer through the detection port, back into the interferometer [21]. This configuration increases the signal strength of the interferometer in a frequency range depending on the microscopic position of SRM. Generally two ways of operation are distinguished: “Signal Recycling” where the storage time of sidebands is increased by setting the SRM position to resonance for a certain frequency, which increases the sensitivity within the bandwidth of resonance, and “Resonant Sideband Extraction” where SRM is tuned to anti-resonance reducing the storage time of the GW sidebands in the arm cavities and thus widening the sensitive bandwidth of the interferometer. The introduction of SRM generally changes the tolerable optical losses. The ET-LF interferometer will use signal-recycling tuned to a resonance of 25 Hz. With the ET-LF parameters the use of signal recycling does not increase the requirements for optical losses beyond the demands for power recycling.
Squeezed light injected through the signal port of the interferometer results in a more demanding limit for the maximally tolerable losses. The sensitivity gain in a GW detector using squeezed light depends on its optical losses. Aiming for a squeezing level of 10 dB requires a system with total optical losses [12] and hence the losses resulting from birefringence effects alone should be considerably smaller; let us assume as a limit. With the design parameters of ET-LF this results in .
Relation (1), however, assumes the worst case scenario regarding the angle between either of the axes of the indices of refraction and the polarization of the laser light, i.e. an angle of . Carefully adjusting this angle and assuming a constant orientation and value of birefringence in the beam volume inside the optics, can significantly relax the derived limit for the maximally tolerable birefringence. Taking a variable misalignment angle into account relation (1) becomes ([13] and references therein)
| (2) |
By reducing the angle from to a value of the tolerable birefringence increases to
| (3) |
which is in the same order of magnitude as the initially derived limit for a power recycling gain of . If a misalignment of can be achieved, the birefringence limit increases to
1.2 Previous studies on birefringence in silicon
Previous measurements of birefringence of silicon have yielded variable values, some surpassing the threshold given in the previous section and others being well below that limit. In 1959, Lederhandler examined the birefringence of silicon parallel to the direction [22]. The team used light with a wavelength between nm and nm and samples with a specific resistivity between cm and kcm. The measured values of the birefringence varied between . In 1971 Pastrnak and Vedam [23] observed a birefringence of for a wavelength of 1150 nm in the direction and none in the and directions. In 2001, Fukuzawa et al. [24] found that “thermal processing” of silicon wafers introduces “anomalous” birefringence of about at a light wavelength of 1300 nm. This result points out that birefringence in silicon might have origins in the production process. About a year later, Chu et al. [25] measured the birefringence of a silicon single crystal without lattice dislocations (dislocation-free). Along the configuration they measured at a wavelength of 1520 nm. Furthermore, they reported to have observed an “extremely small” level of birefringence when transmitting light along the direction, while their method has been capable of measuring values of the order of .
A summary of the results is given in Table 1. All measurements were performed with rather thin samples compared to the dimensions envisioned in ET, and furthermore lead to partially contradictory results.
| Direction of | Wavelength | Birefringence | Year | Source |
| light propagation | in nm | in | ||
| 1100 - 1200 | 1959 | Lederhandler et al. [22] | ||
| 1150 | (*) | 1971 | Pastrnak et al. [23] | |
| 1150 | 1971 | Pastrnak et al. [23] | ||
| 1150 | (*) | 1971 | Pastrnak et al. [23] | |
| 1300 | 2001 | Fukuzawa et al. [24] | ||
| 1520 | 2002 | Chu et al. [25] | ||
| 1520 | 2002 | Chu et al. [25] |
2 Experiment
In the scope of this work, detailed measurements were performed on sample 1, which is a 1.2 kg test mass having a specific resistivity of 11 kcm with a direction of light propagation being parallel to the crystal orientation. The data shown in Figure 3 and Figure 4 have been obtained using this sample. Furthermore, the data obtained with this sample have been used for the stress simulations presented in section 4.
For comparison and to overcome the FSR ambiguity of our measurement technique we analyzed other samples (samples 2-4) with the same crystal orientation but different thicknesses and different values of resistivity. The laser wavelength was always 1550 nm.
Commonly, birefringence is measured by using a set of two polarizers with an angle of 90∘ between their optical axes. This setup prevents light from being transmitted through both polarizers as the second polarizer blocks all light which is transmitted by the first polarizer. A birefringent sample between the polarizers will partially convert the linearly polarized light transmitted through the first polarizer into the orthogonal polarization which will pass through the second polarizer. The implementation of a polarization modulator then allows a quantitative determination of the bireffringence [26, 27, 28]. In this work, we use a different approach to measure birefringence, which circumvents the use of polarization modulation and hence avoids the necessity to detect small intensity variations of a light field. The method is explained in detail in the next section.
2.1 Experimental Setup
The experimental setup is shown in Figure 2. The silicon sample under investigation is equipped with convex polished surfaces and highly reflective Ta2O5/SiO2 coatings which let the sample form a monolithic cavity. A laser beam of 1550 nm wavelength is coupled into the monolithic silicon cavity. In order to be coupled resonantly into an optical cavity the light field needs to fulfill the condition [29]
| (4) |
where N is an integer, denotes the wavelength, n the index of refraction and is the geometric length of the cavity.
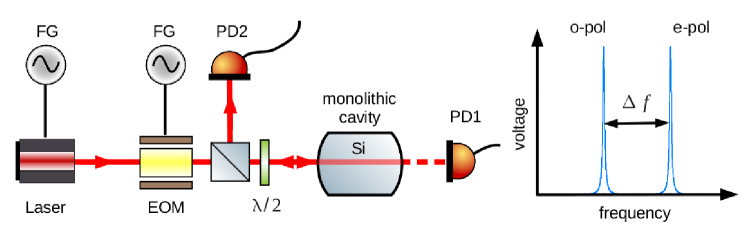
Birefringence means two different indices of refraction and for light of two orthogonal linear polarizations (designated e-pol and o-pol in Fig 2, respectively). Tuning the laser frequency produces two resonances per free spectral range - one per polarization - that can be detected in transmission and reflection of the cavity. The frequency spacing of the resonances allows the deduction of the level of birefringence of the silicon sample under investigation. Similar approaches of measuring birefringence have been used earlier in order to measure the birefringence of high reflective mirrors [14, 15]
In our experiment, the laser was phase modulated with a frequency . The resulting sidebands served as calibration markers for measuring the frequency difference of the two birefringent cavity modes. The laser frequency actuator itself was not sufficiently linear over a full free spectral range of the cavity.
2.2 Theoretical Background
Assuming a birefringent cavity as described above. Let and denote its orthogonal indices of refraction. Similarly, let and denote the laser frequencies, which let and meet the resonance condition (Equation 4) with a given number of nodes and inside the cavity, respectively. Having defined the frequency spacing between the resonance maxima as and denoting the birefringence , we get and similarly .
The resonance conditions (Equation 4) for both polarizations then is
| (5) |
with denoting the speed of light in vacuum. Assuming both polarizations are resonant with the same number of nodes inside the cavity (we will justify this assumption below) and hence . Setting and leads to and which allows to omission of the indices. Since these conditions are valid for the same number of nodes , this leads to
| (6) |
which gives us the birefringence once the frequency difference between the two resonances of the cavity is known.
The measured frequency spacing is, however, ambiguous as it can only be measured modulo free spectral ranges of the cavity. If were to be greater than one free spectral range, one polarization would fulfill the resonance condition with a given number of nodes while the perpendicular polarization would fulfill it with another number of nodes , where is an integer. Since the mode pattern of the cavity repeats every free spectral range, it is not possible to distinguish whether two maxima arise out of the same free spectral range when simply observing the light transmitted through the cavity.
This ambiguity could be overcome by changing the laser frequency over hundreds FSRs of the cavity. If the peaks do not arise from the same FSR, a small change of should be observable. The expected change of for our largest possible laser frequency change was calculated to be lower than the accuracy of our measurement method. This problem, however, can be circumvented by changing the FSR of a the cavity. In this work we exploit the dependence of the cavity’s FSR on the cavity length and measure of different cavities made from the same material but having different lengths .
3 Silicon Samples
Silicon has a cubic face-centered lattice structure [30]. It is known that such structures have vanishing natural birefringence, however, applied stress and external loads can change this behaviour [30]. As the test masses in interferometric GW detectors have weights of many kilograms and are suspended as pendulums, it has to be examined in which way stress affects the optical properties of silicon.
3.1 Overview of samples
Within this work a silicon sample with a mass of 1.2 kg and cylindrical shape (with small lateral flat areas) has been examined (sample 1). Three additional samples (samples 2,3 and 4) of different thicknesses have been used to determine whether the observed modes resonate in the same FSR ().
These additional samples have thicknesses between 2.8 cm and 9.9 cm, have a diameter of 2.4 cm, and give rise to free spectral ranges covering the range from 435 MHz to 1.54 GHz. The values obtained for the frequency spacing are at least two orders of magnitude below the respective free spectral ranges (see Table 2). This finding strongly suggests that the observed transmission maxima indeed resonate in the same free spectral range, hence allowing the application of the theory presented above.
| Sample | Thickness | Diameter | Resistivity | Mass | , | FSR | |
|---|---|---|---|---|---|---|---|
| Number | in mm | in mm | in kcm | in kg | in MHz | in MHz | |
| 1 | 65 | 100 | 11 | 1.2 | 1.26 - 5.98 | 0.23 - 1.07 | 663 |
| 2 | 28 | 24 | 2 | 0.059 | 6.00 - 6.20 | 1.08 - 1.11 | 1539 |
| 3 | 30 | 24 | 30-70 | 0.063 | 1.85 - 2.71 | 0.33 - 0.49 | 1437 |
| 4 | 99 | 24 | 2 | 0.21 | 0.48 - 0.96 | 0.09 - 0.17 | 435 |
The values of the birefringence for the laser beam propagating along the (111) axis are below for samples 3 and 4. This value of birefringence is well below the limit of which has been derived in section 1.1 for arbitrary test mass orientation. With sample 2 shows a birefringence which is slightly above the derived limit. However, aligning the sample better than would keep the birefringence within the derived limits of section 1.1.
The experimentally obtained values of the birefringence for these four samples significantly scatter, strongly depending on the sample under investigation. As inherent strain has been observed in sample 1 (see section below) it seems likely that such inherent strain is present in the remaining samples as well. Such inherent strain resulting from the production process can explain the scattering of the measured data observed in this work.
3.2 Sample 1
With strong experimental evidence that the assumption is correct sample 1 has been used for a deeper analysis of birefringence in silicon.
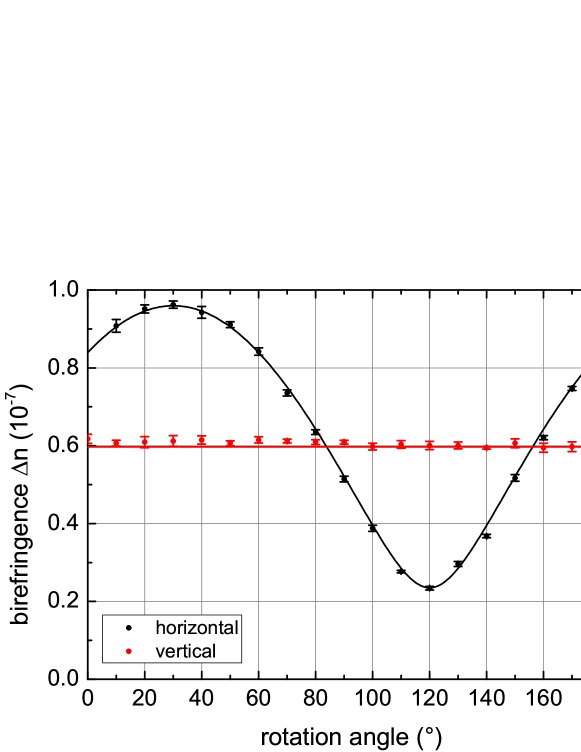
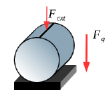
In order to determine the effects of the test mass weight on the birefringence two different experiments have been performed. First the sample has been placed “vertically” such that the gravitational force acts parallel to the optical axis of the cavity (see Fig. 5). In this position a birefringence of has been observed, independent of a rotation around the sample’s cylindrical axis as depicted in Figure 3. Due to the problem’s symmetry the gravitational force causes a radially symmetric strain inside the sample leading to a vanishing birefringence along the cylindrical axis. Hence no birefringence () is expected, which is in contrast to the experimental finding.
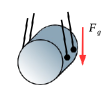
In a second measurement the cavity has been placed “horizontally” such that the gravitational force is acting perpendicular to the optical axis. In this configuration, which is shown in Fig. 5 with an angle between the supporting rods of (see figure caption), the birefringence has been measured at different angles representing a rotation along the optical axis of the cavity. In this case the gravitational force should lead to an anisotropic stress configuration giving rise to birefringence. But the symmetry of such a rotation predicts a constant level of birefringence. In contrast to these considerations the experimental results of birefringence show a periodic pattern presented in Fig. 3. The results range between . The mean value of is close to the birefringence, which has been observed when the gravitational force acts parallel to the optical axis of the sample. This superposition of intrinsic and external stress would allow a minimization of the overall birefringence if the required external stress could be produced by the test mass suspension in a GW detector and the orientation and level of intrinsic birefringence was predictable.
In order to determine how external forces might change the measured birefringence, the sample has been placed onto one of its flats while an extra weight has been placed on top of the opposing flat (see Fig. 5). A clear linear dependence between the birefringence and the external load has been observed as shown in Figure 4. Up to an external weight of 9 kg, no deviation from the linear behaviour has been observed.
The behaviour of the birefringence is, however, subject to the respective mounting. While a load dependence has been seen using a support from below (Fig. 5) a load independent birefringence is obtained using two supports at shown in Fig. 5 and an external load on top. Due to the symmetry of the support in the latter setup an external load from the top of the sample is not expected to cause an anisotropic stress along the axis of the test mass. Thus a change of the external load should not change the observed level of birefringence.


4 Stress Simulations
Figures 3 and 4 show that external forces acting on sample 1 cause additional birefringence inside the crystal. Furthermore, birefringence is present even if no external force is applied to the sample. In order to explain this behavior and to predict the effect of birefringence considering the test masses and their suspensions as proposed for the ET design, a finite element analysis (FEA) was conducted.
4.1 Relation of Strain and Birefringence
Any mechanical force acting on a solid will cause stress and strain within the sample. Via the photoelastic effect the strain in the sample causes a change of the optical properties that is described by the tensor of impermeability . Using the photoelastic tensor the change of the tensor of impermeability can be expressed as
| (7) |
In the following we exclusively use the Voigt contraction of index pairs (, , ) yielding
| (8) |
In the strainless state silicon with its cubic lattice shows isotropic optical properties. Thus, the ellipsoid representing the tensor of impermeability shows a spherical shape. Any strain inside the sample will deform this sphere to an ellipsoid. An incoming wave will cut this ellipsoid by the plane normal to its wave vector resulting in a two-dimensional ellipse. The two semiaxes of this ellipse then determine the effective difference in the refractive index of differently polarized light. Adjusting the wave vector of the incoming wave along the axis of the material coordinate system the ellipsoidal equation reads
| (9) |
To find the semiaxes of this ellipse a rotation of the coordinate system by an angle with
| (10) |
has to be applied. In this new coordinate system the new coefficient vanishes and the semiaxes are obtained from the remaining parameters as
| (11) | |||
| (12) |
These are connected to a change in the refractive index via
| (13) |
In the approximation of small strains and thus small changes in the impermeability an expression for the difference in the refractive indices due to birefringence can be found. It reads
| (14) |
where represents the isotropic refractive index of unstrained silicon.
4.2 Plastic strains
The stress induced birefringence effects discussed above are not sufficient to completely describe the experimental results. Firstly, the vertically aligned cavity (Fig. 5) reveals a non-vanishing birefringence. Due to the rotational symmetry of the gravitational load and the elastic properties of the crystal birefringence should vanish along the cylindrical axis. Secondly, the rotation results of the horizontally aligned cavity shows a non-vanishing mean as expected due to gravitational strains. However, in the experiment this constant value is superimposed by an additional modulation of birefringence exhibiting a two-fold symmetry. As the elastic constants of silicon show a three-fold symmetry along its crystalline axis, the above behavior cannot be explained by the rotation of the elasticity matrix.
These experimental findings lead us to introduce another strain contribution causing birefringence in our sample. In a simple model we allowed for an additional plastic strain whose orientation is fixed within the sample. Assuming a uniaxial character of such a plastic strain results in the following Voigt notation
| (15) |
A rotation of the sample can be considered as a rotation of the coordinate system to describe the plastic strain tensor introduced above. Following the tensor laws a rotation of the coordinate system by an angle leads to modified strain coefficients of
| (16) |
Plastic strains are known to be produced in the manufacturing process of crystalline silicon samples. Mainly during the cooling process temperature gradients arise within the crystal leading to thermal strains. These thermal strains are frozen in during the cooldown process and remain as plastic strains once the sample reaches a homogeneous temperature distribution at room temperature. See e. g. Ref. [22] for a more detailed discussion of this process.
4.3 Simulation
Considering the total strain within the sample as the sum of elastic strains due to gravitational and external loads and plastic strain
| (17) |
allows an efficient explanation of the experimental results. Above the elastic strains have been obtained from a 2D plane strain analysis using the finite element package COMSOL. In this calculation we kept the global coordinate system fixed and accounted for the rotation of the sample by the modification of the coefficient of the elasticity tensor. The plastic contribution has been taken from Eq. (16). Finally inserting from Eq. (17) into Eq. (7) yields the change of the impermeability tensor. From this the birefringence can be calculated via (14). Please note that for these calculations literature values for the tensor of elasticity as well as for the photoelastic tensor have been used. Due to its cubic structure the Voigt notation of the tensor of elasticity for silicon reads
| (18) |
In the following we use the values , and from Ref. [31]. While in general the tensor of photoelasticity is not symmetric the point group of silicon results in the same matrix structure as for the tensor of elasticity. Following Biegelsen [32] we use , and as photoelastic coefficients in silicon. As we fix the global coordinate system in our analysis the coefficients of the material tensors have to be adopted due to rotation. For completeness we state this rotated form in A.
With this model considering plastic as well as elastic strains in the sample we are able to fully explain the behavior of a horizontally and a vertically aligned cavity as presented in Fig. 3. In this respect the theoretical curves for all measurements have been obtained with a single fitting parameter for the plastic strain that is characteristic to our sample. It turns out that in our sample the birefringent effects of plastic strains and strains induced by gravitation are in the same order of magnitude. Further, the birefringence with respect to an additional external loading is explained by the same approach which can be seen in Fig. 4.
Birefringence in the samples examined within the scope of this work can be caused by the bulk material or by the coated cavity surfaces. The latter is realized as a classical layer stack of two alternating coating materials exhibiting a high and low index of refraction. Although the stack shows 20 layer pairs in total most of the light is reflected by the first few coating layers, significantly reducing the effective coating thickness. The substrate has, however, a thickness which is about four orders of magnitude larger than the entire coating material. Consequently, the coating had to cause a birefringence times bigger than the birefringence of the bulk material in order to cause the same frequency spacing. Furthermore, the application of the coating is performed at significantly lower temperatures than the production of silicon. For this reason the frozen-in plastic strains are expected to be much smaller in the coating as well. Moreover, the birefringence induced in the coating due to differences in the coefficients of thermal expansion between bulk and coating should lead to a radially symmetric pattern with no strain, and consequently negligeable birefringence, on the symmetry axis. We hence neglected the contribution of the coating to the birefringence in the analysis above an approach which is supported by the values given in [14, 15, 16].
In our model plastic strains are fixed in the sample’s coordinate system while the elastic strain is oriented along the gravitational force and thus fixed in the global coordinate system. Rotating the sample around its cylindrical axis thus leads to a variation of the total strain in the sample. This allows the minimization of the birefringent effects due to a partial compensation of both strains by a respective choice of the sample’s rotation angle. Such a scheme also allows for the reduction of optical losses due to birefringence in future gravitational wave detectors if gravity induced strain and internal strain are of comparable magnitude.
4.4 Predictions for the Einstein Telescope
In this section our experimental results are transferred to suspended pendula as shown in Fig. 5. To incorporate the effect of the different mechanical load scheme we ran another FEA calculation. We focused on predicting the birefringence introduced by gravity using the same parameters that have been successfully used to explain our experimental findings before.

This additional computation has been performed on a test mass geometry proposed for the low frequency interferometer of the Einstein Telescope (ET-LF), i. e. using cylindrical substrates with a diameter of 45 cm and a thickness of 50 cm. For any point on the sample the difference of the index of refraction due to birefringence has been evaluated using Eq. (14) and is presented in Fig. (6). Across the sample the values of birefringence change significantly between close to the suspension points and within the central part () of the test mass.
In contrast to our cavity measurements the beam size (ca. 86% of power inside) in ET-LF will be about 9 cm to reduce thermal noise. Such a beam will sense not only a single point on the test mass but a larger area. In order to determine the total level of birefringence encountered by a transmitting beam a sophisticated averaging has to be applied. For our purpose, however, it is sufficient to take the maximum value of within the beam diameter and use it for calculations of a worst case scenario. Our simulation yields a maximum birefringence of in the area of beam transmission. These values are two orders of magnitude below the upper limit of obtained earlier. Although in our analysis we used a 2D model including suspended lines instead of suspended points this result suggests, that elastic birefringence should be no limit for the Einstein Telescope. However, this calculation gives no insight into the birefringence due to plastic strains, which have been causing a higher level of birefringence () in the samples examined in the scope of this work and may be even larger for ET size test masses.
4.5 Comparison of Test Mass Materials
Sapphire has been proposed as a test mass material which will be implemented in the KAGRA gravitational wave detector. While silicon is isotropic, sapphire is a uniaxial material [30] which gives rise to an intrinsic birefringence between the c-axis and the a-axes of . Letting the light propagate along the c-axes of the sapphire crystal should minimize the birefringence. In their work Yan et al. [33] measured values for the birefringence in sapphire cylinders of 15 cm diameter and 6 cm thickness with light propagating parallel to the c-axis to exceed the values of silicon obtained in this work by 30-40%.
5 Conclusion
In this paper we present a sensitive method for the experimental characterization of birefringence in optical materials. It is based on the evaluation of the frequency spacing between the two orthogonally polarized optical resonances of a monotlithic cavity made of the respective material. Applying this method to a monocrystalline silicon (111) cavity at room temperature, we investigated the dependence of birefringence on a rotation of the sample as well as on an external load. The method presented can be applied to cavities at arbitrary temperatures which allows the examination of silicon birefringence at cryogenic temperatures without changing the measurement method. Since the test masses of the low frequency interferometers of ET will be operated at such temperatures, the measurements performed in the scope of this work should be repeated at cryogenic temperatures. Utilizing FEA calculations allowed us to explain the observed behavior by a superposition of elastic strains due to gravity or external loads as well as plastic strains that show a fixed orientation within the sample. The measurements have further shown that it was possible to significantly reduce the amount of present birefringence by choosing an appropriate superposition of elastic and plastic strain in the sample. This is, however, only possible as long as both elastic and plastic strain are on the same order of magnitude.
Applying our results to the proposed ET-LF design suggests that the gravity-induced birefringence along the test mass axis is negligibly small in this detector. Thus the level of plastic strains in the sample are likely to dominate the birefringence in such an application.
The injection of squeezing demands a level of birefringence which can be met by aligning sample and polarization better than 4∘. Such an alignment would allow the use of all sample materials examined in this work in a GW detector. If local variations of the level of birefringence or a locally variable orientation of the axes of the indices of refraction existed, however, the effect of this approach would be limited. A more detailed investigation of the sources of plastic strains, including large silicon crystals, should be performed in the future. Former works [22] on crystalline silicon already identified a clear correlation between regions showing a high density of dislocations and regions showing an increased level of birefringence. While current silicon crystals show nearly no dislocations our experiments revealed that there is still a considerable contribution of plastic strains to birefringence. Annealing the samples or reducing the cooling rates during and after crystal growth may be a way to minimize plastic strains. Further experiments on birefringence distribution can help to identify the geometry of microscopical defects frozen in during crystal growth and causing plastic strains in the sample.
Acknowledgements
We acknowledge financial support from the SFB/Transregio 7, the Aspera 3rd common call ”ET R&D - Networking and R&D for the Einstein Telescope” and the EU under the ”ELiTES” project (IRSES no. 295153).
Appendix A Coefficients of rotated coordinate system
In cubic systems the simplest shape of a fourth order tensor can be obtained by chosing the (100) axes as basis vectors (, , ). Then the Voigt representation of the tensor exhibits the shape shown in Eq. (18). To describe a cylinder in its geometry coordinate system the cylindrical axis should be along the axis of a new coordinate system (, , ). For the case of a (111) orientation the new base vector should point along the (111) direction of the old basis, i. e. should be proprotional to the sum of the old basis . The general transformation between the two systems of basis vectors reads
| (19) |
with
| (20) |
In the equation above represents the rotational angle along the cylindrical axis which remains as a degree of freedom in the orientation of the new coordinate system. With the knowledge of the coordinate transform tensor the coefficients of the fourth rank material tensors in new coordinates are available as
| (21) |
An explicit calculation and transform to Voigt notation reveals
| (22) |
with a symmetric expansion to the lower half of the matrix. The connection to the three original coefficients is obtained by the following equations
| (23) | ||||||
| (24) | ||||||
| (25) | ||||||
| (26) |
The same rule of transformation holds for the photoelastic tensor in silicon as it exhibits the same structure as the elasticity tensor.
Further these new coefficients enter into the final evaluation of the birefringence.
References
References
- [1] Harry G M et al. 2010 Class. Quantum Grav. 27 084006
- [2] The Virgo Collaboration 2009 Advanced Virgo Baseline Design available at https://tds.ego-gw.it VIR-027A-09
- [3] Somiya K et al. 2012 Class. Quantum Grav. 29 124007
- [4] ET Science Team 2011 Einstein gravitational wave Telescope Conceptual Design Study available at www.et-gw.eu ET-0106C-10
- [5] Nawrodt R, Zimmer A, Koettig T, Schwarz C, Heinert D, Hudl M, Neubert R, Thürk M, Nietzsche S, Vodel W and Seidel P 2008 J. Phys.: Conf. Ser. 122 012008
- [6] Khalaidovski A, Steinlechner J and Schnabel R 2013 Class. Quantum Grav. 30 165001
- [7] Degallaix J, Flaminio R, Forest D, Granata M, Michel C, Pinard L, Bertrand T and Cagnoli G 2013 Opt. Lett. 38 2047–9
- [8] Degallaix J, Komma J, Forest D, Hofmann G, Granata M, Heinert D, Schwarz C, Nawrodt R, Pinard L, Michel C, Flaminio R and Cagnoli G 2014 Class. Quantum Grav. 31 185010
- [9] Bell A S, Steinlechner J, Rowan S, Hough J, Martin I, Komma J, Heinert D, Nawrodt R and Degallaix J 2014 6th Einstein Telescope Symposium, Lyon available at www.et-gw.eu, ET-0056A-14
- [10] Drever R et al. 1983 Quantum Optics, Experimental Gravitation and Measurement Theory (Plenum, New York)
- [11] Meers B 1988 Phys. Rev. D 38 2317–2326
- [12] Eberle T, Steinlechner S, Bauchrowitz J, Händchen V, Vahlbruch H, Mehmet M, Müller-Ebhardt H and Schnabel R 2010 Phys. Rev. Let. 104 251102
- [13] Winkler W, Rüdiger A, Schilling R, Strain K A and Danzmann K 1994 Opt. Commun. 112 245–252
- [14] Moriwaki S, Sakaida H, Yuzawa T and Mio N 1997 Appl. Phys. B 65 347–350
- [15] Brandi F, Valle F D, Riva A D, Micossi P, Perrone F, Rizo C, Ruoso G and Zavattini G 1997 Appl. Phys. B 65 351–355
- [16] Camp J, Kells W, Fejer M and Gustafson E 2001 Appl. Optics 40 3753–3758
- [17] Meers B 1988 Phys. Rev. D 38 2317–26
- [18] The LIGO Scientific Collaboration 2009 Rep. Prog. Phys. 72 076901
- [19] Schnabel R, Mavalvala N, McClelland D E and Lam P K 2010 Nat. Commun. 1 121
- [20] Mehmet M, Ast S, Eberle T, Steinlechner S, Vahlbruch H and Schnabel R 2011 Opt. Express 19 25764
- [21] Strain K, Danzmann K, Mizuno J, Nelson P, Rüdiger A, Schilling R and Winkler W 1994 Phys. Lett. A 194 124–132
- [22] Lederhandler S R 1959 J. Appl. Phys. 30 1631–8
- [23] Pastrnak J and Vedam K 1971 Phys. Rev. B 3 2567–2571
- [24] Fukuzawa M and Yamada M 2001 J. Cryst. Growth 229 22–25
- [25] Chu T, Yamada M, Donecker J, Rossberg M, Alex V and Reimann H 2002 Mat. Sci. Eng. B. 91–92 174–177
- [26] Benabid F, Notcutt M, Ju L and Blair D G 1998 Phys. Lett. A 237 337–342
- [27] Wang B and Oakberg T C 1999 Rev. Sci. Instrum. 19 3847–54
- [28] Modine F A, Major R W and Sonder E 1975 Appl. Opt. 14 757–760
- [29] Hecht E 1987 Optics (Addison-Wesley Publishing Company)
- [30] Weber M J 2003 Handbook of Optical Materials (CRC Press)
- [31] McSkimin H J 1953 J. Appl. Phys. 24 988–997
- [32] Biegelsen D K 1974 Phys. Rev. Lett. 32 1196–9
- [33] Yan Z, Ju L, Zhao C, Gras S, Blair D, Tokunari M, Kuroda K, Mackowski J M and Remillieux A 2006 Appl. Optics 45 2631–2637