Observed and predicted Ly and UV lines
for a sample of galaxies at redshifts z3.7
We explore the origin of the observed Ly and other UV lines from galaxies at z 3.7 by detailed modelling of the spectra. The objects are chosen among those showing a) UV - optical - near-IR lines, b) only UV lines and c) those showing Ly in the UV and a few optical lines. We also present UV line predictions for a sample of galaxies in the 0.0686z0.8829 range. The sample of galaxies including Ly observations in their spectra does not show peculiar physical conditions of the emitting gas, nor abnormal element abundances. However, the high velocity ( 1000 ) component of the emitting gas is accompanied by relatively low preshock densities ( 100-400 ) leading in some cases to broad forbidden lines. Some spectra are best reproduced by shock dominated models in which the photoionizing source is hidden or absent. Within more than 50 galaxies modelled in this work, only a few spectra from galaxies at z2.5 correspond to a starburst temperature 105 K, similar to that found in galaxies showing some activity.
Key Words.:
radiation mechanisms: general — shock waves — ISM: abundances — galaxies: Seyfert — galaxies: starburst — galaxies: high redshift1 Introduction
Ly is one of the strongest lines in the UV because H is the most abundant element and because corresponding to the 1S-2P transition. Ly 1215 line in the far-UV is now reported by observations of galaxies at high redshifts (e.g. Humphrey et al 2008, Dawson et al 2003, Stern et al 2002, Erb et al 2010, Fosbury et al 2003, Vernet et al 2000, Dey et al 2005, Norman et al 2002, Finkelstein et al 2011 etc). The line flux is absorbed by dust, depending on the environments of the Ly emitting nebula. The grains embedded into the gaseous clouds or distributed throughout the photon’s way to Earth can lead to a significant drop of the flux (Finkelstein et al 2011). The escape probability was treated by Atek et al (2014) who confirmed that the Ly escape fraction depends on the dust extinction, but the correlation does not follow the expected curve for a simple dust attenuation. They claim that a higher attenuation can be attributed also to a scattering process and that the strength of Ly and the escape fraction appear unrelated to the galaxy metallicity.
Supernova (SN) events throughout galaxies lead to specific shocks in the regions surrounding the SN explosion (Heng & Sunyaev 2008) and close to outbursts in novae and symbiotic stars (Contini et al 2009). Heng & Sunyaev (2008) claim that charge transfer reactions between hydrogen atoms and protons in collisionless shocks of SN remnants produce broad Balmer, Lyman, and other hydrogen lines with increased Ly /H .
Generally, photoionization by active galactic nuclei (AGN) or by starbursts (SB) is the main heating and ionizing mechanism of gas throughout the galaxy. When no photoionization source is seen, and much of the energy is provided by the conversion of kinetic energy of motion into heat, e.g. when fast moving matter collides with ambient ISM gas, ionization and thermal energy are released. They will be partly radiated as recombination and collisional line emission (Osterbrock 1989).
It was suggested that high redshift galaxies originate from merging (e.g. Ryan et al 2008). Therefore strong shocks could appear in some regions of the product galaxy, as e.g. in the local galaxy NGC 3393 (Contini 2012). Yajima et al (2012) proposed a formation model from major mergers of gas rich galaxies emitting the Ly line. They claim that at z 2 the merger rate is higher in dense region and the progenitors are more gas rich. Lyman break technique could be employed to explore galaxies at 0.8 z 2.5 (Oteo et al. 2002). Merging galaxies emit Ly as well as many other lines. Observations of UV lines are now available from galaxies at high z, in particular NV 1240, CIV 1550, HeII 1640, etc. and eventually OVI 1034. They are emitted by high ionization-level ions that are easily produced in shock heated gas corresponding to suitable velocities. High ionization-level lines are strong from C, N, O, Ne, etc. in the IR, optical, and UV frequency ranges. Most of the UV lines (e.g. OIV, OV, NV) are permitted, while e.g. [NV], [OV], etc in the optical and IR are forbidden and thus collisionally deexcited at high densities.. Permitted lines originate from recombination and depend on radiative processes. Both radiation and collisional processes should be considered in the calculation of line spectra rich enough to constrain the models. Composite models (shock +photoionization) were adopted to explain the spectra from local merging galaxies (e.g. NGC 7212, NGC 3393, NGC 6240, Arp 220, Contini 2013a and references therein) and were used in the spectral line analysis of galaxies at a relatively high z (Contini 2014a and references therein.)
In this paper we explore the origin of the observed Ly and other lines in the UV from galaxies at z 3.7 by detailed modelling of the spectra. Our aim is to find out not only the gas physical conditions and element abundances throughout the emitting clouds, but to determine the nature of the radiation source, such as a AGN, a SB or only shocks. The objects were chosen among those showing a) UV - optical - near-IR lines (Humphrey et al, Dawson et al, Stern et al, Erb et al and Fosbury et al), b) only UV lines (Vernet et al, Dey et al and Norman et al) and c) those showing Ly in the UV and a few optical lines (Finkelstein et al). We also present UV line predictions for a sample of galaxies (Ly et al 2014) in the 0.0686z0.8829 range, where the physical conditions of the emitting gas are constrained by the observed optical lines, in particular [OIII]4363. The total sample which includes galaxies in an all-sky radio survey, hard X-ray emitting sources, a type 2 QSR identified as a X-ray source, a type 2 AGN at high z (3.7), a very large spacially extended Ly emitting nebula, objects in a multi-band imaging survey for Lyman break galaxies, in a slitless spectroscopic survey for LAEs, etc. is rather heterogeneous. However, the observed spectra from high z objects accounting for the Ly line and for enough lines constraining the models, are few, so we gathered them from different classes of objects.
| log | log | symbols | |||
|---|---|---|---|---|---|
| [104 K] | [cm] | ||||
| AGN | 100 | 100 | - | 17 | black dotted |
| 100 | 100 | - | 19 | black dash-dotted | |
| 200 | 200 | - | 18 | blue dotted | |
| 200 | 200 | - | 19 | blue dash-dot | |
| 100 | 300 | - | 17 | magenta dotted | |
| 100 | 300 | - | 19 | magenta dash-dot | |
| 300 | 300 | - | 17 | green dotted | |
| 300 | 300 | - | 19 | green dash-dot | |
| 500 | 300 | - | 18 | red dotted | |
| 500 | 300 | - | 19 | red dash-dot | |
| SB | 100 | 100 | 4.0 | 19 | red solid |
| 100 | 100 | 4.7 | 19 | red dash-dot | |
| 100 | 100 | 5.0 | 19 | red dash | |
| 200 | 200 | 4.0 | 19 | blue solid | |
| 200 | 200 | 4.7 | 19 | blue dash-dot | |
| 200 | 200 | 5.0 | 19 | blue dash | |
| 300 | 300 | 4.0 | 19 | magenta solid | |
| 300 | 300 | 4.7 | 19 | magenta dash-dot | |
| 300 | 300 | 5.0 | 19 | magenta dash | |
| 500 | 300 | 4.0 | 19 | black solid | |
| 500 | 300 | 4.7 | 19 | black dash-dot | |
| 500 | 300 | 5.0 | 19 | black dash |
We calculate for each galaxy the gas density, temperature, shock velocity, etc., as well as the element abundances and the photoionizing source. The presence of an AGN or/and of a SB, collision heating and ionization of the ISM gas by shocks, the element abundances and dust survival throughout the clouds are important issues for middle and high redshifts galaxies which are tracers of star formation and evolution. The calculation models are briefly described in Sect. 2. Modelling results of the galaxy spectra are presented in Sect. 3. Results and concluding remarks are discussed in Sect. 4.
| 0211-122 1 | FWHM2 | MH1 | MH2 | MH3 | av | 0406-244 1 | MH4 | MH5 | av | |
| z | 2.340 | 2.440 | ||||||||
| SFR(M⊙ yr-1) | 24.85 | 911. | ||||||||
| Ly 1216 | 0.210.01 | 1000 | 9.7 | 13.3 | 9.9 | 10.0 | 7.00.4 | 25.6 | 21.2 | 25.5 |
| NV 1240 | 0.350.03 | 1. | 3.87 | 0.005 | 0.2 | 0.2 | 0.005 | 10.9 | 0.25 | |
| SiIV+OIV 1403 | 0.0740.008 | 0.33 | 3.33 | 0.01 | 0.15 | 0.30.1 | 0.04 | 10.0 | 0.27 | |
| NIV]1485 | 0.0240.005 | 0.07 | 0.83 | 0.007 | 0.04 | 0.1 | 0.02 | 2.17 | 0.069 | |
| CIV 1549+ | 0.650.02 | 1. | 7.67 | 0.15 | 0.5 | 0.90.1 | 0.31 | 20.7 | 0.772 | |
| HeII 1640 | 0.360.01 | 600 | 0.83 | 0.67 | 0.4 | 0.42 | 1.20.1 | 1.44 | 5.27 | 1.53 |
| OIII]1667 | 0.0280.003 | 0.13 | 1.23 | 0.04 | 0.1 | 0.20.1 | 0.09 | 3.6 | 0.17 | |
| CIII] 1909 | 0.170.03 | 0.33 | 3.67 | 0.46 | 0.5 | 0.90.1 | 0.8 | 9.9 | 1.0 | |
| CII] 2326 | - | 0.2 | 1.57 | 0.1 | 0.17 | 0.60.1 | 0.46 | 3.85 | 0.54 | |
| [NeIV]2423 | 0.110.01 | 0.07 | 0.7 | 0.03 | 0.06 | 1.00.3 | 0.09 | 8.0 | 0.3 | |
| [NeV] 3426 | 0.3 | 0.07 | 0.7 | 0.02 | 0.05 | 0.50.1 | 0.05 | 1.8 | 0.1 | |
| [OII]3728+ | 0.390.08 | 730 | 0.17 | 1.33 | 0.45 | 0.48 | 2.60.2 | 2.65 | 3.7 | 2.67 |
| [NeIII]3869 | 0.310.08 | 390 | 0.13 | 0.67 | 0.34 | 0.36 | 1.00.1 | 1.13 | 2.0 | 1.15 |
| [OIII]4363 | 0.4 | 0.02 | 0.2 | 0.032 | 0.04 | - | - | - | - | |
| HeII 4686 | 0.2 | 0.07 | 0.07 | 0.03 | 0.036 | 0.210.06 | 0.2 | 0.4 | 0.21 | |
| H quiescent | 0.5 | 0.33 | 0.33 | 0.33 | 0.33 | 1.0.74 | 1. | 1. | 1. | |
| [OIII] 5007+ quiescent | 2.810.1 | 500 | 0.4 | 2.67 | 4.3 | 4.2 | 12.60.1 | 13. | 10.0 | 12.9 |
| [OIII] 5007+ perturbed | 1.610.06 | 1300 | - | - | - | - | - | - | - | - |
| [OI] | 0.2 | 0.10 | 0.67 | 0.09 | 0.11 | - | 1.3 | 0.58 | 1.28 | |
| H quiescent | 0.770.153 | 500 | 1 | 1 | 1 | 1.0 | 3.3 | 2.9 | 3.1 | 2.9 |
| H perturbed | 0.230.08 | - | - | - | - | - | - | - | - | - |
| [NII] 6585+ | 0.2 | - | 0.43 | 1.33 | 0.58 | 0.6 | - | - | - | - |
| [SII] 6725+ | 0.2 | - | 0.013 | 0.13 | 0.05 | 0.055 | - | - | - | - |
| () | 0.2 | - | 1000 | 500 | 300 | - | - | 100 | 700 | - |
| () | - | - | 400 | 300 | 300 | - | - | 100 | 300 | - |
| F 5 | - | - | - | - | 20 | - | - | 1.3 | - | - |
| 6 | - | - | 1 | 1 | 0.01 | - | - | 1 | 0.028 | - |
| C/H 7 | - | - | 3.3 | 3.3 | 3.3? | - | - | 3.3 | 3.3 | - |
| N/H 7 | - | - | 1 | 1 | 1 | - | - | 1. | 1. | - |
| O/H 7 | - | - | 6.6 | 6.6 | 6.6 | - | - | 6.6 | 6.6 | - |
| S/H 7 | - | - | - | - | - | - | - | 0.02 | 0.02 | - |
| H calc8 | - | - | 0.1 | 0.037 | 1.1 | - | - | 0.05 | 0.006 | - |
| w | - | - | 0.014 | 0.58 | 0.40 | - | - | 0.833 | 0.167 | - |
1 in 10-16 ; 2 in ; 3 flux of narrow H is 6.40.5 10-16 ; 4 flux of H is 3.30.2 10-17; 5 in 1010 photons cm-2 s-1 eV-1 at the Lyman limit; 6 in 1019 cm; 7 in 10-4 units; 8 in
| flux1 | 0529-549 | MH6 | MH7 | 0828 | MH8 | MH9 | av | 1138-262 | MH10 | MH11 | 4C+23.56 | MH12 | MH13 |
|---|---|---|---|---|---|---|---|---|---|---|---|---|---|
| z | 2.575 | 2.572 | 2.156 | 2.479 | |||||||||
| SFR(M⊙ yr-1) | 150 | 86. | 56. | 163. | |||||||||
| Ly 1216 | - | 27.0 | 21.2 | 21.7 | 45. | 32.5 | 33.8 | - | 29. | 27.6 | 2.17 | 47.5 | 30.4 |
| NV 1240 | - | 0.07 | 10.9 | 0.9 | 24. | 0.02 | 2.6 | - | 0.024 | 0.017 | 0.31 | 0.03+ | 0.06+ |
| SiIV+OIV 1403 | - | 0.09 | 10. | 0.78 | 2.3 | 0.05 | 0.3 | - | 0.02 | 0.013 | 0.05 | 0.19 | 0.13 |
| NIV]1485 | - | 0.02 | 2.17 | 0.18 | 1.3 | 0.02 | 0.16 | - | 0.002 | 0.002 | 0.06 | 0.08 | 0.02 |
| CIV 1549+ | - | 0.2 | 20.7 | 4.5 | 30.3 | 0.2 | 3.5 | - | 0.054 | 0.01 | 0.51 | 1.63 | 0.33 |
| HeII 1640 | - | 0.83 | 5.27 | 2.57 | 5.8 | 1. | 1.5 | - | 0.6 | 0.011 | 0.43 | 3.7 | 1.32 |
| OIII]1667 | - | 0.065 | 3.6 | 0.46 | 3.15 | 0.1 | 0.43 | - | 0.04 | 0.009 | 0.11 | 0.37 | 0.11 |
| CIII] 1909 | - | 0.55 | 9.9 | 1.4 | 4.2 | 1.1 | 1.43 | - | 0.46 | 0.1 | 0.28 | 0.7 | 1. |
| CII] 2326 | - | 0.56 | 3.85 | 0.48 | 3.4 | 0.9 | 1.17 | - | 0.35 | 0.1 | 0.22 | 0.19 | 0.85 |
| [NeIV]2423 | - | 0.04 | 8. | 1.2 | 2. | 0.05 | 0.26 | - | 0.02 | 0.0027 | 0.37 | 0.26 | 0.06 |
| [NeV] 3426 | 2.1 | 0.018 | 1.8 | 0.76 | 8.85 | 0.012 | 0.98 | - | 0.01 | 0.0028 | 0.74 | 0.2 | 0. |
| [OII]3728+ | 3.2 | 3.3 | 3.7 | 1.75 | 2.1 | 3.7 | 3.5 | 1.44 | 1.35 | 1.2 | 2.57 | 2.7 | 3.4 |
| [NeIII]3869 | 2.1 | 1.0 | 2. | - | 1.6 | 1.48 | 1.5 | 0.82 | 0.68 | 0.29 | 0.74 | 1.36 | 1.5 |
| [OIII] 4363 | 1 | 0.04. | 0.63 | - | - | - | - | - | - | - | - | - | - |
| HeII 4686 | 1 | 0.12 | 0.4 | 0.29 | 0.44 | 0.15 | 0.18 | 0.88 | 0.09 | 0.002 | 0.86 | 0.53 | 0.2 |
| H | 1. | 1. | 1 | 1 | 1 | 1 | 1 | 1 | 1 | 1 | 1 | 1 | 1 |
| [OIII] 5007+ | 10.7 | 9.0 | 10 | 9.53 | 8. | 11.8 | 11.4 | 6. | 6.3 | 6.16 | 13.05 | 12.5 | 13.5 |
| [OI] 6300+ | 0.58 | 1.1 | - | - | - | - | - | 0.59 | 0.5 | 0.002 | 0.28 | 0.7 | 1 |
| H | 5.2 | 3.0 | 3.1 | 3 | 3 | 3 | 3 | 3 | 3 | 3 | 3 | 3 | 3 |
| [NII] 6585+ | 2.6 | 2.76 | 0. | - | - | - | - | 2.35 | 1.9 | 0.8 | 0.8 | 1.0 | 1.86 |
| [SII] 6725 | 1.58 | 0.6 | 0. | - | - | - | - | 0.85 | 0.63 | 0.1 | 0.86 | 0.8 | 0.7 |
| () | - | 180 | 700 | - | 700 | 1200 | - | - | 300 | 300 | - | 200 | 200 |
| () | - | 100 | 300 | - | 400 | 400 | - | - | 300 | 300 | - | 300 | 300 |
| 2 | - | - | - | - | - | - | - | - | - | 4 | - | 25. | - |
| - | - | - | - | - | - | - | - | - | 0.8 | - | 0.16 | - | |
| F 3 | - | 1.0 | - | - | - | 6 | - | - | 8 | - | - | - | 4 |
| 4 | - | 1 | 0.028 | - | 0.019 | 0.3 | - | - | 0.01 | 0.01 | - | 1. | 0.01 |
| C/H 5 | - | 3.3 | 3.3 | - | 3.3 | 3.3 | - | - | 3.3 | 3.3 | - | 0.8 | 0.8 |
| N/H 5 | - | 1 | 1 | - | 1 | 1 | - | - | 1. | 1 | - | 0.5 | 0.5 |
| O/H 5 | - | 6.6 | 6.6 | - | 6.6 | 6.6 | - | - | 6.6 | 6.6 | - | 6.6 | 6.6 |
| S/H 5 | - | - | - | - | - | - | - | - | 0.3 | 0.3 | - | 0.3 | 0.3 |
| H calc 6 | - | 0.06 | 0.0058 | - | 0.0089 | 0.29 | - | - | 0.62 | 1.6 | - | 0.59 | 0.14 |
| w | - | - | - | - | 0.8 | 0.2 | - | - | - | - | - | - | - |
1 in 10-16 ; 2 in 104 K; 3 in 1010 photons cm-2 s-1 eV-1 at the Lyman limit; 4 in 1019 cm; 5 in 10-4 units; 6 in .
2 The calculation code
The line and continuum spectra emitted by gas and dust are calculated by the code suma111http://wise-obs.tau.ac.il/marcel/suma/index.htm. The code simulates the physical conditions in an emitting gaseous cloud under the coupled effect of photoionization from an external radiation source and shocks. The line and continuum emission from the gas are calculated consistently with dust-reprocessed radiation in a plane-parallel geometry.
2.1 Input parameters
To calculate line and continuum fluxes emitted from a gas nebula, the temperature, density and element abundances should be known. In a shock dominated hydrodynamical regime the density profile throughout the nebula is shaped by the shock, while radiative and collisional heating and ionization of the gas are due to radiation from the external source (AGN, SB) and by the shock, respectively. The input parameters which characterise the shock are roughly suggested by the data, e.g. the shock velocity by the FWHM of line profile and the pre-shock density by the characteristic line ratios and by the pre-shock magnetic field . We adopt = 10-4 G, which is suitable to the NLR of AGN (Beck 2011).
The ionizing radiation from an external source is characterized by its spectrum and by the flux intensity. The flux is calculated at 440 energies, from a few eV to keV. If the photoionization source is an active nucleus, the input parameter that refers to the radiation field is the power-law flux from the active center in number of photons cm-2 s-1 eV-1 at the Lyman limit with spectral indices =-1.5 and =-0.7. It was found by modelling the spectra of many different AGNs that these indices were the most suitable, in general. (see, e.g. Contini & Aldrovandi 1983, Aldrovandi & Contini 1984, Rodríguez-Ardila et al 2005, and references therein). In particular, for all the models presented in the following, we use = -1.5, recalling that the shocked zone also contributes to the emission-line intensities, so that our results are less dependent on the shape of the ionizing radiation. The power-law in the X-ray domain was found flatter by the observations of local galaxies (e.g. Crenshaw et al 2002, Turner et al 2001). is combined with the ionization parameter by : = (/(n c ( -1)) (( - ) (Contini & Aldrovandi, 1983), where is H ionization potential and is the high energy cutoff, the density, the spectral index, and c the speed of light. If stars with a colour temperature are the photoionization source, the number of ionizing photons cm-2 s-1 produced by the hot source is =/h d, where = 3.29 1015 Hz and Bν is the Planck function. The flux from the star is combined with and n by (r/R)2=nc, where r is the radius of the hot source, R is the radius of the nebula (in terms of the distance from the stars). Therefore, and compensate each other, but only in a qualitative way, because the black body radiation (which depends on ) determines the frequency distribution of the primary flux, while represents the number of photons per number of electrons reaching the nebula. The choice of and is made by the fit of the line ratios.
In addition to the radiation from the primary source, the effect of the diffuse radiation created by the hot gas is also calculated, using 240 energies for the spectrum. The geometrical thickness of the emitting nebula determines whether the model is radiation-bounded or matter-bounded. The dust-to-gas ratio () and the abundances of He, C, N, O, Ne, Mg, Si, S, A, Fe relative to H, are also accounted for. We adopt an initial grain radius agr=1m .
2.2 Calculation process
The code accounts for the direction of the cloud motion relative to the external photoionizing source. A parameter switches between inflow (the radiation flux from the source reaches the shock front edge of the cloud) and outflow (the flux reaches the edge opposite to the shock front). The calculations start at the shock front where the gas is compressed and thermalized adiabatically, reaching the maximum temperature in the immediate post-shock region (T ( /100 )2). T decreases downstream by the cooling rate and the gas recombines. The downstream region is cut into a maximum of 300 plane-parallel slabs with different geometrical widths calculated automatically, in order to account for the temperature gradient (Contini 2009 and references therein). In each slab, compression () is calculated by the Rankine–Hugoniot equations for the conservation of mass, momentum and energy throughout the shock front (Cox 1972). Compression ranges between 4 (the adiabatic jump) and 100, depending on and . The stronger the magnetic field, the lower the compression downstream, while a higher shock velocity corresponds to a higher compression. The cooling rate is calculated in each slab by free-free (bremsstrahlung), free-bound and line emission. Therefore, most emission lines must be calculated in each slab even if only a few ones are observed because they contribute to the temperature slope downstream.
In pure photoionization models, the density is constant throughout the nebula. In models accounting for the shocks, both the electron temperature and density show a characteristic profile throughout each cloud. The density reaches its upper limit at a certain distance from shock-front and remains nearly constant, while decreases following recombination.
The primary and secondary radiation spectra, calculated by radiation transfer, change throughout the downstream slabs, each of them contributing to the optical depth. In each slab of gas the fractional abundance of the ions of each chemical element is obtained by solving the ionization equations which account for photoionization (by the primary and diffuse secondary radiations and collisional ionization) and for recombination (radiative, dielectronic), as well as for charge transfer effects, etc. The ionization equations are coupled to the energy equation when collision processes dominate (Cox 1972) and to the thermal balance if radiative processes dominate (Williams 1967). The latter balances the heating of the gas due to the primary and diffuse radiations reaching the slab with the cooling due to line emission, dust collisional ionization and thermal bremsstrahlung. The line intensity contributions from all the slabs are integrated throughout the cloud. In particular, the absolute line fluxes referring to the ionization level i of element K are calculated by the term (i) which represents the density of the ion X(i). We consider that (i)=X(i)[K/H], where X(i) is the fractional abundance of the ion i calculated by the ionization equations, [K/H] is the relative abundance of the element K to H and is the density of H (by number ). In models including shock, is calculated by the compression equation in each slab downstream. So the element abundances relative to H appear as input parameters. To obtain the N/H relative abundance for each galaxy, we consider the charge exchange reaction N++H N+H+ (Steigman et al. 1971). Charge exchange reactions occur between ions with similar ionization potential (I(H+)=13.54 eV, I(N+)=14.49 eV and I(O+)=13.56 eV). It was found that N ionization equilibrium in the ISM is strongly affected by charge exchange. This process as well as O++H O+H+ (Field & Steigman 1971) are included in the SUMA code. The N+/N ion fractional abundance follows the behaviour of O+/O so, comparing the [NII]/H and the [OII]/H line ratios with the data, the N/H relative abundances can be easily determined (see Contini et al. 2012).
Dust grains are coupled to the gas across the shock front by the magnetic field. They are heated radiatively by photoionization and collisionally by the gas. up to the evaporation temperature ( 1500 K). The distribution of the grain radii downstream is determined by sputtering (Dwek 1981), which depends on the shock velocity and on the gas density. Throughout shock fronts and downstream, the grains might be completely destroyed by sputtering. The dust-to gas ratio affects the mutual heating and cooling of gas and dust.
The calculations proceed until the gas cools down to a temperature below 103 K (the model is radiation bounded) or the calculations are interrupted when all the lines reproduce the observed line ratios (the model is matter bounded). In case that photoionization and shocks act on opposite edges, i.e. when the cloud propagates outwards from the radiation source, the calculations require some iterations, until the results converge. In this case the cloud geometrical thickness plays an important role. Actually, if the cloud is very thin, the cool gas region may disappear leading to low or negligible low ionization level lines.
Summarizing, the code starts in the first gas slab adopting the input parameters given by the model. Then, it calculates the density, the fractional abundances of the ions from each level for each element, free-free, free-bound and line emission fluxes. It calculates by thermal balancing or the enthalpy equation, and the optical depth of the slab in order to obtain the primary and secondary fluxes by radiation transfer for the next slab. Finally, the parameters calculated in slab i are adopted as initial conditions for slab i+1. Integrating the line intensities from each slab, the absolute fluxes of the lines and of bremsstrahlung are obtained at the nebula. The line ratios to a certain line (generally H for the optical-UV spectrum) are then calculated and compared with the observed data, in order to avoid problems of distances, absorption, etc. The number of the lines calculated by the code (more than 300) does not depend on the number of the observed lines nor on the number of input parameters, but on the elements composing the gas.
2.3 Selection of the models. The grids
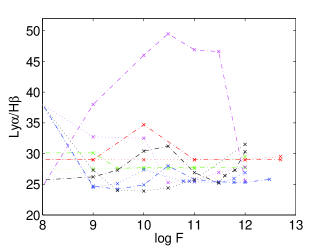
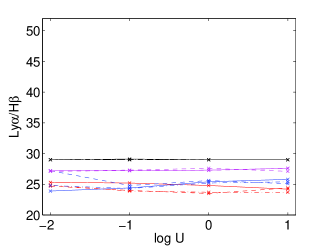
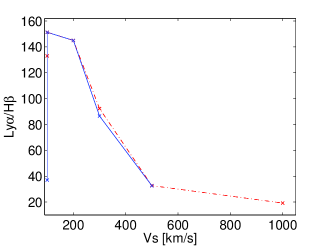
The physical parameters are combined throughout the calculation of forbidden and permitted lines emitted from a shocked nebula. The ranges of the physical conditions in the gas are deduced, as a first guess, from the observed line ratios because they are more constraining than the continuum SED. We make use of the grids presented by Contini & Viegas (2001a,b) for AGN (GRID1) and SB (GRID2), respectively for a first estimate of the gas physical conditions. The grids were calculated by a gradual increase of the input parameters adapted from the observed issues. Grid results give a rough approximation to the observed spectra. Diagnostic diagrams for Ly /H calculated by the code SUMA for ejected clouds (Fig. 1) show that radiation dominated models (+shocks) lead to Ly /H between 20 and 30, with some higher values (up to 50) for low velocity, high density extended clouds. For shock dominated clouds Ly /H ranges between 150 and 15.
The parameters are then refined by the detailed modelling of the spectrum. Specific grids of models are calculated for each galaxy modifying the parameters on small scales in order to reproduce as close as possible all the observed line ratios in each spectrum. We generally consider that the observed spectrum is ”satisfactorily” fitted by a model when the strongest lines are reproduced by the calculation within 20% and the weak ones within 50%. ”Satisfactorily” means that the approximation can be accepted 1) in the context of limits set by the author community, 2) considering the ensemble of all the line fit, 3) within the limits of the observational error, 4) if it can be improved only adopting unsuitable gas conditions, and 5) because, nevertheless, adding some information.
The final gap between observed and calculated line ratios is due to the observational errors both random and systematic, as well as to the uncertainties of the atomic parameters adopted by the code, such as recombination coefficients, collision strengths etc., which are continuously updated, and to the choice of the model itself.
The observed spectra provide averages throughout the whole galaxy, particularly at high redshifts. When the observed line ensemble is not satisfactorily reproduced by one model, the contribution of other regions within the galaxy at different physical conditions must be accounted for, leading to pluri-cloud models. The different results are summed up by relative weights (see, e.g. Rodriguez-Ardila et al. 2005) when they compensate each other (e.g. in Table 2). When they show similar results they are left as alternative proposals (e.g. Table 3).
The models selected by the fit of the line spectrum are cross-checked by fitting the continuum SED. In the UV range the bremsstrahlung from the nebula is blended with black body emission from the star population background. The maximum frequency of the bremsstrahlung peak in the UV - X-ray domain depends on the shock velocity. In the IR range dust reprocessed radiation is generally seen (Contini, Viegas & Prieto 2004). In the radio range synchrotron radiation by the Fermi mechanism at the shock front is easily recognized by the slope of the SED.
The set of the input parameters which leads to the best fit of the observed line ratios determines the physical and chemical properties of the emitting gas. They are considered as the ”results” of modelling.
| HDF1 | FWHM2 | MDS | CX03 | FWHM2 | MSS | MSR | BX4184 | FWHM | ME1-0 | ME2-0 | ME3 | MESB | |
| z | 2.011 | 3.288 | 2.3 | ||||||||||
| SFR (M⊙ yr-1) | 4.73 | 18.75 | 17.5 | ||||||||||
| OVI 1035 | - | - | 44.4 | 1.5: | 2640 | 12.8 | 0.25 | - | - | - | - | - | - |
| OV 1215 | - | - | 2.4 | - | - | - | - | - | - | - | - | - | - |
| Ly 1216 | 1.68 | 1270 | 1.5 | 18.9 | 1520 | 29.9 | 35. | 11.27 | 840 | 35. | 34.5 | 29.6 | 26.6 |
| NV 1240 | 2.3 | 2100 | 2.2 | 0.6: | 1820 | 0.65 | 0.16 | - | - | - | - | - | - |
| SiIV+OIV 1403 | - | - | - | 0.4 | 1320 | 0.3+0.86 | 0.22 | - | - | - | - | - | - |
| CIV 1549+ | 2.47 | 1300 | 2.2 | 3.5 | 1350 | 3.5 | 3.4 | - | - | - | - | - | - |
| HeII 1640 | 0.45 | 1400 | 1.0 | 1.7 | 940 | 2. | 3.0 | 0.31 | 612 | 0.3 | 0.31 | 0.89 | 0.003 |
| OIII]1667 | - | - | - | 0.9 | 1290 | 0.3 | 0.4 | 0.23 | 235 | 0.033 | 0.06 | 0.14 | 0.02 |
| CIII] 1909 | 0.19 | 900 | 0.3 | 2.1 | 1090 | 2. | 1.9 | 0.54 | 225 | 0.16 | 0.27 | 0.88 | 0.2 |
| NeIV] 2424 | 0.3 | 1470 | 0.20 | - | - | - | - | - | - | - | - | - | - |
| [OII] 3727 | - | - | - | 0.73 | -225 | 0.045 | 0.09 | 0.65 | 0.66 | ||||
| H 4861 | - | - | 0.1 | 1.2 | 170 | 1 | 1 | 1 | 102 | 1 | 1 | 1 | 1 |
| [OIII] 5007+ | - | - | 0.7 | 18.1 | 300-430 | 2.7 | 17.1 | 8.5 | 140 | 0.2 | 0.49 | 8. | 8.88 |
| [NII] 6584+6548 | 0.96 | 380 | 0.02 | - | - | - | 2.74 | 0.12 | - | 0.28 | 0.48 | 0.2 | 0.22 |
| H n | 0.7 | 240 | - | - | - | - | 3. | 3.08 | 155 | 3. | 2.9 | 3.3 | 3. |
| H b | 2.3 | 2500 | 0.278 | - | - | 2.7 | - | - | - | - | - | - | - |
| () | - | - | 1300 | - | - | 1500 | 200 | - | - | 840 | 600 | 260 | 260 |
| () | - | - | 300 | - | - | 110 | 350 | - | - | 3000 | 3000 | 200 | 200 |
| F 5 | - | - | 0 | - | - | - | 100 | - | - | 50 | 50 | 30 | - |
| 6 | - | - | 2.5 | - | - | - | - | - | - | - | - | 6. | |
| U | - | - | 8 | - | - | - | - | - | - | - | - | 0.7 | |
| (1016cm) | - | - | 9.0 | - | - | 41.5 | 100 | - | - | 3.6 | 2. | 400 | 400 |
| C/H 7 | - | - | 2.6 | - | - | 3.3 | 3.3 | - | - | 3.3 | 3.3 | 3.3 | 3.3 |
| N/H 7 | - | - | 1. | - | - | 0.4 | 0.1 | - | - | 0.3 | 1.0 | 0.3 | 0.3 |
| O/H 7 | - | - | 6.6 | - | - | 3.6 | 6.6 | - | - | 6.6 | 6.6 | 6.6 | 6.6 |
| H calc8 | - | - | 0.0085 | - - | - | 0.035 | 1.77 | - | - | 10.8 | 4.5 | 1.65 | 0.91 |
1 HDFx28 (Dawson et al 2003) in 10-17 ; 2 in ; 3 CXO J084837.9+445352 (Stern et al 2002) in 10-17 ; 4 BX418 (Erb et al 2010) in 2.6 10-17 ; 5 in 1010 photons cm-2 s-1 eV-1 at the Lyman limit ; 6 in 104 K 7 in 10-4 ; 8 in ;
| Flux1 | 4C+03.24 | MV1 | 0943-242 | MV2 | MV3 | 0731+438 | MV4 | MV5 | av | 4C-00.64 | MV6 |
|---|---|---|---|---|---|---|---|---|---|---|---|
| z | 3.560 | 2.922 | 2.429 | 2.360 | |||||||
| SFR2 | 192.3 | 100.6 | 128.6 | 73.27 | |||||||
| OVI | - | - | 5.6 | 4.3 | 9.5 | - | - | - | - | - | - |
| OV | 4.80.8 | 7.3 | - | - | - | - | + | - | - | - | - |
| Ly | 254.47.3 | 237. | 213.81.8 | 240. | 263. | 428.12.2 | 426. | 455. | 445. | 261.63.4 | 233. |
| NV | 4.80.8 | 5.2 | 11.20.6 | 4.4 | 14.2 | 7.10.6 | 8.0 | 7.7 | 7.8 | 12.41.2 | 15.3 |
| CII | 4.61.3 | 1.6 | 2.4 | 0.7 | 2.2 | 2.2 | 1.4 | 0.7 | 0.94 | 1.1 | 1.4 |
| OIV+SiIV | 6.12.5 | 5.0 | 8.9 | 9.1 | 16. | 9.7 | 13.0 | 3.9 | 7.0 | 10.4 | 14. |
| NIV] | - | - | 2.4 | 4. | 6.8 | 1.80.3 | 3.0 | 2.5 | 2.67 | - | - |
| SiII | - | - | 1.2 | - | - | 0.9 | - | - | - | - | - |
| CIV | 12.52.2 | 10.5 | 46.51.1 | 55.2 | 40. | 46.51.0 | 17. | 47.3 | 36.9 | 29.12 | 30.07 |
| [NeV] | - | - | - | 0.4 | 0.62 | - | - | - | - | - | - |
| HeII | 5.21.3 | 6.0 | 47.11.3 | 71.8 | 22.8 | 30.40.5 | 23. | 19.6 | 20.8 | 21.50.5 | 11.2 |
| OIII] | - | - | 7.6 | 4. | 6. | 6.4 | 1.7 | 2.4 | 2.16 | 3.6 | 4. |
| NIII] | - | - | 1.4 | 2. | 2.9 | - | 0.5 | 1.2 | 0.96 | - | - |
| SiII | - | - | 1.7 | - | - | 1.4 | - | - | - | - | - |
| SiIII] | - | - | 5.4 | 1.4 | 1.6 | 2.7 | 0.1 | 1.1 | 0.8 | - | - |
| CIII] | - | - | 29.33.1 | 24. | 14. | 21.20.5 | 1.4 | 24.8 | 16.9 | 9.60.7 | 11.7 |
| H | 30.5 | - | 25.66 | - | - | 51.36 | - | - | - | 31.4 | - |
| 3 | - | 130 | - | 100 | 130 | - | 140 | 140 | - | - | 120 |
| 4 | - | 60 | - | 100 | 150 | - | 150 | 130 | - | - | 60 |
| F 5 | - | - | - | 2.5 | - | - | - | 6. | - | - | - |
| 6 | - | 4.55 | - | - | 6 | - | 5 | - | - | - | 4.5 |
| U | - | 0.7 | - | - | 0.15 | - | 0.9 | - | - | - | 0.7 |
| 7 | - | 0.013 | - | 0.01 | 0.0008 | - | 0.001 | 0.1 | - | - | 0.01 |
| C/H 8 | - | 3.3 | - | 3.3 | 3.3 | - | 3.3 | 3.3 | - | - | 3.3 |
| N/H 8 | - | 1. | - | 1. | 1. | - | 1. | 1. | - | - | 1. |
| O/H 8 | - | 6.6 | - | 6.6 | 6.6 | - | 6.6 | 6.6 | - | - | 6.6 |
| H 9 | - | 0.009 | - | 0.012 | 0.009 | - | 0.014 | 0.13 | - | - | 2.6e-4 |
| w | - | - | - | - | - | - | 0.97 | 0.03 | - | - | - |
1 in 10-17 ; 2 in M⊙ yr-1; 3 in ; 4 in ; 5 in 1010 photons cm-2 s-1 eV-1 at the Lyman limit; 6 in 104 K; 7 in 1017 cm; 8 in 10-4 units; 9 calculated in
3 Modelling single galaxy spectra
| flux | SST241 | MDR | MDOS | MDSB | av | CDF-S2022 | FWHM3 | MNR | MNS | Lynx4 | MF0 | MFSB |
|---|---|---|---|---|---|---|---|---|---|---|---|---|
| z | 2.656 | 3.7 | 3.36 | |||||||||
| SFR (M⊙ yr-1) | 134.6 | 136.2 | 177.8 | |||||||||
| Ly 1216 | 28.90.15 | - | - | - | - | - | - | - | - | - | - | - |
| Ly 1216 | 4.050.01 | - | - | - | - | - | - | - | - | - | - | - |
| Ly 1216 | 3.100.01 | 3.03 | 3.3 | 4.9 | 3.39 | 16.4 | 1130 | 28. | 22.6 | 10.8 | 31.8 | 38. |
| NV 1240 | 0.05 | 0.017 | 0.03 | 0.1 | 0.03 | 5.9 | 1680 | 0. | 8.75 | 0.09 | 0.3 | 0.001 |
| SiIV 1397 | - | - | - | - | - | - | - | - | - | 0.09 | 0.09 | - |
| NIV] 1483+ | - | - | - | - | - | - | - | - | - | 0.42 | 0.15 | 0.05 |
| CIV 1549+ | 0.4170.001 | 0.6 | 0.47 | 0.4 | 0.49 | 9.9 | 1680 | 3.19 | 12.2 | 3.65 | 3.6 | 0.46 |
| HeII 1640 | 0.40.004 | 0.82 | 0.39 | 0.3 | 0.45 | 2.8 | 680 | 0.7 | 6.48 | 0.11 | 0.11 | 0.12 |
| OIII] 1661+ | - | - | - | - | - | - | - | - | - | 0.56 | 0.48 | 0.09 |
| NIII] 1750 | - | - | - | - | - | - | - | - | - | 0.18 | 0.1 | 0.12 |
| SiIII] 1883+ | - | - | - | - | - | - | - | - | - | 0.15 | 0.14 | 0.06 |
| CIII] 1909 | 0.050.01 | 0.0013 | 0.18 | 0.03 | 0.13 | - | - | 12.8 | 4.8 | 0.59 | 1.4 | 1.0 |
| [OII] 3727+ | - | - | - | - | - | - | - | - | - | 0.25 | 0.17 | 0.57 |
| [NeIII] 3869+ | - | - | - | - | - | - | - | - | - | 0.91 | 0.2 | 1.16 |
| HeII 4686 | - | - | - | - | - | - | - | - | - | 0.22 | 0.01 | 0.02 |
| H | - | 0.1 | 0.1 | 0.1 | 0.1 | 1 | - | 1 | 1 | 1 | 1. | 1 |
| [OIII] 5007+ | - | - | - | - | - | - | - | - | - | 10.1 | 0.7 | 9. |
| 5084 | 0.520.004 | - | - | - | - | - | - | - | - | - | - | - |
| H 6563 | 0.371 | 0.3 | 0.3 | 0.3 | 0.3 | 1.97 | - | 3. | 3. | - | 3.7 | 3.1 |
| () | - | 1700 | 1700 | 300 | - | - | - | 1600 | 1600 | - | 320 | 100 |
| () | - | 110 | 110 | 150 | - | - | - | 120 | 120 | - | 2000 | 300 |
| F 5 | - | 100 | - | - | - | - | - | 1 | - | - | - | - |
| 6 | - | - | - | 2.5 | - | - | - | - | - | - | - | 1.1 |
| U | - | - | - | 8 | - | - | - | - | - | - | - | 0.3 |
| (1017 cm) | - | 300 | 3. | 5. | - | - | - | 100 | 15 | - | 1 | 4900 |
| C/H 7 | - | 3.3 | 3.3 | 3.3 | - | - | - | 3.3 | 3.3 | - | 3.3 | 3.3 |
| N/H 7 | - | 1. | 0.1 | 1. | - | - | - | 1. | 1. | - | 0.2 | 1.0 |
| O/H 7 | - | 6.6 | 6.6 | 6.6 | - | - | - | 6.6 | 6.6 | - | 6.6 | 3.6 |
| H calc8 | - | 0.0336 | 0.024 | 5.68 | - | - | - | 200. | 0.0085 | - | 0.15 | 8.7 |
| w | - | 0.137 | 0.822 | 0.041 | - | - | - | - | - | - | - | - |
1 10-16 (Dey et al.); 2 10-16 ; (Norman et al (2002); 3 in ; 4 in 10-17 (Fosbury et al 2003); 5 in 1010 photons cm-2 s-1 eV-1 at the Lyman limit; 6 in 105 K 7 in 10-4 units; 8 in
3.1 Spectra of the radio galaxies at z 2.5 from the Humphrey et al (2008) survey
The long-slit NIR spectra obtained by the Infrared Spectrometer And Array Camera (ISAAC) instrument at VLT and completed with optical lines (by Keck and Subaru) contain a collection of lines in the wavelength range 1200-7000 Å. The observed Ly /H line ratios bridge between UV and optical data. Humphrey et al, modelling the spectra by pure radiation and pure shock models, concluded that the galaxies are most probably AGN in different physical conditions, with roughly solar abundances. We have selected dereddened (H /H 3) spectra of galaxies containing the H flux in order to compare the Ly /H line ratios (calculated at the nebula) with the observation data. We wish to investigate whether an SB contributes to some of the observed line ratios.
We consider all the line ratios in each spectrum (Tables 2 and 3), trying to reproduce them by models which account for the coupled effect of photoionization and shocks. The models are described in the bottom of the tables. Models corresponding to =0 are shock dominated, i.e. the photoionising flux from the source outside the emitting nebula is hidden or absent. Similar shock dominated models are used to model supernova remnant spectra. The FWHM of the line profiles gives a hint about the shock velocity. Different FWHM of the lines in the UV and in the optical range indicate that the spectra emitted from different clouds within the galaxy should be considered. So pluri-cloud models are adopted. The weighted sum of the line ratios calculated by different theoretical models for each spectrum (e.g. col. 7 and 11 in Table 2) is compared with the observed line ratios. The weights adopted to sum the models are reported in the bottom row of the table.
In Table 2 we show the modelling of galaxies 0211-122 and 0406-244. The line fluxes are referred to H =1 for 0211-122 and to H =1 for 0406-244, following the Humphrey et al. notation. The H flux is given as an upper limit for 0211-122. Considering that the calculated H /H line ratio is 3 and the lines are referred to H =1, H results 0.33, which is within the upper limit (0.5). Moreover, the spectrum is rich in lines from different elements in different ionization levels which can constrain the models. We focus on the [OII]3727+/[OIII]5007+ and CIV1549+/CIII]1909+/CII]2326+ line ratios (The + indicates that the doublet is summed) We could not find any model showing Ly /H as low as 0.2. By a shock dominated model with =2000 and =1300 it is possible to obtain Ly /H =7 (as for the 0406-244 galaxy) and even less. But in this case HeII 1640/H =9 and all the other line ratios =0 destroy the good fit obtained by the radiation dominated model. High FWHM are adapted to the AGN broad line-emission region (BLR) ( 1000 ) rather than to the narrow line-emission region (NLR). Forbidden lines such as [OII] 3727 are generally collisionally deexcited in the BLR due to the high density. Low Ly /H perhaps indicates strong absorption by dust in the nebula. The results presented in Table 2 show that the lines come from different clouds within the galaxy. The highest ionization level lines are stronger where collisional ionization dominates. HeII 1640, which is a recombination line, increases with both the temperature of the gas and the photoionization flux.
For 0211-122 we group the shock velocities into two prototypes. 1000 representing high velocity shocks fits the UV lines, while 500 reproduces the lines in the optical range. The results of selected models appear in cols. 4, 5 and 6. The weighted sum of the line fluxes appears in col. 7 of Table 2, Models MH1 and MH2 which refer to = 1000 and 500 , respectively, are shock dominated (SD, F=0), while model MH3 with =300 is radiation dominated (RD) +shock. Model MH2 is included because, overpredicting the CIV and [OII] 3727 lines, improves the approximation of the averaged spectrum. O/H is solar and N/H seems lower than solar by a factor of 3. We refer to the solar abundances by Allen (1976). They are discussed by Contini (2014a). The average model overpredicts the OIV]/H , NIV]/H and CIII]/H multiplet ratios to H because the calculations account for the sum of all the multiplet terms. We do not know which terms are included in the observation data. Different geometrical thickness of the clouds indicate fragmentation by shock in a turbulent regime. The 0406-244 spectrum is satisfactorily reproduced by the weighted sum (av in column 11) of models MH4, dominated by the AGN radiation, and MH5, dominated by the shock. The relative weights were calculated phenomenologically in order to obtain the best approximation to the spectrum, even if some line ratios (e.g. [NeV]) are less fitted. Also for this galaxy a SD model (MH5) corresponds to the highest (700 ). More spectra of selected galaxies from the Humphrey et al sample are shown and modelled in Table 3.
The FWHM of the line profiles range between 600 and 900 . They are not reported in the table for sake of space. In Table 3 we refer all the spectra to H =1 in order to easily compare observed line ratios to model results from different galaxies. The spectrum presented for 0529-549 in Table 3 shows a few line ratios. Most are upper limits. Both [OIII] 5007+/H line ratios calculated by high and low models reproduce satisfactorily the data. [NII]/H and [SII]/H depend strongly on the N/H and S/H relative abundances, respectively. So, an averaged model is not significant. The modelling of 0828 suggests that carbon should be depleted by a factor of 5 from the gaseous phase, most probably trapped into grains throughout the nebula represented by model MH8. Neon cannot be included into dust grains because of its atomic structure, then we determine the relative weights of the averaged model av by fitting the [NeV]/H line ratio. Model av (col. 8) shows that, in contrast to our previous hypothesis, C/H solar is suitable to the high velocity gas component of 0838. The observed lines of 1138-262 are few and the oxygen lines are well approximated by both the AGN and SB dominated models, therefore the relative weights in an eventual average spectrum are less constrained. Galaxy 4C+23.56 spectrum shows a non negligible [NeV], while model MH13 yields [NeV]=0, therefore the SB dominated model MH12 is more appropriated.
The main conclusions by Humphrey et al. are in agreement with our modelling. Namely, 1) AGN photoionization with U varying between the objects is generally indicated. However, we find an SB contribution to 1138-262 and 4C+23.56 spectra; 2) single-slab photoionization models are unable to reproduce satisfactorily the high and low ionization lines simultaneusly; 3) shocks alone do not provide a valid explanation but must be added to a photoionization source; 4) N/H is nearly solar for all objects and does not vary as much as by a factor of 2-3; 5) The line FWHM and the ionization state are the result of interaction between the clouds in terms of shocks, when the radiation from the AGN or the SB is absent.
3.2 HDFX 28, a spiral galaxy at z=2.011 from the observations of Dawson et al. (2003)
In search for type 2 QSRs, HDFX 28 was identified as a face-on spiral galaxy at z=2.011. Initially, it was considered as an extended radio source powered by star formation (Richards 2000), but the hard X-ray source and the spectroscopy demonstrated that this galaxy contains an obscured type 2 AGN (Dawson et al and references therein). The galaxy was observed by ISOCAM and Chandra. Table 4 shows that a SB dominated model (MDS) roughly reproduces the data. Dawson et al spectrum contains too few narrow lines, [NII] 6548, 6548 and H to provide a consistent modelling of the low gas. On the basis of [NII] 6548+6584/H , we can predict that, if the reddening is negligible and H /H =3, [NII]/H = 4.11, which indicates for a SB model U0.1, =1-4 104K, =220 , =200 , =1019 cm and solar abundances. For an AGN model, such line ratios can be obtained with N/H solar, =100-250 and 109 photons cm-2 s-1 eV-1 at the Lyman limit , and for =500 and 1010 photons cm-2 s-1 eV-1 at the Lyman limit. Such [NII]/H can be also obtained by a SD (=0) model with =300 The preshock densities are 100-300 and the geometrical thickness of the emitting clouds are between 1017 and 1019 cm. In conclusion, the [NII]/H line ratio alone cannot constrain the narrow line model.
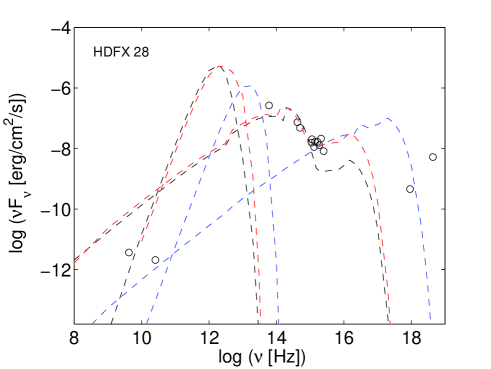
In Fig. 2 we present the modelling of the continuum SED. The data are given by Dawson et al 2003, table 1). The continuum SED calculated by the code SUMA shows two curves for each model. One represents the bremsstrahlung from the gas and the second one, in the IR, represents reprocessed radiation from dust. The data in the radio - UV - soft-X-ray range are well fitted by the high , SB dominated model MDS. Harder X-ray data in Fig. 2 could be reproduced by a model calculated by a shock velocity even higher than 1500 , as suggested by the FWHM of some line profiles. The AGN and the SB dominated models calculated by =220 , which were predicted on the basis of the [NII]/H line ratio, reproduce the data in the optical range, in agreement with the H narrow line FWHM. The modelling of the HDF galaxy continuum SED constrains the choice of the low velocity model, but it cannot select between an AGN or a SB.
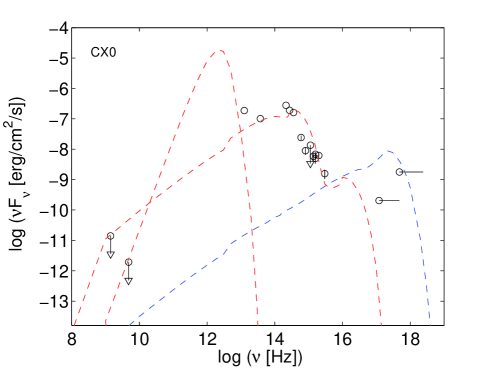
3.3 Spectrum from CXO 52 by Stern et al. (2002) observations
CXO 52 was identified as an optical, colour selected, high redshift source (Stern et al 2002c) and by optical follow up of X-ray sources in the Lynx field (e.g. Stanford et al 1997) . Stern et al (2002) report on observations of a type 2 quasar at z=3.288 that was identified as a hard X-ray source by Chandra X-ray observatory. The optical spectrum of CXO 52 was obtained by Keck I telescope. Line profile FWHM are broad ( 1000 ). A shock dominated model with =1500 and pre-shock density =110 , resembling those found in other galaxies at similar redshifts, fits most of the UV lines (MSS Table 4). The Ly /H is overpredicted by a factor of 1.6. OVI1035/H is underpredicted and NV 1240/H is well reproduced. The maximum temperature of the gas downstream, near the shock-front depends on the shock velocity (Sect. 2) therefore, MSS model fits NV/H because NV is a high ionization level line. OVI which shows a FWHM =2640 cannot be well reproduced by model MSS.
The H and the forbidden lines [OIII]5007+ correspond to lower FWHM (170-430 ). The lines are emitted from clouds within the galaxy with different . A radiation dominated model (MSR) with =200 and =350 reproduces the UV lines (except OVI and NV) within a factor of 2 and explains the high [OIII]5007+4959/H . The flux from the AGN corresponds to a Seyfert 2. The results of the two models are not summed up because they show very different gas conditions in (most probably) well separated regions throughout the galaxy.
To cross check the models we compare the bremsstrahlung calculated by models MSS and MSR with the data presented by Stern et al (in their table 1) in Fig. 3. The datum at 2-10 keV is well reproduced by model MSS, calculated by a high shock velocity. The bremsstrahlung maximum depends on the maximum temperature of the gas downstream. Dust grains can be completely destroyed by sputtering at high shock velocities ( 1000 ). The grains in the nebulae represented by models MDS and MSS are characterised by a relatively large initial radius (agr=1 m ) in order to survive to strong sputtering throughout a high velocity shock-front. However, they can be completely destroyed by sputtering and evaporation, as happens for model MSS, depending on the cooling rate downstream. The relatively low which characterises the gas conditions in model MSR yields grain survival. The bremsstrahlung calculated by model MSR, which corresponds to gas ionised and heated by the flux from the AGN (+shocks), roughly fits the data in the UV-optical and radio ranges. The reprocessed radiation by dust in the IR is constrained by only one datum which leads to = 10-4 by mass.
3.4 The spectrum observed from Q2343-BX418 by Erb et al (2010)
In column 9 of Table 4 we present the observed line ratios for BX418 galaxy at z=2.3, defined by Erb et al., as ”one of the youngest and lowest stellar mass continuum-selected z2 galaxies”.
The spectral lines show different FWHM for different wavelengths decreasing from 840 for Ly to 640 for HeII 1640, down to 260 for lines in the optical-near-UV range (Table 4, col 10). The observations show that different components contribute to different lines. Although permitted line fluxes (e.g. Ly and HeII) depend strongly on the photoionizing radiation reaching the nebula, they also increase with the temperature of the emitting gas (see Sect. 3.8). Therefore, models accounting for shock+ photoionization are used. The models are presented in Table 4. We first investigate whether an AGN (hidden?) is present. The high Ly and HeII 1640 FWHM suggest shock velocities of 850 and 600, respectively. They are accompanied by a AGN flux characteristic of Seyfert 2 galaxies. The densities are high throughout the nebula to reduce the primary and secondary fluxes rapidly enough. The temperature drop will lead to very low line intensities in the optical range. Actually, broad optical lines were not observed. We could not obtain acceptable results with models corresponding to outflow of the gas, on the contrary, gas inflow towards the AGN is indicated (models ME1-0 and ME2-0). We reproduced the near UV and optical line ratios by models corresponding to the NLR conditions. Models ME3 and MESB roughly fit the [OII]/H and [OIII]/Hb line ratios. ME3 refers to an AGN, while MESB refers to a SB radiation source. Both shows outlow of gas from the galaxy and are similar to those found in other galaxies at those redshifts. We suggest that all the gas conditions represented by the models in Table 4 are present within BX418, contributing to the single lines in the spectrum. The models are not summed up, in order to show each contribution to each line. BX418 has been placed among metal-poor galaxies (Erb et al). However, the low metallicity (0.05 solar) was calculated by Erb et al by the strong-line metallicity diagnostic as well as by the direct methods. They found 12+log(O/H)=7.90.2, while the results of detailed modelling yield solar 12+log(O/H)=8.812. The discrepancy between metallicities calculated by direct methods and modelling has been discussed by Contini (2014b).
3.5 Spectra by Vernet et al (2000) at z 2.5 and the diagrams
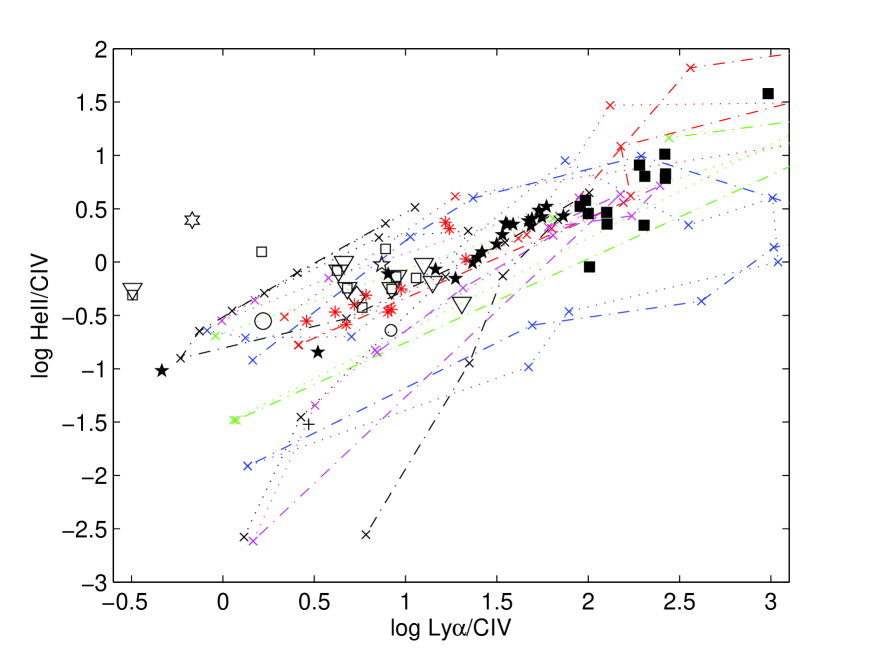
Vernet et al (2001) present spectropolarimetry of powerful extragalactic radio sources at z2.5 by Keck II telescope, ”when quasars were much more common than now”. Although dust-reflected quasar light dominates the UV continuum, they did not exclude star formation. Vernet et al. comparing the data throughout the NV/HeII vs NV/CIV diagrams by Hamann & Ferland (1993) could not easily explain the observed NV/CIV and NV/HeII line ratios. In Sect. 4 we will discuss Vernet et al and other survey observations throughout the HeII/CIV vs Ly /CIV diagrams, where the data are compared with model results calculated by SUMA. UV line ratios are generally referred to CIV which is one of the strongest lines. Moreover, we have found that the N/H relative abundances throughout galaxies are scattered by a factor of 10 (Contini 2014a, fig. 5), therefore we suggest that NV lines are less adapted to diagnostic diagrams.
We present in Table 5 the results of shock+photoionization models for some of the Vernet et al spectra. 4C+40.36 and 4C+48.48 were excluded because the spectra are most probably blended by a foreground HII galaxy at z=0.404 and at z=0.684, respectively. The modelling results indicate that composite models referring to the SB+shocks, to the AGN+shocks should be adopted and that different physical conditions from different regions contribute to the spectra. All the models used to reproduce Vernet et al data in Table 5 show relatively low and , which are reflected in low SFR. Vernet et al found a SFR range between 60 M⊙ yr-1to 2 M⊙ yr-1. They claim that in 0731+438 the only object where reprocessed radiation from AGN does not dominate the continuum (for the other objects starlight conributes less than half of the UV continuum, see Vernet et al 2001, table 5) and assuming E(B-V)=0.1 and a stellar population age of 109 yr, Vernet et al calculate SFR between 30 and 120 M⊙ yr-1. Our calculations give SFR 128 M⊙ yr-1for 0731+438, a minimum SFR 24.4 for 4C+23.56a, etc. (see Table 5)
3.6 Line and continuum observations of an extended nebula by Dey et al. (2005)
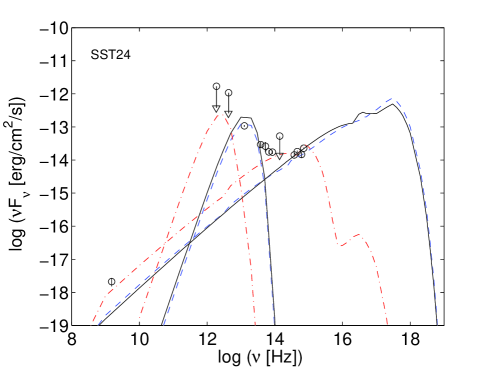
Massive ellipticals at high z (3) are surrounded by large (100-200 kpc) luminous (1043 erg s-1 ) Ly nebulae and small embedded star forming objects. Investigating (100 kpc) halos and environments of luminous radio galaxies affected by AGNs and ejecta of similarly large Ly nebulae, Dey et al (2005) reported on observations of a very large, spatially extended (160 kpc) Ly emitting nebula at z=2.656. Spectroscopic observations of SST24 J1434110+331733 were obtained by the Low Resolution Imaging Spectrometer (LRIS) on the Keck I telescope.
The spectroscopic observations reveal very complex regions within the extended nebula, including several continuum sources. Dey et al suggest that many active galaxies are forming in that region which lead to three main contributions to the continuum spectrum. Galaxy A shows interstellar absorption lines and no Ly emission; the spectrum of the second continuum source is quite red and shows weak CIV and CIII] emission at z=2.656. Star formation is suggested because the source is close to MIPS 24 m location. The third continuum source lies in the centre of the Ly nebula associated to CIV and HeII. The velocity structure of the nebula deduced from the line profiles shows that the velocity varies uniformly across the central region. If due to gas kinematics, the variation can be due to infall, outflow, or rotation.
We refer to the line and continuum observations by Dey et al. The results of modelling are presented in Table 6. On the basis of the observed lines corresponding to broad profiles, we have run models with 1000 . We find a large contributions to the line fluxes from high velocity ( =1700 ) shock dominated gas (models MDOS) and photoionized by an AGN (model MDR). Moreover, the contribution from gas with =300 and photoionised by a SB is evident (MDSB). The high velocities are at the limit of those observed in AGN NLR. The AGN flux is characteristic of Seyfert 2. The starburst temperature which leads to a satisfactory fit of the line ratios (2.5 105 K) is as high as that found in galaxies showing activity (Contini 2014b). Also the ionization parameter is high. The gas throughout the SB shows ”normal physical conditions” in the emitting nebulae of galaxies at such redshifts. However, to have a good fit of the NV 1240 line, we have adopted N/H lower than solar by a factor of 10 in the shock dominated gas. This indicates that it is located in a different region of the galaxy. The weighted sum of the calculated spectra (av) appears in Table 6 col. 6. We suggest that the 5084 line refers to scandium (4F3/2-4F , White 1934, fig.14.7). Scandium can be present is SN ejecta (e.g. Bose et al. 2015).
Fig. 4 shows that the continuum SED calculated by the models selected by fitting the line ratios reproduce the observed continuum data presented by Dey et al. (2005, fig.2). Bremsstrahlung from gas heated by the strong shock shows a maximum at high frequency (Contini, Viegas, Prieto 2004). X-ray emission is predicted. The mass of the emitting gas (6 1012 M⊙ ) was calculated by Dey et al. The mass of dust can be calculated by = 0.003 by mass which results from the fit of the continuum SED in the IR.
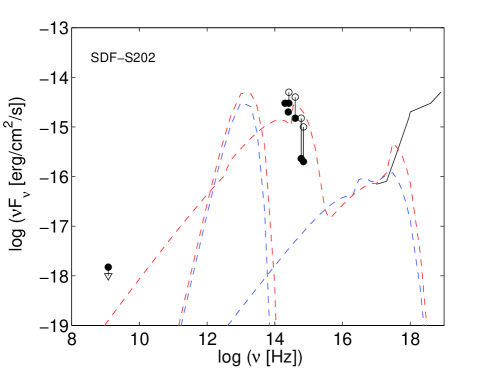
3.7 A classic type 2 QSO at z=3.7 : CDF-S202 observations by Norman et al (2002)
Norman et al observed the AGN detected at z=3.7 by the Chandra Deep Field-South 1 Ms exposure. It is a distant type 2 AGN with UV showing FWHM of 1500 . The optical spectrum was obtained with the multislit mode on the FORS1 on the ESO/VLT-ANTU. Detailed modelling (Table 6, cols. 9, 10) indicates that a shock dominated model (MNS) best fits the lines within a maximum discrepancy factor of 2.3 for HeII 1640 (Table 6 last column). This model calculated by =1600 would provide OVI 1035/H 200. Norman et al found a high metallicity, while we suggest N/H by a factor of 1.5 lower than solar and C/H about solar, considering the uncertainty of the line fluxes. Referring the line to CIV=10 instead of H , as it is generally done for UV spectra, we would obtain an acceptable fit of all the lines. The radiation (AGN+shock) dominated model (MNR) calculated by the high reproduces the line ratios roughly. In Fig. 5 we present the modelling of the continuum SED. The data were adapted from Norman et al. fig. 6. The continuum calculated by the radiation (+shock) dominated model MNR reproduces the data in the optical- UV better than the shock dominated model MNS, so the MNR model should be accounted for, but with a low relative weight.
| ID | z | SFR | Ly | % | NV | CIV | HeII | [OII] | [OIII] | H | [NII] |
|---|---|---|---|---|---|---|---|---|---|---|---|
| M⊙ yr-1 | 1215 | - | 1240 | 1550 | 1640 | 3727+ | 5007+ | 6563 | 6584 | ||
| EGS7 | 0.2440 | 0.4 | 17.53 | 15.9 | - | - | - | 2.14 | 5.65 | 3. | 0.134 |
| MSB7 | 24.3 | - | 0.0014 | 0.34 | 0.078 | 2.3 | 5.6 | 2.93 | 0.16 | ||
| MAG7 | 28.6 | - | 0.0009 | 0.15 | 1.22 | 2. | 6.4 | 3.3 | 0.18 | ||
| EGS8∗ | 0.2395 | 0.035 | 16.7 | 32.8 | - | - | - | 2.47 | 3.7 | 3. | 0.03 |
| MSB8 | 23.8 | - | 0.0024 | 0.28 | 0.0037 | 2. | 3.5 | 2.95 | 0.1 | ||
| MAG8 | 28.6 | - | 0.0005 | 0.14 | 0.89 | 2. | 3.46 | 3.34 | 0.1 | ||
| EGS10 | 0.2466 | 0.12 | 33.9 | 16.7 | - | - | - | 3.06 | 4.37 | 3. | 0.06 |
| MSB10 | 24.6 | - | 0.016 | 0.46 | 0.044 | 3.2 | 4.5 | 2.94 | 0.12 | ||
| MAG10 | 28. | - | 0.001 | 0.029 | 1.1 | 3.1 | 4.65 | 3.2 | 0.14 | ||
| EGS11 | 0.2524 | 0.059 | 41.1 | 35.3 | - | - | - | 2.78 | 1.53 | 3. | 0.84 |
| MSB11 | 24.5 | - | 0.1 | 0.3 | 0.0026 | 2.3 | 1.5 | 2.96 | 0.87 | ||
| MAG11 | 26.5 | - | 0.0027 | 0.1 | 0.67 | 2.5 | 1.57 | 3.3 | 0.9 | ||
| EGS12 | 0.2515 | 0.062 | 48.7 | 20.8 | - | - | - | 2.8 | 2.7 | 3. | 0.38 |
| MSB12 | 24.5 | - | 0.067 | 0.42 | 0.01 | 2.9 | 2.63 | 3. | 0.46 | ||
| MAG12 | 28. | - | 0.0027 | 0.28 | 0.8 | 2.5 | 2.8 | 3.3 | 0.37 | ||
| EGS13 | 0.2607 | 0.46 | 17.96 | 21. | - | - | - | 2.8 | 2.26 | 3. | 0.43 |
| MSB13 | 24.5 | - | 0.067 | 0.42 | 0.0092 | 2.9 | 2.45 | 2.95 | 0.47 | ||
| MAG13 | 31.54 | - | 0.017 | 0.25 | 0.73 | 3. | 2.35 | 3.3 | 0.46 | ||
| EGS19 | 0.2666 | 0.11 | 33.96 | 21.9 | - | - | - | 2.4 | 1.23 | 3. | 0.86 |
| MSB19 | 24.4 | - | 0.1 | 0.31 | 0.0046 | 2.36 | 1.3 | 3. | 0.86 | ||
| MAG19 | 26.4 | - | 0.0027 | 0.1 | 0.61 | 2.5 | 1.25 | 3. | 0.96 | ||
| EGS20∗ | 0.2680 | 0.073 | 11.57 | 27.2 | - | - | - | 3.04 | 4.2 | 2.9 | 0.137 |
| MSB20 | 24.3 | - | 0.024 | 0.46 | 0.015 | 2.96 | 4.12 | 2.93 | 0.14 | ||
| MAG20 | 28. | - | 0.001 | 0.29 | 1.1 | 3. | 4.5 | 3. | 0.14 | ||
| EGS21 | 0.2814 | 0.06 | 46.4 | 21.6 | - | - | - | 1.98 | 0.415 | 3. | 0.12-1.4 |
| MSB21 | 32. | - | 0.063 | 0.155 | 0.0015 | 2.2-1.8 | 0.47-0.4 | 3.3 | 0.13-1.2 | ||
| MAG21a | 30.5 | - | 0.002 | 0.3 | 0.27 | 1.8 | 0.45 | 3.46 | 1.5 | ||
| MAG21b | 28.3 | - | 0.0027 | 0.14 | 0.31 | 2.1 | 0.42 | 3.4 | 0.15 | ||
| EGS22 | 0.2828 | 0.12 | 242. | 35.9 | - | - | - | 3.17 | 0.74 | 3. | 0.14 |
| MSB22 | 25.5 | - | 0.023 | 0.9 | 0.011 | 3. | 0.75 | 2.96 | 0.13 | ||
| MAG22 | 27.9 | - | 0.002 | 0.22 | 0.5 | 3.2 | 0.72 | 3.3 | 0.12 | ||
| EGS23 | 0.2865 | 0.42 | 18.4 | 15.8 | - | - | - | 2.65 | 3.7 | 3. | 0.32 |
| MSB23 | 24.2 | - | 0.045 | 0.55 | 0.012 | 2.65 | 3.74 | 2.93 | 0.31 | ||
| MAG23 | 27.1 | - | 0.004 | 0.3 | 1.0 | 2.60 | 3.88 | 3.2 | 0.37 | ||
| EGS25 | 0.3243 | 1.06 | 6.5 | 16.6 | - | - | - | 1.76 | 5.94 | 3. | 0.16 |
| MSB25 | 24. | - | 0.04 | 0.68 | 0.023 | 1.8 | 6.2 | 2.93 | 0.15 | ||
| MAG25 | 28.9 | - | 0.0005 | 0.11 | 1.13 | 1.8 | 5.95 | 3.3 | 0.14 |
∗ not Balmer corrected because the observed H /H 3.
3.8 Spectrum of the Lynx arc at z=3.357 by Fosbury et al (2003)
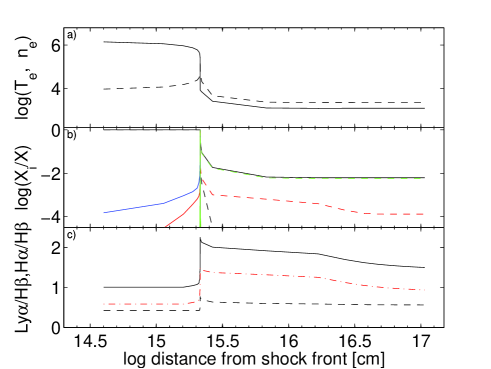
The Lynx arc (z=3.357)is characterised by a very red R-K colour and strong, narrow emission lines. Fosbury et al claim that analysis by HST WFPC2 imaging and Keck optical and IR spectroscopy indicate a HII galaxy magnified by a factor of 10 by a cluster environment including stars with 106K, 1 and low metallicity (0.05 solar). In Table 6, col 11 the observed spectrum of the Lynx arc presented by Fosbury et al (2003, table 2) is reported. The spectrum shows a relatively large number of line ratios including [OII]/H and [OIII]/H in the optical range, reproduced by Fosbury et al by a pure photoionization model with =8 104 K log=-1 and Z=0.05Z⊙, which was suggested by comparison with synthetic SEDs calculated by STARBURST99 (Leitherer et al 1999). The FWHM of the profiles are 100 for lines in the optical and higher for those in the UV. We searched by modelling the spectrum for a (hidden) AGN, but AGN dominated models lead to HeII/H 1, higher by a factor 10 than observed. The shock dominated model MF0 (Table 6, col. 12) calculated by a relatively high shock velocity (320 ) and high preshock density (=2000 ) fits most of the UV line ratios but underpredicts [OIII] 5007+/H by a factor 10. A SB radiation dominated model MFSB, calculated by =1.1 105K, =0.3, =4.9 1020 cm, =100 , =300 and O/H 0.5 solar, reproduces satisfactorily most of the line ratios from relatively low ionization levels. Model MFSB which accounts for photoionization by a SB + shocks represents gas ejected outwards, while for model MF0 the direction of the emitting gas is ambiguous.
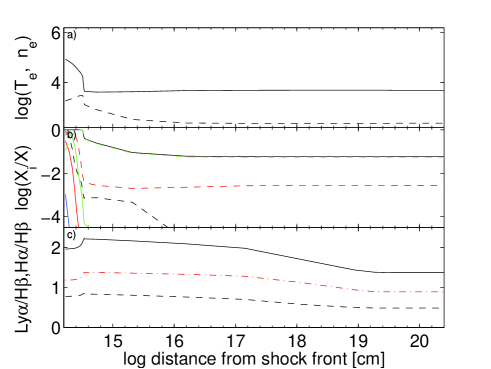
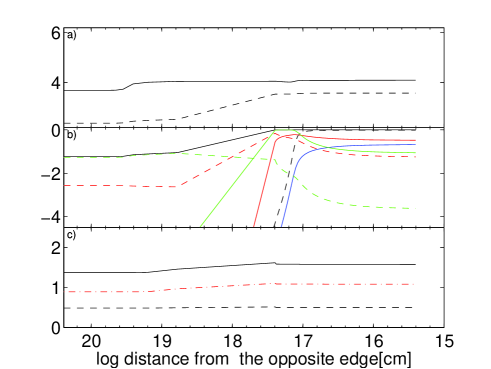
Finally, we show in Figs. 6 and 7 the profiles of the physical parameters throughout the emitting nebula for models MF0 and MFSB, respectively, in order to understand the results. In Figs. 6 and 7 the electron temperature and electron density appear in the top diagrams. In Fig. 7 the nebula is devided into two halves in order to obtain a comparable view at the two edges. Logarithmic symmetric scales are used for the X-axis. The shock front is on the left of the left panel and the right edge of the right panel is reached by the radiation flux from the SB. In the middle diagrams of Figs. 6 and 7 the fractional abundances of the ions corresponding to significant lines are shown. The bottom diagrams are dedicated to the Ly /H , H /H and Ly /H line ratios (in logarithm). Figs 6 and 7 show that Ly /H follows the H+ recombination trend. The two sides of the nebula (shock dominated at the left and radiation dominated at the right of Fig. 7) are bridged by diffuse secondary radiation. In fact, the temperature is 104K even in the extended internal region of the nebula. Most of the C, N, O lines come from the radiation dominated side of the nebula.
3.9 Finkelstein et al survey
Finkelstein et al (2011) present in their table 1 the measured line fluxes for a sample of galaxies at 0.24 z 0.324 by spectroscopy of LAE using the Hectospec spectrograph with the 6 m MMT telescope.
We report in Table 7 the results of modelling the observed line ratios and we add the UV lines NV, CIV and He II consistently calculated by the same models. These lines which are not observed by Finkelstein et al will be discussed in the following. In Table 7 the observed line ratios (EGS7-EGS25, corrected by H /H =3) are followed in the next rows by the results of SB models (MSB7-MSB25)) and AGN models (MAG7-MAG25)). The input parameters are reported in Tables 8 and 9).
Ly lines are calculated consistently with the other lines. Ly /H calculated line ratios (col. 3) reproduce the data within a factor of 2. In col. 4 the SFR are indicated for each galaxy. The percentage uncertainty appears in col. 5. The galaxies in the Finkelstein et al sample present rather homogeneous characteristics. The O/H relative abundances are at most solar while the N/H ratios are lower than solar by a factor 10. Densities and velocities are relatively low. The flux from the active nucleus is in the range of that found in low luminosity AGNs. The temperature of the stars does not show the maxima corresponding to outbursts (Contini 2014b). The geometrical thickness of the clouds shows that fragmentation is present in the SB neighbourhood rather than in AGNs.
| model | N/H | O/H | H | |||||
|---|---|---|---|---|---|---|---|---|
| 1 | 2 | 3 | 4 | 5 | 6 | 7 | 8 | |
| MSB7 | 100 | 100 | 6.4 | 0.02 | 0.1 | 5. | 9. | 0.02 |
| MSB8 | 100 | 100 | 4.2 | 0.03 | 0.2 | 6.6 | 3. | 0.0196 |
| MSB10 | 150 | 100 | 5.9 | 0.02 | 0.1 | 6.0 | 4. | 0.019 |
| MSB11 | 150 | 100 | 4. | 0.03 | 0.9 | 6.6 | 4. | 0.027 |
| MSB12 | 180 | 100 | 4.8 | 0.025 | 0.4 | 6.6 | 5. | 0.024 |
| MSB13 | 180 | 100 | 4.7 | 0.025 | 0.4 | 6.6 | 5. | 0.025 |
| MSB19 | 210 | 100 | 3.9 | 0.04 | 0.8 | 6.6 | 5. | 0.038 |
| MSB20 | 220 | 100 | 4.8 | 0.035 | 0.13 | 6.6 | 1. | 0.029 |
| MSB21 | 170 | 100 | 4. | 0.015 | 0.1 | 6.6 | 300 | 0.058 |
| MSB22 | 200 | 150 | 4.2 | 0.015 | 0.06 | 5.2 | 80 | 0.023 |
| MSB23 | 190 | 100 | 4.4 | 0.034 | 0.2 | 5.6 | 1. | 0.022 |
| MSB25 | 170 | 100 | 4.9 | 0.034 | 0.15 | 5. | 1. | 0.023 |
1:in ; 2:in ; 3:in 104K ; 4: - ; 5:in 10-4 ; 6:in 10-4 ; 7:in 1017 cm ; 8:in
| model | z | N/H | O/H | H | ||||
|---|---|---|---|---|---|---|---|---|
| 1 | 2 | 3 | 4 | 5 | 6 | 7 | ||
| MAG7 | 0.2440 | 100 | 150 | 7. | 0.2 | 5.6 | 3 | 0.066 |
| MAG8 | 0.2395 | 100 | 150 | 3. | 0.1 | 5.6 | 3 | 0.064 |
| MAG10 | 0.2466 | 100 | 150 | 3. | 0.1 | 6.6 | 3 | 0.029 |
| MAG11 | 0.2524 | 100 | 150 | 1.4 | 0.8 | 6.6 | 3 | 0.072 |
| MAG12 | 0.2515 | 100 | 150 | 2.5 | 0.3 | 6.0 | 1.4 | 0.03 |
| MAG13 | 0.2607 | 120 | 150 | 2.6 | 0.3 | 6.0 | 1.9 | 0.045 |
| MAG19 | 0.2666 | 100 | 150 | 1.2 | 0.8 | 6.6 | 3 | 0.072 |
| MAG20 | 0.2680 | 100 | 150 | 2.9 | 0.1 | 6.6 | 1 | 0.03 |
| MAG21a | 0.2814 | 100 | 150 | 0.77 | 0.2 | 6.6 | 1.6 | 0.026 |
| MAG21b | 0.2814 | 110 | 150 | 0.8 | 0.15 | 6.6 | 4 | 0.068 |
| MAG22 | 0.2828 | 110 | 150 | 0.86 | 0.08 | 6.0 | 4 | 0.045 |
| MAG23 | 0.2865 | 100 | 100 | 1.8 | 0.3 | 6.6 | 2 | 0.018 |
| MAG25 | 0.3243 | 100 | 150 | 6. | 0.15 | 5.8 | 4 | 0.086 |
1:in ; 2:in ; 3: in 109 photons cm-2 s -1 eV-1 at the Lyman limit ; 4:in 10-4; 5:in 10-4; 6:in 1019cm ; 7:in
3.10 Predicted Ly and UV lines from galaxies at 0.06z0.9
| ID | zspec | FWHM | [OII] | H | [OIII] | [OIII] | H | [NII] | log([OII]/H ) | log([OIII]5007+/H ) | log(R[OIII]) |
|---|---|---|---|---|---|---|---|---|---|---|---|
| 3727+ | 4861 | 4363 | 5007+ | 6563 | 6583 | - | - | - | |||
| MMT01 | 0.6380 | 220.0 | 10.58 | 9.21 | 2.25 | 73.32 | 0.00 | 0.00 | 0.184 | 0.886 | 1.462 |
| MMT02 | 0.4327 | 247.0 | 18.20 | 5.76 | 0.60 | 25.83 | 0.00 | 0.00 | 0.621 | 0.644 | 1.549 |
| MMT03 | 0.4809 | 256.4 | 20.40 | 5.81 | 0.95 | 12.23 | 0.00 | 0.00 | 0.735 | 0.339 | 1.086 |
| MMT04 | 0.3933 | 248.6 | 49.30 | 21.70 | 1.38 | 130.05 | 0.00 | 0.00 | 0.355 | 0.774 | 1.950 |
| MMT05 | 0.3846 | 232.1 | 3.70 | 7.02 | 1.29 | 57.92 | 0.00 | 0.00 | -0.266 | 0.921 | 1.659 |
| MMT06 | 0.3995 | 260.2 | 21.33 | 6.04 | 0.83 | 21.97 | 0.00 | 0.00 | 0.734 | 0.543 | 1.319 |
| MMT07 | 0.3896 | 238.0 | 19.84 | 20.84 | 2.25 | 153.87 | 0.00 | 0.00 | 0.102 | 0.872 | 1.777 |
| MMT08 | 0.6335 | 239.4 | 27.33 | 10.90 | 1.88 | 42.30 | 0.00 | 0.00 | 0.613 | 0.584 | 1.260 |
| MMT09 | 0.4788 | 235.2 | 16.74 | 6.82 | 1.49 | 39.48 | 0.00 | 0.00 | 0.585 | 0.762 | 1.338 |
| MMT10 | 0.0683 | 286.1 | 22.46 | 18.19 | 2.02 | 121.87 | 59.04 | 1.26 | 0.144 | 0.824 | 1.717 |
| MMT11 | 0.1752 | 276.9 | 42.42 | 22.01 | 2.05 | 144.89 | 78.37 | 3.13 | 0.386 | 0.823 | 1.803 |
| MMT12 | 0.6405 | 214.5 | 23.57 | 6.18 | 1.31 | 40.13 | 0.00 | 0.00 | 0.840 | 0.812 | 1.318 |
| MMT13 | 0.4696 | 209.1 | 6.03 | 6.51 | 1.15 | 39.59 | 0.00 | 0.00 | 0.072 | 0.780 | 1.524 |
| MMT14 | 0.4644 | 280.6 | 100.27 | 56.75 | 2.01 | 354.12 | 0.00 | 0.00 | 0.266 | 0.794 | 2.215 |
| Keck1 | 0.8390 | 124.6 | 4.62 | 7.80 | 0.80 | 61.10 | 0.00 | 0.00 | -0.016 | 0.897 | 1.811 |
| Keck2 | 0.6230 | 89.5 | 3.49 | 2.33 | 0.67 | 17.60 | 0.00 | 0.00 | 0.144 | 0.843 | 1.440 |
| Keck3 | 0.7906 | 121.2 | 27.88 | 12.50 | 0.27 | 59.17 | 0.00 | 0.00 | 0.658 | 0.676 | 2.142 |
| Keck4 | 0.8829 | 178.5 | 13.77 | 7.28 | 0.33 | 35.60 | 0.00 | 0.00 | 0.275 | 0.683 | 2.018 |
| Keck5 | 0.8353 | 101.1 | 1.85 | 1.10 | 0.58 | 7.99 | 0.00 | 0.00 | 0.362 | 0.879 | 1.102 |
| Keck6 | 0.8237 | 90.5 | 0.05 | 0.88 | 0.19 | 5.36 | 0.00 | 0.00 | -1.016 | 0.770 | 1.346 |
Note : the line fluxes are in 10-17 with 68 % confidence uncertainties
| ID | OVI | OV | Ly | NV | CIV | HeII | [OII] | [OIII] | [OIII] |
|---|---|---|---|---|---|---|---|---|---|
| 1034 | 1215 | 1215 | 1240 | 1549 | 1640 | 3727+ | 4363 | 5007+ | |
| MMT01 | - | - | - | - | - | - | 1.53 | 0.26 | 7.69 |
| m1 | 38.7 | 7.86 | 25.89 | 3. | 7.82 | 0.26 | 1.53 | 0.26 | 7.69 |
| mpl1 | 5.3 | 1.11 | 32. | 0.43 | 0.68 | 1.45 | 1.5 | 0.05 | 7.8 |
| MMT02 | - | - | - | - | - | - | 4.18 | 0.124 | 4.4 |
| m2 | 57.8 | 10.6 | 26.2 | 3.75 | 9.7 | 0.14 | 3.9 | 0.23 | 4.2 |
| mpl2 | 5. | 1. | 30.9 | 0.39 | 0.98 | 1.44 | 4. | 0.035 | 4.74 |
| MMT03 | - | - | - | - | - | - | 5.43 | 0.18 | 2.18 |
| m3 | 54.9 | 10.9 | 36.7 | 4.2 | 10.9 | 0.117 | 5.2 | 0.2 | 2.5 |
| mpl3 | 10.3 | 1.93 | 30.8 | 0.65 | 1.64 | 1.15 | 5. | 0.04 | 2.4 |
| MMT04 | - | - | - | - | - | - | 2.26 | 0.07 | 5.94 |
| m4 | 46.8 | 9. | 26. | 3.65 | 9.28 | 0.18 | 2.7 | 0.2 | 5.43 |
| mpl4 | 2.7 | 0.6 | 30.7 | 0.32 | 0.79 | 1.78 | 3. | 0.034 | 5.8 |
| MMT05 | - | - | - | - | - | - | 0.54 | 0.18 | 8.33 |
| m5 | 3.16 | 0.67 | 24.6 | 0.37 | 0.96 | 0.48 | 0.9 | 0.04 | 8.33 |
| mpl5 | 2.42 | 0.52 | 32.2 | 0.36 | 0.91 | 2.11 | 1.2 | 0.07 | 8.4 |
| MMT06 | - | - | - | - | - | - | 5.42 | 0.167 | 3.49 |
| m6 | 69.4 | 16. | 49.7 | 13.4 | 30 | 0.425 | 6. | 0.25 | 3.1 |
| mpl6 | 8.3 | 1.52 | 30.5 | 0.51 | 1.31 | 1.29 | 5.1 | 0.038 | 3.5 |
| MMT07 | - | - | - | - | - | - | 1.26 | 0.12 | 7.44 |
| m7 | 36.7 | 7.74 | 26. | 3.45 | 8.73 | 0.3 | 1.35 | 0.19 | 7.33 |
| mpl7 | 5.3 | 1.11 | 32. | 0.43 | 0.68 | 1.65 | 1.4 | 0.05 | 7.8 |
| MMT08 | - | - | - | - | - | - | 4.1 | 0.21 | 3.84 |
| m8 | 57.5 | 10.5 | 26. | 3.73 | 9.61 | 0.14 | 4. | 0.226 | 3.94 |
| mpl8 | 6.65 | 1.3 | 30.9 | 0.5 | 1.25 | 1.28 | 4.4 | 0.036 | 3.88 |
| MMT09 | - | - | - | - | - | - | 3.84 | 0.265 | 5.78 |
| m9 | 59.2 | 11.1 | 26.2 | 4.2 | 10.8 | 0.18 | 3.5 | 0.264 | 5.9 |
| mpl9 | 4.1 | 0.83 | 31.2 | 0.37 | 0.92 | 1.66 | 3.71 | 0.04 | 5.75 |
| MMT10 | - | - | - | - | - | - | 1.39 | 0.128 | 6.67 |
| m10 | 26.8 | 6.35 | 25.9 | 0.86 | 8.75 | 0.23 | 1.41 | 0.16 | 6.42 |
| mpl10 | 7. | 1.38 | 32.3 | 0.54 | 0.58 | 1.54 | 1.3 | 0.04 | 6.5 |
| MMT11 | - | - | - | - | - | - | 2.43 | 0.1 | 6.65 |
| m11 | 30.5 | 6.63 | 25.6 | 0.63 | 6.75 | 0.123 | 2. | 0.167 | 6.0 |
| mpl11 | 2.66 | 0.52 | 32.8 | 0.21 | 0.53 | 1.43 | 2.3 | 0.04 | 6.3 |
| MMT12 | - | - | - | - | - | - | 6.9 | 0.31 | 6.5 |
| m12 | 118.7 | 21.8 | 27.8 | 7.7 | 19.8 | 0.27 | 6.7 | 0.45 | 6.2 |
| mpl12 | 57.6 | 20.4 | 27.1 | 3. | 8.2 | 1.17 | 6.2 | 0.28 | 6.4 |
| MMT13 | - | - | - | - | - | - | 1.18 | 0.18 | 6.03 |
| m13 | 26. | 6,25 | 25.9 | 0.9 | 9.12 | 0.21 | 1.39 | 0.15 | 6.0 |
| mpl13 | 4.74 | 1.04 | 32.3 | 0.47 | 1.23 | 1.53 | 1.2 | 0.055 | 6.28 |
| MMT14 | - | - | - | - | - | - | 1.85 | 0.04 | 6.22 |
| m14 | 72.4 | 17. | 28.3 | 3.12 | 30.3 | 0.38 | 2.4 | 0.2 | 6.1 |
| mpl14 | 4.64 | 1.17 | 26.45 | 1.47 | 3.3 | 2.55 | 1.8 | 0.059 | 6.1 |
| Keck1 | - | - | - | - | - | - | 0.96 | 0.12 | 7.89 |
| m15 | 28.9 | 6.3 | 25.8 | 2.8 | 7.25 | 0.47 | 0.9 | 0.16 | 7.8 |
| mpl15 | 2.4 | 0.52 | 32.4 | 0.36 | 0.9 | 2.02 | 1.2 | 0.063 | 7.88 |
| Keck2 | - | - | - | - | - | - | 1.39 | 0.25 | 6.97 |
| m16 | 0. | 0.02 | 24.3 | 0.043 | 10.9 | 0.165 | 1.3 | 0.29 | 6.7 |
| mpl16 | 1.41 | 0.33 | 34.9 | 0.23 | 0.59 | 1.96 | 1.27 | 0.05 | 7. |
| Keck3 | - | - | - | - | - | - | 4.55 | 0.034 | 4.74 |
| m17 | 13.6 | 10.4 | 27.4 | 4.12 | 12.9 | 0.07 | 4. | 0.32 | 4.57 |
| mpl17 | 0.081 | 0.3 | 26.4 | 0.42 | 1.81 | 1.55 | 4.4 | 0.049 | 4.75 |
| Keck4 | - | - | - | - | - | - | 1.88 | 0.046 | 4.82 |
| m18 | 10.7 | 2.2 | 24.9 | 0.68 | 1.78 | 0.047 | 1.8 | 0.057 | 4.8 |
| mpl18 | 2.45 | 0.54 | 35. | 0.3 | 0.72 | 2.57 | 1.6 | 0.035 | 5.0 |
| Keck5 | - | - | - | - | - | - | 2.3 | 0.6 | 7.56 |
| m19 | 0.003 | 0.3 | 27.3 | 0.74 | 20.7 | 0.15 | 2.5 | 0.45 | 8. |
| mpl19 | 0.03 | 0.095 | 34.4 | 0.14 | 0.64 | 1.95 | 2.1 | 0.05 | 7.6 |
| Keck20 | - | - | - | - | - | - | 0.096 | 0.27 | 5.9 |
| m20 | 0. | 0.03 | 23.8 | 0.07 | 14.0 | 3.72 | 0.11 | 0.15 | 6.4 |
| mpl20 | 420. | 190. | 38. | 85. | 22.5 | 7.9 | 0.08 | 0.43 | 6. |
The R[OIII] ([OIII]5007+/[OIII]4363) line ratios indicate that gas densities and temperatures in ranges larger than those deduced in average from the observations should be accounted for. This is valid for the AGN NLR spectra (see e.g. (Contini & Aldrovandi 1986, fig. 4 and references therein, etc.) and for most of the objects throughout the galactic medium (such as SNR, novae, symbiotic stars) and the extra-galactic one. In Seyfert type 1 galaxies [OIII] lines from the BLR are collisionally deexcited. In Seyfert type 2 the [OIII] lines correspond to gas at =300-500 and densities of 104-105 . In intermediate type galaxies R[OIII] ranges between high ( 100) and low values ( 20). LINERs (Heckman 1980, Ferland & Netzer 1983, Ho et al 1993) cannot be considered as a low case (Contini & Aldrovandi 1983, fig. 3). Problems can be solved by adding shock wave hydrodynamics to the calculations of the spectra (Contini 1997 and references therein) or by assuming a density gradient or a stratification of emitting filaments (Pequignot 1984, Filippenko 1984, etc.) The importance of the [OIII]4363 line recently emerged for high z galaxies, because constraining the models. To cross-check this issue we calculate the Ly /H line ratios for galaxies which show spectra constrained by the [OIII] 4363 line (see Contini 2014a, Ly et al.2014). We choose the Ly et al (2014) survey because the reddening corrected spectra contain [OIII]5007+4959, [OIII] 4363, [OII] 3727, H and H lines.
In Table 10 the results of Ly et al. (2014) observations obtained by the Subaru telescope are reported. We compare the calculated with observed line ratios in Table 11. The uncertainty for model calculations is about 10 %.
In Table 12 models m1-m20 are calculated by SB dominated (+shock) models, while models mpl1-mpl20 (described in Table 13) are calculated by AGN (+shocks) dominated models. Table 11 show that [OII]/H and [OIII]/H line ratios are well fitted by both SB and AGN models, but, regarding the [OIII]5007+/[OIII]4363 line ratios, the SB dominated models fit the data of nearly all galaxies, while MMT5, MMT12, and Keck3 are better reproduced by AGN dominated models. For MMT4, Keck4 and Keck6 the SB and AGN photoionizing models act with similar weights.
The [OIII]4363/H is the key line ratio for choosing between SB or AGN dominated models. Indeed the shock plays an important role, but the effect of photoionization cannot be neglected. The ionization parameter () and the SB effective temperature ( ) for SB and the power-law flux from the AGN are determined by fitting the [OIII]5007+/H and [OII]3727/H line ratios. With those input parameters, the [OIII]4363/H line ratios for SB are higher by factors very roughly 10 than those calculated for the AGNs, indicating that the shock effect is relatively strong. So [OIII]5007+/[OIII]4363 are lower for starbursts.
The densities in the downstream emitting regions are higher by a factor of 10, depending on . Regarding the [NII]/H line ratios, the H /H line ratios for MMT10 and MMT11 are roughly between 3 and 4, the [NII]/H line ratios were directly calculated. The result of N/H is given only for the SB dominated models which well reproduce all the other line ratios. We obtained low N/H relative abundances (0.25 10-4) for the two galaxies MMT10 and MMT11. The results for O/H (in 10-4 units) are shown in Tables 12 and 13. O/H relative abundances calculated by detailed modelling are closer to solar and higher than those calculated by direct methods.
4 Discussion and concluding remarks
In previous sections we have been investigating the gas physical conditions and element abundances in galaxies at relatively high z, selected by their characteristic line spectra, i.e. including the Ly line and the lines which constrain the models. A detailed modelling process has been used. All the models are calculated at the emitting nebulae in the different galaxies. They lead to Ly /H higher than observed, except for some SB dominated models, MDS (Table 4) , MV1 and MV6 (Table 5) and some models in the Finkelstein et al survey (Tables 7-9). The models best reproducing the data in Tables 2-6 show that most of the spectra are fitted by the summed contributions of two types : those emitted from the high velocity ( 700-1500 ) clouds (generally close to an AGN), which explain the high ionization level lines and UV - X-ray data in the continuum SED, and those emitted from the relatively low ( 100-300 ), (100-300 ) radiation dominated clouds (by a AGN or a SB) which confirm the narrow optical line profiles, as well as the optical spectral and continuum data. In some cases one or more model components show that the photoionizing flux from the active source is prevented from reaching the gas, or that the source is absent. Therefore, the clouds within the galaxies are ionized and heated only by the shock. In the HDF galaxy (Dawson et al) the high (1300 ) clouds are found in the surroundings of a SB corresponding to a high . In the BX418 galaxy (Erb et al), the high velocity gas ( =600-800 ) shows a preshock density higher by a factor 10 than in the other objects. The shock velocities were most probably reduced by collision with high density gas. These clouds are located in the surroundings of an AGN. This is valid also for the shock dominated clouds (model MF0, Table 6) in the Lynx arc (Fosbury et al). A few galaxies from the radio survey of Humphrey et al (Table 3) do not show the high component which is neither present in the galaxies selected from the Vernet et al survey (Table 5). Here, the clouds are characterised by the very low and , similar or lower than those calculated to reproduce the Finkelstein et al spectra (Tables 8 and 9).
We report in Fig. 8 HeII 1640/CIV 1549 versus Ly /CIV 1549 calculated by the models presented in GRID1, considering gas in the conditions suitable to the NLR of AGN. The line ratios were calculated by GRID1 adopting two different geometrical thickness of the emitting clouds, =1017 cm and 1019 cm. In GRID1, for each set of and a series of models with different , (log =8,9,10,11,12) were adopted. =0 represents the shock dominated case and corresponds to the lowest HeII/CIV and Ly /CIV. Solar (Allen 1976) element abundances were used to calculate the spectra. The HeII/CIV and Ly /CIV trends (for each ) follow the increasing photoionization flux, because both HeII and Ly are recombination lines which depend on photoionization, while the fractional abundance distribution of carbon ions in different ionization levels strongly depends on gas temperature and density which are affected by the shock.
The data observed for nearly all the AGN dominated objects are nested between models showing 100 and 200 , the fluxes ranging throughout a large scale, and both geometrically thin and thick clouds. Also shown in Fig. 8 are the spectral data observed from the local galaxy Mrk3 (Collins et al 2005) because they include the Ly and UV lines. The data (reddening corrected) refer to different regions within the galaxy. The spectra represent average conditions covering small regions within the galaxy. So they tend to show intrinsic conditions of the gas rather than the averaged ones obtained by modelling the observed spectra covering the entire galaxy, as necessarily occurs for high z galaxies. The Mrk3 data are less scattered than those observed from high z galaxies and follow the model trends.
In Fig. 8 we added the data based on the Finkelstein et al and Ly et al. observations. They do not represent observed HeII/CIV versus observed Ly /CIV, but the calculated line ratios which are strongly constrained by the observed optical lines. Finkelstein et al and Ly et al. objects follow the trends of AGN (+shock) dominated models with roughly constant velocities. The observed line ratios referring to the other galaxies are scattered for different . The Finkelstein et al and Ly et al samples are situated close to higher shock velocity models.
Finally, in Figs. 9 the physical parameters ( , , , , , ), the H flux at the nebula and O/H and N/H relative abundances calculated for the present sample of galaxies are presented as function of the SFR. SFR were calculated by the H flux measured at Earth by the observers. We chosed H instead of Ly because less affected by scattering and absorption problems. For galaxies in which the H data were not available, we used Ly and we calculated H line fluxes by noticing that the Ly /H line ratios can be approximated to 25 for many models (Fig. 1) and that H /H 3.
The sample of galaxies which emit Ly and UV lines do not show peculiar physical conditions of the emitting gas, nor abnormal element abundances. However, for some galaxies of the Humphrey et al, Dawson et al, Stern et al, Dey et al, Norman et al surveys, emitting gas with relatively high ( 1000 ) is revealed by the complex FWHM of the line profiles. Such velocities are upper limits to those characteristic of the AGN NLR. Generally, higher accompany higher leading to collisionally deexcited forbidden lines. This is not the case for the Ly line emitting galaxies modelled throughout this paper. In the Humphrey et al galaxy 0211-122 spectrum reported in Table 2, for instance, [OIII] 5007 lines with FWHM = 130060 and [OII] 3727 with FWHM=730160 were observed. Most of the high velocity models are shock dominated. In these cases, the electron temperature and density steeply drop to T103 K (Fig. 6) at a certain distance from the shock-front (which depends on ) because the primary flux is absent and the secondary one is relatively weak.
The high ( 105 K) which indicates that the SB stars are close to outburst (Contini 2014b) were found in a few objects (4C+23.56 at z=2.479 from the Humphrey et al survey, SST24 at z=2.858 from the Dey et al survey and the Lynx arc at z=3.357 from Fosbury et al observations ) within more than 50 galaxies in the sample. These outstanding temperature, which are characteristic of galaxies showing some activity (Contini 2014b), are isolated events at the state of the art. Considering the evolutionary paths in the H-R diagrams for stars of different mass during the pre-main-sequence phase, these temperatures can be reached by 9M⊙ stars in a lifetime of 105 years (Prialnik 2000, fig. 8.1), which is very short compared to the redshift z age ( 2 Gyr).
Fig. 9 shows that the SFR between 1 and 300 M⊙ yr-1is accompanied by relatively high shock velocities ( 1000 ), but gaseous cloud densities are relatively low, similar to those in the AGN NLR and in the SB surrounding (350 ) for SFR 10 M⊙ yr-1. O/H reaches a lower limit minimum for some galaxies at SFR 10 M⊙ yr-1, then it grows with SFR to solar values at SFR 300 M⊙ yr-1. The N/H relative abundances show a large scattering. N/H are particularly low for a few galaxies in the Finkelstein et al survey at z 0.25. Humphrey et al, however, claim that nuclear activity and star formation which lead to solar metallicities at early times, are seen through lack of variability and high metallicity between z=2.5 and 0. The geometrical thickness of the emitting clouds presents minimum 1016 cm. and consequently also H fluxes calculated at the nebula show a large scattering covering roughly 4 orders of magnitude for SFR between 1 and 650 M⊙ yr-1, indicating fragmentation by turbulence in a shock dominated regime.
| model | 1 | U | D | O/H | H calc | ||
|---|---|---|---|---|---|---|---|
| 1 | 2 | 3 | - | 4 | 5 | 6 | |
| m1 | 220 | 120 | 5. | 0.05 | 8. | 6.5 | 0.00176 |
| m2 | 260 | 120 | 3.8 | 0.03 | 8.6 | 7.3 | 0.0016 |
| m3 | 240 | 130 | 1. | 0.001 | 8. | 6.6 | 0.0015 |
| m4 | 260 | 110 | 4.7 | 0.03 | 10. | 6.3 | 0.0016 |
| m5 | 250 | 110 | 7. | 0.06 | 40. | 4.5 | 0.018 |
| m6 | 260 | 130 | 8. | 0.0005 | 28. | 3. | 0.0008 |
| m7 | 220 | 120 | 5.1 | 0.05 | 8. | 5.6 | 0.0017 |
| m8 | 260 | 120 | 3.7 | 0.03 | 8.6 | 7.3 | 0.0016 |
| m9 | 260 | 110 | 4.4 | 0.03 | 9.5 | 6.8 | 0.0013 |
| m10 | 200 | 120 | 5. | 0.04 | 8. | 4.7 | 0.0018 |
| m11 | 200 | 120 | 4.5 | 0.04 | 8. | 6.6 | 0.003 |
| m12 | 260 | 120 | 3.6 | 0.02 | 7.7 | 7.3 | 0.00076 |
| m13 | 200 | 120 | 4.9 | 0.04 | 8. | 4.4 | 0.00176 |
| m14 | 200 | 120 | 4.6 | 0.03 | 7. | 5.5 | 0.0014 |
| m15 | 200 | 120 | 5.4 | 0.06 | 8. | 5.5 | 0.0019 |
| m16 | 90 | 120 | 4.3 | 0.06 | 5. | 6.6 | 0.0004 |
| m17 | 140 | 120 | 3.4 | 0.03 | 2.8 | 7.35 | 0.00064 |
| m18 | 200 | 140 | 4.5 | 0.04 | 13. | 8. | 0.0075 |
| m19 | 100 | 120 | 4.5 | 0.03 | 3. | 5.5 | 0.0003 |
| m20 | 90 | 100 | 5.7 | 0.2 | 8. | 5.5 | 0.00035 |
1: in ; 2: in ; 3: in 104K; 4: in 1015 cm; 5: in 10-4; 6: in
| model | F | D | O/H | H calc | ||
|---|---|---|---|---|---|---|
| 1 | 2 | 3 | 4 | 5 | 6 | |
| mpl1 | 220 | 1000 | 8 | 1 | 6.6 | 0.124 |
| mpl2 | 220 | 370 | 2 | 10 | 6.6 | 0.048 |
| mpl3 | 240 | 330 | 1 | 20 | 7.6 | 0.025 |
| mpl4 | 220 | 320 | 2.8 | 30 | 4.6 | 0.06 |
| mpl5 | 280 | 620 | 10 | 3 | 3.6 | 0.158 |
| mpl6 | 250 | 300 | 1.2 | 15 | 7.6 | 0.03 |
| mpl7 | 220 | 1000 | 8 | 1 | 6.6 | 0.124 |
| mpl8 | 240 | 330 | 1.5 | 10 | 6.6 | 0.036 |
| mpl9 | 240 | 330 | 2.4 | 12 | 5.6 | 0.053 |
| mpl10 | 250 | 1000 | 7.6 | 1 | 6.6 | 0.11 |
| mpl11 | 250 | 550 | 6 | 7 | 6.6 | 0.15 |
| mpl12 | 240 | 160 | 0.25 | 5.6 | 8.9 | 0.0021 |
| mpl13 | 220 | 1000 | 7.4 | 1 | 5.6 | 0.125 |
| mpl14 | 250 | 160 | 1 | 12 | 2 | 0.01 |
| mpl15 | 220 | 780 | 1.3 | 4 | 3.6 | 0.24 |
| mpl16 | 220 | 720 | 12 | 4 | 3.6 | 0.24 |
| mpl17 | 120 | 260 | 0.6 | 9 | 5. | 0.114 |
| mpl18 | 230 | 720 | 7.3 | 4 | 4.5 | 0.17 |
| mpl19 | 120 | 920 | 7 | 4 | 4.6 | 0.13 |
| mpl20 | 90 | 100 | 6 | 2 | 4.6 | 0.00005 |
1: in ; 2: in ; 3 in 10 10 photons cm-2 s-1 eV-1 at the Lyman limit; 4: in 1015 cm; 5: in 10-4; 6: in
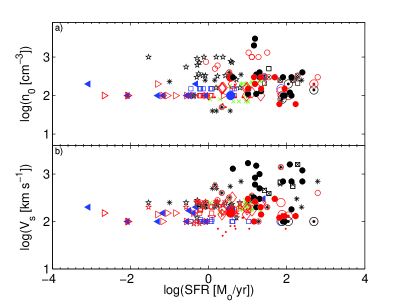
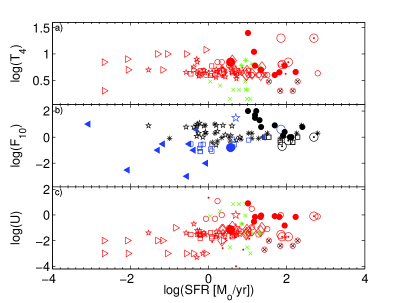
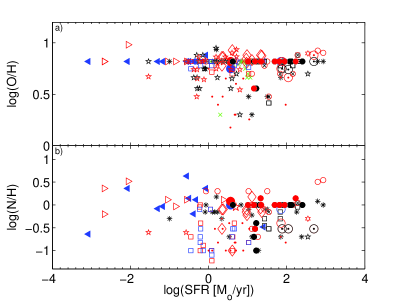
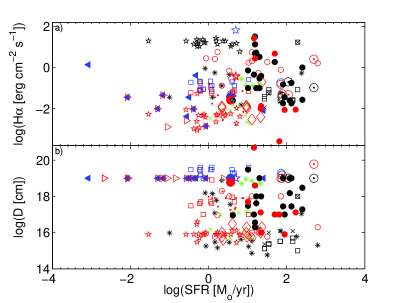
Acknowledgements
I am very grateful to the referee for reviewing the paper and for many comments which improved its presentation. I thank Dr. Chun Ly for providing the data in suitable format.
References
Aldrovandi, S.M.V. & Contini 1994, A&A, 140, 368
Allen, C.W. 1976 Astrophysical Quantities, London: Athlone (3rd edition)
Atek, H.; Kunth, D.; Schaerer, D.; Mas-Hesse, J.; Hayes, M.; Östlin, G.; Kneib, J-P, 2014, A&A, 561, 89
Beck, R. 2012,JPhCS, 372, 02051
Bose, S. et al. 2015, arXiv:1504.06207
Charlot,S., Fall, S.M. 1993, ApJ, 415, 580
Cimatti, A., di Serego Alighieri, S., Vernet, J., Cohen, M., Fosbury, R.A.E. 1988, ApJ, 499, L21
Collins, N. R.; Kraemer, S. B.; Crenshaw, D. M.; Ruiz, J.; Deo, R.; Bruhweiler, F. C. 2005, ApJ, 619, 116
Contini, M. 2014a, A&A, 564, 19
Contini, M. 2014b, A&A, 572, 65
Contini, M. 2013a, MNRAS, 429, 242
Contini, M. 2013b, arXiv:1310.5447
Contini, M. 2012, MNRAS, 425,1205
Contini, M. 2009, MNRAS, 399, 1175
Contini, M. 1997, A&A, 323, 71
Contini, M., Aldrovandi, S.M. 1983, A&A, 127, 15
Contini, M., Aldrovandi, S.M. 1986, A&A, 168, 41
Contini, M. & Viegas, S.M.A. 2001a, ApJS, 132, 211
Contini, M. & Viegas, S.M.A. 2001b, ApJS, 137, 75
Contini, M., Angeloni, R., Rafanelli, P. 2009, A&A, 496, 759
Contini, M., Cracco, V., Ciroi, S., & La Mura, G. 2012, A&A, 545, A72
Contini, M., Viegas, S.M., Prieto, M.A. 2004, MNRAS, 348, 1065
Cox, D.P. 1972, ApJ, 178, 143
Crenshow, D.M. et al 2002, ApJ, 566, 187
Dawson, S.; McCrady, N.; Stern, D.; Eckart, M. E.; Spinrad, H.; Liu, M. C.; Graham, J. R. 2003, AJ, 125, 1236
Dey, A. et al. 2005, ApJ, 629, 654
Dwek, E. 1981, ApJ, 247, 614
Erb, D.K., Pettini, M., Shapley, A.E., Steidel, C.C., Law, D.R., Naveen, A.R. 2010, ApJ, 719, 1168
Ferland, G., Netzer, H. 1983, ApJ, 264, 105
Field, G.B., Steigman, G. 1971, ApJ, 166, 59
Filippenko, A.V. 1985, ApJ, 289, 475
Finkelstein, S. L.; Cohen, S. H.; Moustakas, J.; Malhotra, S., Rhoads, J.E.; Papovich, C. 2011, ApJ, 733, 117
Fosbury, R.A.E. et al 2003, ApJ, 596, 797
Hamann, F. & Ferland, G. 1993, ApJ, 418, 11
Heckman, T.M. 1980 A&A, 87, 152
Heng, K., Sunyaev, R.A. 2008, A&A, 481, 117
Ho,L.C., Filippenko, A.V., Sargent, W.I.W. 1993, Ap], 417, 63
Humphrey, A.; Villar-Martin, M.; Vernet, J.; Fosbury, R.; di Serego Alighieri, S.; Binette, L. 2008, MNRAS, 383, 11
Knopp, G.P. & Chambers, K.C. 1997, ApJS, 109, 367
Ly, C.; Malkan, M. A.; Nagao, T.; Kashikawa, N.; Shimasaku, K.; Hayashi, M. 2014, ApJS, 780, 122
Norman, C. et al 2002, ApJ, 571, 218
Osterbrock, D.E. Astrophysics of Gaseous Nebulae and Active Galactic Nuclei. Mill Valley, CA: University Science Books; 1989.
Oteo, I. et al. 2012, A&A, 541, 650
Pequignot, D. 1984, A&A, 131, 159
Prialnik, D. 2000 in An Introduction to the Theory of Stellar Structure and Evolution, Cambridge University Press
Richards, E.A. 2000, ApJ, 533, 611
Rodríguez-Ardila,A., Contini, M., Viegas, S.M. 2005, MNRAS, 357, 220
Ryan Jr.,R.E., Cohen, S.H., Windhorst, R.A., Silk, J. 2008, ApJ, 678, 751
Stanford, S.A.,Elston, R., Eisenhardt,P.,R.,M., Spinrad,H., Stern, D., Dey, A. 1997, AJ, 114, 2232
Steigman, G., Werner, M.W., Geldon, F.M. 1971, ApJ, 168, 373
Stern, D. et al. 2002, ApJ, 568, 71
Turner, T.J. et al 2001, ApJ, 561, 131
Vernet, J.; Fosbury, R. A. E.; Villar-Martin, M.; Cohen, M. H.; Cimatti, A.; di Serego Alighieri, S.; Goodrich, R. W. 2001, A&A, 366, 7
White, H.E., 1934, Introduction to Atomic Spectra, McGROW- HILL book company, New York and London.
Williams, R.E. 1967, ApJ, 147, 552
Yajima, H., Li, Y., Zhu, Q. 2012 arXiv:1210.6440