Swift/BAT measurements of the cyclotron line energy decay in the accreting neutron star Her X-1: indication of an evolution of the magnetic field?
Abstract
Context. The magnetic field is a crucial ingredient of neutron stars. It governs the physics of accretion and of the resulting high-energy emission in accreting pulsars. Studies of the cyclotron resonant scattering features (CRSFs) seen as absorption lines in the X-ray spectra of the pulsars permit direct measuremets of the field strength.
Aims. From an analysis of a number of pointed observations with different instruments, the energy of CRSF, , has recently been found to decay in Her X-1, which is one of the best-studied accreting pulsars. We present our analysis of a homogeneous and almost uninterrupted monitoring of the line energy with Swift/BAT.
Methods. We analyzed the archival Swift/BAT observations of Her X-1 from 2005 to 2014. The data were used to measure the CRSF energy averaged over several months.
Results. The analysis confirms the long-term decay of the line energy. The downward trend is highly significant and consistent with the trend measured with the pointed observations: keV per year.
Conclusions. The decay of either indicates a local evolution of the magnetic field structure in the polar regions of the neutron star or a geometrical displacement of the line-forming region due to long-term changes in the structure of the X-ray emitting region. The shortness of the observed timescale of the decay, yr, suggests that trend reversals and/or jumps of the line energy might be observed in the future.
Key Words.:
neutron stars – accretion – magnetic field1 Introduction
Accreting magnetized neutron stars are among the brightest Galactic X-ray sources, with luminosities reaching – erg s-1. They are powered by the gravitational energy of matter that is supplied by the binary companion star and accreted by the compact neutron star (NS). The magnetic field of the NS is believed to have a roughly dipole configuration, with a field strength at the star surface of G. In the vicinity of the NS, the accretion flow consisting of heated ionized gas is channeled by the magnetic field lines toward the polar caps of the NS. In these regions, matter arrives at the stellar surface at a velocity of 0.5 causing energy release in form of X-rays. The rotation of the NS causes a periodic modulation of the observed flux – X-ray pulsations. The sources are therefore also referred to as X-ray binary pulsars (XBP) or accreting pulsars.
X-ray binary pulsars comprise the second most numerous observed population of NSs after radio pulsars: 200 XBPs are currently known111See, e.g., the on-line catalogue by M. Orlandini: http://www.iasfbo.inaf.it/~mauro/pulsar_list.html. An important advantage of these objects is that their magnetic field strength can be measured through observing cyclotron resonance scattering features (CRSFs). These features appear as absorption lines (cyclotron lines), caused by the resonant scattering of photons off the electrons in Landau levels (e.g., Trümper et al., 1978; Isenberg et al., 1998; Schönherr et al., 2007). The energy of the fundamental line and the spacing between the harmonics are directly proportional to the field strength: keV, where is the magnetic field strength in units of G and is the gravitational redshift at the region where the line is formed. The energies of the cyclotron lines in XBPs range from 10 to 100 keV (e.g., Caballero & Wilms, 2012).
Her X-1 is the first XBP where a CRSF was discovered and interpreted as such almost forty years ago (Trümper et al., 1978). It is interesting to note that the feature was originally interpreted as an emission line at 58 keV: part of the X-ray continuum on the high-energy side of the absorption feature was modeled with an emission component. The subsequent observations and analyses have shown, however, that the feature is an absorption line with a centroid energy of 35 keV (e.g., Gruber et al., 2001, and references therein). Among more than a dozen confirmed CRSF sources, Her X-1 possesses one of the most prominent cyclotron lines whose characteristics can be reliably measured with shorter observations than in other XBPs at a similar flux level. The source shows a regular pattern of on and off states repeating with a period of 35 d. One 35 d cycle includes two on states: the main-on characterized by a peak flux of up to 300 mCrab, and the short-on when the flux is about five times lower. The periodicity is believed to be caused by the warped accretion disk precessing with a 35 d period (e.g., Klochkov et al., 2006, and references therein). In most cases, only the data from main-ons have sufficient quality for the analysis of the cyclotron line. Thanks to its almost persistent nature and near regularity of the on-states, Her X-1 has repeatedly been observed with almost every hard X-ray instrument operated since the discovery of the source. As a result, an unprecedentedly long record of CRSF measurements in a single pulsar has been accumulated. For a detailed description of the observational data base of the cyclotron line measurements in Her X-1, we refer to the recent work by Staubert et al. 2014 (hereafter, Paper I).
The CRSF centroid energy in Her X-1 does not remain constant. In addition to the regular variability with the 1.24 s pulse phase of the NS, which is very common in XBPs, the cyclotron line energy in Her X-1 is found to depend on the source luminosity (Staubert et al., 2007; Klochkov et al., 2011). The luminosity of Her X-1, which reflects the mass accretion rate changes stochastically on a long timescale (from one 35 d cycle to the next) as well as on the timescale of individual 1.24 s pulse cycles (i.e., from one pulse cycle to the next, called pulse-to-pulse variability). By comparing the CRSF energies at different luminosities, it was found that is directly proportional to the X-ray luminosity on both timescales.
In addition to and independently of the relation, it was demonstrated in Paper I that the line centroid energy has been significantly evolving with time since the beginning of the observations. Specifically, it is shown that has been systematically decreasing since 1995 from 41 to 37 keV, that is, by 10% in total. In Fig. 1, we plot the line energy measured in pointed observations (all performed in main-on state of the source) as a function of time since 1995. See Paper I for a discussion of the measurements obtained before 1995 for which the original data are no longer available for re-analysis.
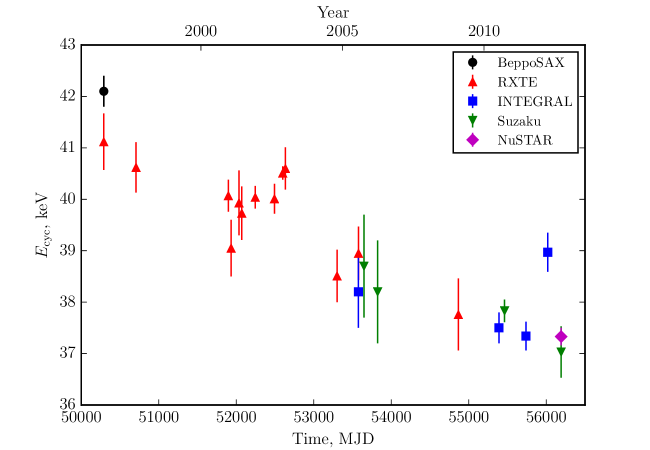
A significant downward trend of the CRSF energy with time can be clearly seen in Fig. 1. The X-ray luminosity of Her X-1 (characterized by the maximum flux during a main-on) changes stochastically between the observations without showing any long-term trend. Since is proportional to , the measured energies of the cyclotron line are affected by the varying luminosity of the source. To take this dependence into account, in Paper I we modeled the measured CRSF energy by a linear function of both time and luminosity . The time dependence of the line energy was found to be characterized by the time derivative keV/yr, indicating a significant trend.
In this work, we make use of the publicly available archival data taken with the Burst Alert Telescope (BAT, Barthelmy et al. 2005) – a hard X-ray detector onboard the Swift orbital observatory (Gehrels et al., 2004). The BAT instrument has a huge field of view of 1.4 steradian and is designed to provide triggers and accurate positions for gamma-ray bursts. While searching for bursts and other transient sources, BAT points at different locations in the sky, thus performing an all-sky monitoring in hard X-rays (see, e.g., Krimm et al., 2013). Here, we analyze the BAT data taken on Her X-1 since the launch of the mission, from 2005 to the end of 2014. The BAT data have some important advantages compared to the available data from the pointed observations. First, the regular visits of the source by the instrument provide a nearly homogeneously spaced set of data without long time gaps. Second, the measurements taken with the same instrument can be safely compared with each other. Third, in each single measurement of , we summed the data from several main-ons (five). Thus, the variation of the cyclotron line energy due to stochastic variability of from one main-on state to the next is expected to be mitigated ( is proportional to , see above).
2 Reduction and analysis of the BAT survey data
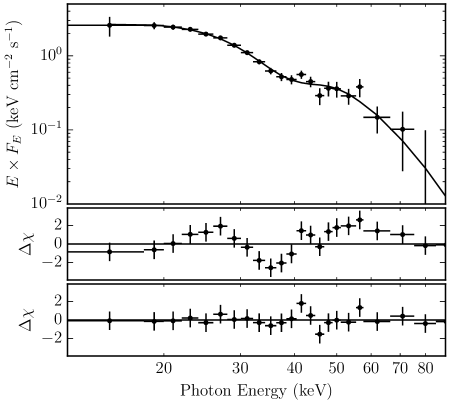
The Swift/BAT data used in this work are available through HEASARC222http://heasarc.gsfc.nasa.gov/cgi-bin/W3Browse/swift.pl. The BAT instrument is sensitive in the photon energy range 15–150 keV and is, therefore, well suited for the study of the 40 keV feature in Her X-1. Most of the BAT data are stored in the form of detector plane maps (histograms) accumulated over a five-minute exposure time. We collected such maps taken during the main-on states of Her X-1 (35 d phases 0.0–0.25, where phase zero corresponds to the time of X-ray turn-on – the sharp transition from the off- to the main-on state) when the source is in the BAT field of view starting from 2005 (start of Swift operation) to the end of 2014 (the time of the work on the publication). We then used the maps to construct the sky images with the help of the tools batbinevt and batfftimage from the HEASoft 6.16333http://heasarc.nasa.gov/lheasoft package. For further analysis, we only took the data where Her X-1 is clearly detected in the image. One such image accumulated in an observation of about 1 ks is shown in Fig. 2.
Detector plane histograms of BAT also contain the spectral information of the detected X-rays with the photon energy binning determined by 80 pre-defined energy channels. We used this information to extract spectra of Her X-1 using the multipurpose task batbinevt mentioned above. To correct the BAT energy scale for the nonlinear behavior of the detector electronics and for the detector-dependent offsets not accounted for by the on-board calibration, we used the tool baterebin and the available data base of the gain/offset maps of the detector. The tool applies a detector-dependent energy shift to the data. According to the instrument team, the accuracy of the corrected energy scale is 0.1 keV based on the spectrum of the on-board 241Am calibration source444http://swift.gsfc.nasa.gov/analysis/bat_digest.html. To the resulting Her X-1 spectra we added an energy dependent systematic uncertainty of 4% using the tool batphasyserr, as suggested by the instrument team. An example of the extracted BAT spectrum of Her X-1 accumulated in an exposure time of 15 ks is presented in Fig. 3. To model the obtained BAT spectra, we used the XSPEC cutoffplgabs model (power law with an exponential cutoff modified by an absorption line of a Gaussian optical depth profile). The power-law-cutoff model cutoffpl is the simplest continuum model of those that are commonly used to fit hard X-ray continua of XBPs. The Gaussian absorption line model gabs represents the cyclotron absorption line similarly to Paper I and to the most of the recent works on X-ray spectroscopy of Her X-1 (e.g., Staubert et al., 2007; Klochkov et al., 2008; Fürst et al., 2013). The solid line in the top panel of Fig. 3 shows the best fit of the spectrum with the described spectral model. The model provides stable fits with all our BAT spectra and results in line energies that are consistent with those measured in the pointed observations using other instruments, as shown in the next section.
To achieve a data quality sufficient for measuring the CRSF centroid energy with uncertainties similar to those of the pointed observations (Fig. 1), we summed BAT spectra of the source from four to ten adjacent main-on states. Although the BAT data coverage of a particular source is roughly homogeneous on a timescale of several hundred days, a significant clustering occurs on shorter timescales. We therefore used such a variable (adaptive) size of the time bins to maintain approximately the same accuracy for each measurement and to use as many BAT datasets useful for the spectral extraction as possible. Each of our BAT measurements of thus corresponds to a time span of a few months. The CRSF centroid energies measured in this way using the data from the beginning of the Swift operation are provided in Table 1.
| MJD start | MJD end | [keV] |
|---|---|---|
| 53440 | 53580 | |
| 53610 | 53750 | |
| 53790 | 54030 | |
| 54070 | 54210 | |
| 54240 | 54450 | |
| 54480 | 54590 | |
| 54620 | 54970 | |
| 55010 | 55150 | |
| 55180 | 55320 | |
| 55360 | 55530 | |
| 55570 | 55740 | |
| 55780 | 55920 | |
| 55950 | 56090 | |
| 56120 | 56260 | |
| 56300 | 56470 | |
| 56510 | 56610 | |
| 56650 | 56790 | |
| 56820 | 57030 |
3 Secular decay of the CRSF energy
The presented cyclotron line energies measured with Swift/BAT demonstrate a clear downward trend very similar to that indicated by the pointed observations. In Fig. 4, the Swift/BAT measurements presented in Table 1 are plotted as red filled circles together with the measurements from the pointed observations (rest of the data points, identical to Fig. 1). To demonstrate that the BAT values generally follow the trend indicated by the pointed observations, we added a linear fit to the pointed observations alone shown by the dotted line. Some deviations between the BAT and the pointed measurements reaching a few standard deviations are present and might be due to unknown BAT systematics and/or due to imperfect cross-calibration of the BAT spectral response with respect to the other instruments. The variability of on a timescale of months due to the dependence might also contribute to the deviations because the BAT measurements cover much longer time spans than the pointed observations.
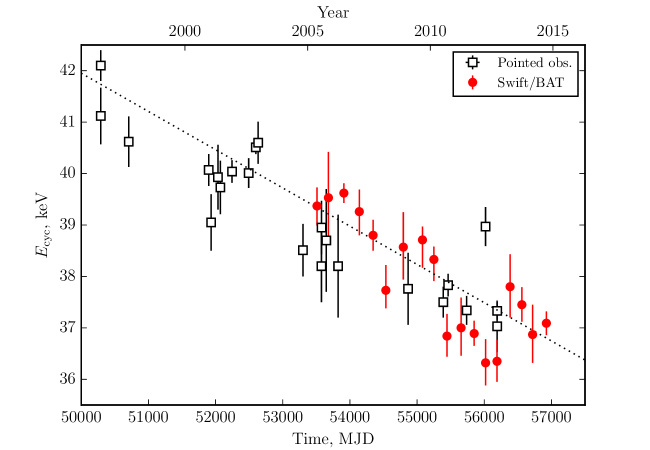
Despite the deviations, the long-term evolution of indicated by the BAT data is consistent with that exhibited by the pointed observations. To demonstrate this quantitatively, we calculated the slope of the dependence from a linear fit to the data. A fit to the BAT data alone yields keV/yr, which is consistent (within 2) with the values and keV/yr reported in Paper I for the pointed observation with and without taking the dependence into account, respectively. The significance of the linear trend in the BAT data alone from a linear correlation analysis is characterized by a two-sided null hypothesis probability (to obtain the correlation/trend by chance) of 10-5.
4 Summary and discussion
The analyzed Swift/BAT observations of Her X-1 clearly confirm the long-term decrease of the cyclotron line centroid energy with a rate of 0.3 keV per year reported in Paper I based on the pointed observations with different instruments. The BAT data set provides a more continuous and homogeneous although less accurate and somewhat shorter (starting only from 2005) monitoring of the line energy than do the available pointed observations. As mentioned in the introduction, each BAT data point corresponds to measurements over several adjacent on-states of the source such that variations from one on-state to the next (related to the variation of the luminosity) is partially averaged out. The data also provide an extension of the monitoring after the latest available pointed observations. We plan to continue our analysis of the upcoming BAT data and follow the evolution of the line energy in the future, also with more pointed observations.
In Paper I, we discussed a number of physical effects that might cause the observed decay of the CRSF energy. They are mostly related either to a possible local evolution of the -field structure in/around the polar regions of the NS driven by the accumulation and re-distribution of the accreted plasma or to the long-term changes in the physical dimensions of the emitting region, leading to a geometric displacement of the line-forming region in the inhomogeneous magnetic field. As Staubert (2014) has pointed out, the observed effect may be due to a slight imbalance between the rate on which matter is accreted (gained) and the rate at which matter is lost from the accretion mound - either by leaking to larger areas of the NS surface or by incorporation into the NS crust.
The evolution of the global dipole magnetic field of the neutron star, generally assumed to take place in accreting pulsars, must be characterized by the timescales of 106 yr (e.g., Bhattacharya et al., 1992), that is, much longer than that of the observed variation. Such a global evolution thus cannot explain the observed decay of , whose characteristic time scale is yr.
The local changes of the magnetic field, that are for instance due to accumulation and spreading of accreted matter in the magnetically confined accretion mound, can indeed occur on much shorter timescales. In Paper I, we argued that the timescale for the Ohmic decay for a small region like an NS polar cap with km can be as short as 102 yr. If the field evolution is driven by the crustal Hall effect, the charactreristic timescale should be yr (e.g., Goldreich & Reisenegger, 1992), which for a characteristic size of the polar cap km and a crustal density g cm-3 gives 105 yr – much too long for the observed changes. If we assume, however, that the footprint of the accretion stream on the NS surface has a shape of thin arcs (e.g., Postnov et al., 2013) with characteristic widths m, falls below 1000 yr and approaches the observed timescale of the cyclotron line energy decay. On the other hand, the detailed calculations by Payne & Melatos (2004), although neglecting the Hall effect and elastic stresses, have shown that the NS needs to accumulate 10 for the magnetic field to be significantly reducued. For Her X-1 accreting at a rate yr-1, this leads to a corresponding timescale of 104 yr, two orders of magnitude longer than the observed one. We note that a relatively short timescale of 100–1000 yr for the -field evolution depending on the equation of state of the NS crust has recently been obtained by Priymak et al. (2014), who ignored the Hall drift and Ohmic diffusion, however. It is clear that more sophisticated MHD calculations are necessary to investigate the details of the -field evolution in accreting pulsars on the observed timescale. At the current stage, we can only argue that the observed temporal decay of the CRSF energy in Her X-1 is most likely associated with a local effect in the vicinity of the NS polar cap. If this is true, it is expected that the decay should stop after some time, probably with an abrupt jump of the local magnetic field back to the unperturbed value. As discussed in Paper I, such a jump might have indeed been observed in the early 1990s. However, the relatively sparse time coverage of Her X-1 by X-ray observations did not allow following the event in detail.
The spreading of accreted matter and the associated evolution of the local -field might lead to a complicated configuration of the magnetic field in the polar regions of the NS with higher multipole components. Indeed, such a configuration seems to be indicated by complex emitting regions necessary to model the pulse profile evolution over the 35 d period of the source (Postnov et al., 2013).
We conclude that the long-term monitoring of accreting X-ray pulsars may give additional clues on the physical processes in the neutron star crusts through observations of time-dependent behavior of the CRSF energy.
Acknowledgements.
The research is supported by the joint DFG grant KL 2734/2-1 and Wi 1860 11-1 and the RFBR grant 14-02-91345. This research has made use of data and/or software provided by the High Energy Astrophysics Science Archive Research Center (HEASARC), which is a service of the Astrophysics Science Division at NASA/GSFC and the High Energy Astrophysics Division of the Smithsonian Astrophysical Observatory. We thank the referee, Ulrich R.M.E. Geppert, for his comments and suggestions that improved the the manuscript. DK thanks Valery Suleimanov for useful discussions.References
- Barthelmy et al. (2005) Barthelmy, S. D., Barbier, L. M., Cummings, J. R., et al. 2005, Space Sci. \ Rev., 120, 143
- Bhattacharya et al. (1992) Bhattacharya, D., Wijers, R. A. M. J., Hartman, J. W., & Verbunt, F. 1992, A&A, 254, 198
- Caballero & Wilms (2012) Caballero, I. & Wilms, J. 2012, Mem. Soc. Astron. Italiana, 83, 230
- Fürst et al. (2013) Fürst, F., Grefenstette, B. W., Staubert, R., et al. 2013, ApJ, 779, 69
- Gehrels et al. (2004) Gehrels, N., Chincarini, G., Giommi, P., et al. 2004, ApJ, 611, 1005
- Goldreich & Reisenegger (1992) Goldreich, P. & Reisenegger, A. 1992, ApJ, 395, 250
- Gruber et al. (2001) Gruber, D. E., Heindl, W. A., Rothschild, R. E., et al. 2001, ApJ, 562, 499
- Isenberg et al. (1998) Isenberg, M., Lamb, D. Q., & Wang, J. C. L. 1998, ApJ, 493, 154
- Klochkov et al. (2008) Klochkov, D., Staubert, R., Postnov, K., et al. 2008, A&A, 482, 907
- Klochkov et al. (2011) Klochkov, D., Staubert, R., Santangelo, A., Rothschild, R. E., & Ferrigno, C. 2011, A&A, 532, A126
- Klochkov et al. (2006) Klochkov, D. K., Shakura, N. I., Postnov, K. A., et al. 2006, Astron. \ Let., 32, 804
- Krimm et al. (2013) Krimm, H. A., Holland, S. T., Corbet, R. H. D., et al. 2013, ApJS, 209, 14
- Payne & Melatos (2004) Payne, D. J. B. & Melatos, A. 2004, MNRAS, 351, 569
- Postnov et al. (2013) Postnov, K., Shakura, N., Staubert, R., et al. 2013, MNRAS, 435, 1147
- Priymak et al. (2014) Priymak, M., Melatos, A., & Lasky, P. D. 2014, MNRAS, 445, 2710
- Schönherr et al. (2007) Schönherr, G., Wilms, J., Kretschmar, P., et al. 2007, A&A, 472, 353
- Staubert (2014) Staubert, R. 2014, in proceedings of 10th INTEGRAL Workshop: ”A Synergistic View of the High Energy Sky”, 15-19 September 2014, Annapolis, MD, USA, PoS(INTEGRAL2014)024
- Staubert et al. (2014) Staubert, R., Klochkov, D., Wilms, J., et al. 2014, A&A, 572, A119
- Staubert et al. (2007) Staubert, R., Shakura, N. I., Postnov, K., et al. 2007, A&A, 465, L25
- Trümper et al. (1978) Trümper, J., Pietsch, W., Reppin, C., et al. 1978, ApJl, 219, L105