The Hubble Space Telescope UV Legacy Survey of Galactic Globular Clusters. IV. Helium content and relative age of multiple stellar populations within NGC 6352 ††thanks: Based on observations with the NASA/ESA Hubble Space Telescope, obtained at the Space Telescope Science Institute, which is operated by AURA, Inc., under NASA contract NAS 5-26555 under GO 13297.
Abstract
In this paper we combine WFC3/UVIS F275W, F336W, and F438W data from the “UV Legacy Survey of Galactic Globular Clusters: Shedding Light on Their Populations and Formation” (GO 13297) HST Treasury program with F606W, F625W, F658N, and F814W ACS archive data for a multi-wavelength study of the globular cluster NGC 6352. In the color-magnitude and two-color diagrams obtained with appropriate combination of the photometry in the different bands we separate two distinct stellar populations and trace them from the main sequence to the subgiant, red giant, horizontal and asymptotic giant branches.
We infer that the two populations differ in He by . With a new method, we also estimate the age difference between the two sequences. Assuming no difference in [Fe/H] and [/Fe], and the uncertainties on , we found a difference in age between the two populations of Myr. If we assume [Fe/H] and [/Fe] differences of 0.02 dex (well within the uncertainties of spectroscopic measurements), the total uncertainty in the relative age rises to 300 Myr.
keywords:
stars: Population II — globular clusters individual: NGC 63521 Introduction
The Hubble Space Telescope (HST) “UV Legacy Survey of Galactic Globular Clusters: Shedding Light on Their Populations and Formation” (GO 13297, PI Piotto) is a Treasury program to study globular cluster (GC) stellar populations using multi-wavelength high-precision HST photometry and astrometry. The program is fully described in Piotto et al. (2015, hereafter Paper I). The main purpose of this survey is to identify multiple stellar populations and study their properties, including their relative ages, chemical compositions, spatial distributions, and kinematics. Within GO 13297 we collected F275W, F336W, and F438W WFC3/UVIS images, approximately overlapping the F606W and F814W data from GO 10755 (PI Sarajedini, see Sarajedini et al. 2007).
In this paper we analyze photometry of stars in the Galactic GC NGC 6352. Our main purpose is to infer the helium content and determine the relative ages of its stellar populations. NGC 6352 is a Bulge (Galactic coordinates: , ), metal-rich GC, located at 5.6 Kpc from the Sun [=14.43, =0.22, Harris 1996, 2010 revision], and having luminosity (Harris 1996, 2010 revision) and mass of (Marks & Kroupa 2010). From high-resolution spectroscopy of nine horizontal branch (HB) stars, Feltzing, Primas & Johnson (2009) confirmed the results of previous works, that this cluster has a high metallicity ([Fe/H]) and is enhanced ([/Fe]0.2).
The paper is organized as follows. Section 2 presents the data and data analysis. Section 3 and 4 show the characteristics of the two stellar populations hosted by NGC 6352, and their properties as seen with different combinations of colors and magnitudes. In Section 5 the difference in the helium content of the two stellar populations is calculated. In Section 6 we describe the new method we developed to estimate the difference in age between the two stellar populations. In Section 7 there are the conclusions.
2 Observations and data analysis
In order to identify the multiple stellar populations in NGC 6352 we used WFC3/UVIS images of GO 13297 and ACS/WFC data of GO 10775. The WFC3 data set consists in 706 s + s F275W, s F336W, and a 58 s + 72 s F438W images. ACS data include s + 7 s F606W and s + 7 s F814W images, overlapped to WFC3 images. We also reduced ACS images collected in F625W and F658N bands within GO 12746 (PI Kong). Exposure times are 2150 s in F625W and a 650 s + 643 s in F658N. A detailed description of the reduction of GO 13297 data is provided in Paper I (see their Sect. 5). We have used the photometric and astrometric catalogs published by Anderson et al. (2008) for GO 10775 data, while photometry and astrometry of archive ACS/WFC images from GO 12746 have been carried out as in Anderson et al. (2008).
3 The color-magnitude diagrams of NGC 6352
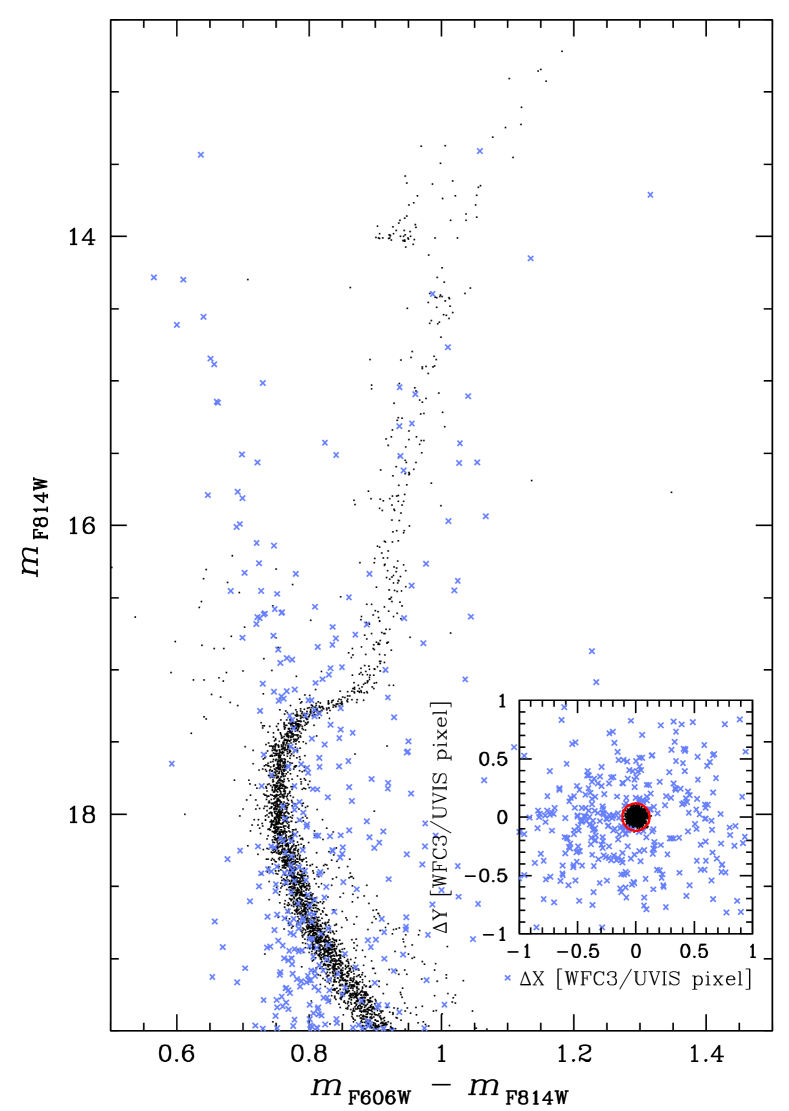
In Paper I (see their Fig. 2), we have shown that the color-magnitude diagram (CMD) of NGC 6352 is not consistent with a single stellar population. The vs. CMD of the cluster members of NGC 6352 is shown in Fig. 1: in black there are the stars that, on the basis of their proper motions, have high probability to be cluster members, in light blue the rejected stars. To derive stellar proper motions, we determined the displacement between the stellar positions in GO 10775 data-set (2006.4) and in GO 13297 data-set (2013.7 and 2014.5) by following the method described in detail by Piotto et al. (2012, see their Sect. 4). The maximum time baseline for the proper motion measurements is 8.1 yrs.
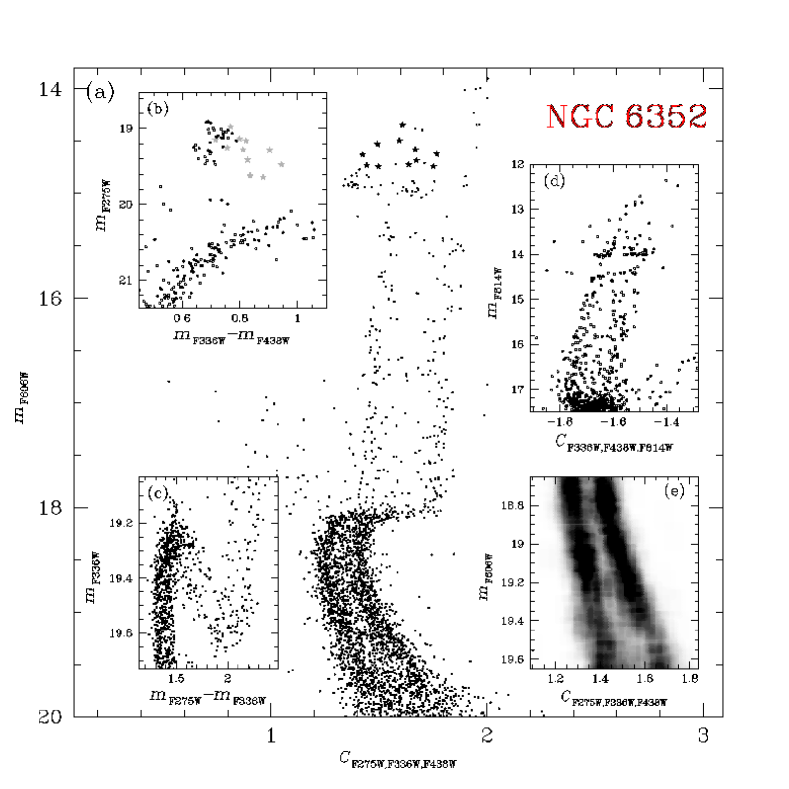
Figure 2a shows the vs. =()() diagram for proper-motion-selected cluster members. Asymptotic Giant Branch (AGB), stars selected from the vs. - CMD, are represented with starred symbols. Two distinct sequences are clearly visible and can be continuously followed from the main sequence (MS), the sub-giant branch (SGB), the red giant branch (RGB), to the HB, and the AGB. Panels b–e of Fig. 2 show a collection of CMDs for NGC 6352 and reveal the pattern of its multiple sequences.
3.1 Multiple stellar populations in NGC 6352
In Fig. 3 we use the - vs. - two-color diagram to separate the two populations, named population-a (POPa) and population-b (POPb) hereafter. Panel (a) of Fig. 3 shows the vs. - CMD, corrected for differential reddening and only for cluster-member stars, selected using proper motions. The green dotted lines identify the four regions in the CMD which include MS, SGB, RGB and HB stars. Again, AGB stars are plotted using starred symbols. All stars that, on the basis of their position on the CMD, are possible binaries, blue stragglers or survived field stars have been excluded from the following analysis and plotted as gray crosses.
Our recent papers demonstrated how two-color and color-magnitude diagrams made with appropriate combination of far-ultraviolet, ultraviolet and blue magnitudes represent a very efficient tool to identify multiple stellar populations in a GC (Milone et al. 2012a, c, 2013; Paper I). Panels (b1), (b2), (b3), and (b4) of Fig. 3 show the - vs. - two-color diagrams for the four evolutionary sequences highlighted in the left-panel CMD. Two sequences are clearly visible in each diagram. We drew by hand a straight continuous line to separate the two groups of POPa and POPb stars in the SGB, RGB + AGB, and HB, and colored them green and magenta, respectively. The two sequences of AGBa and AGBb stars are separated by the black dashed line in panel (b2). In order to separate the two MSs we used the vs. diagram plotted in panel (c1) of Fig. 3. Indeed, in this pseudo-CMD the double MS of NGC 6352 is better distinguishable than in the - vs. - plane.
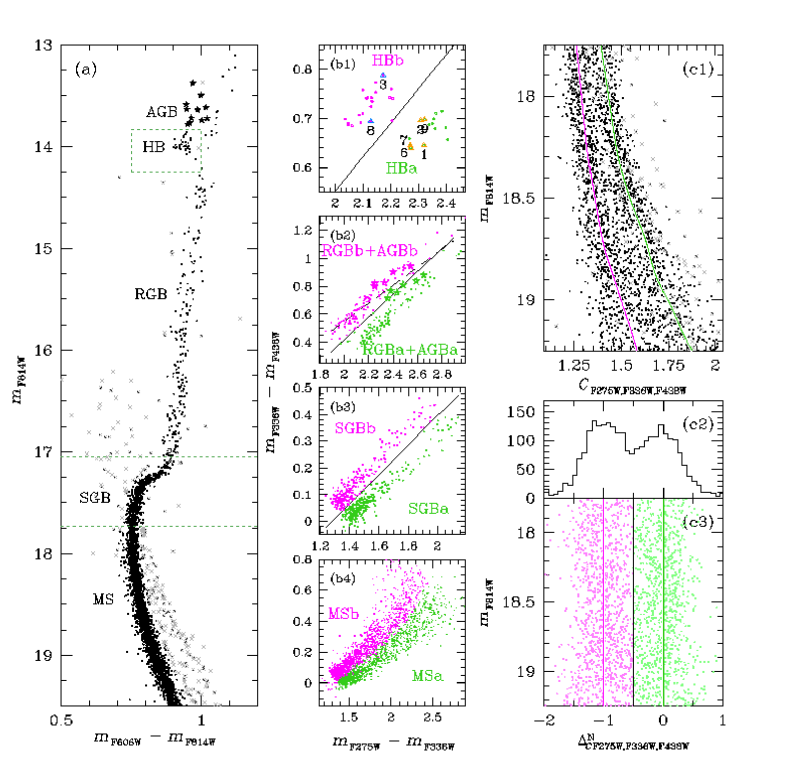
The green and the magenta fiducial lines, superimposed on the MS, are the fiducials of the MSa and the MSb, respectively, and have been obtained by using the following procedure. As a first guess, we have selected by eye a sample of MSa and MSb stars and derived for each of them a fiducial line by fitting a spline through the median values of obtained in successive short intervals of magnitude. We iterated this step with a sigma-clipping procedure. Then, as in Milone et al. (2015, Paper II) , we verticalized the MS in such a way that the green and magenta fiducials translate into vertical lines with abscissa =0 and , respectively. The histogram of the distribution in plotted in panel (c2) is clearly bimodal. We considered stars with 0.5 as MSa members and the remaining MS stars as MSb objects. Panel (c3) shows the vs. verticalized diagram for the MS stars. We colored MSa and MSb stars in green and magenta, respectively. These colors will be consistently used hereafter.
3.2 The chemical composition of the HB stars
Typically, multiple sequences along the CMD correspond to distinct stellar populations with different content of helium and light elements (see, e.g., Marino et al. 2008; Yong & Grundahl 2008; Paper II). Feltzing, Primas & Johnson (2009) measured chemical abundances for nine HB stars of NGC 6352 from high signal-to-noise UVES@VLT spectra. They have confirmed that NGC 6352 is a metal-rich GC ([Fe/H]=0.550.03), and is enhanced in elements by [/Fe]0.2 dex. Feltzing and collaborators also detected significant star-to-star sodium variation in close analogy with what is observed in most Milky-Way GCs (e.g., Kraft et al. 1993; Gratton, Sneden & Carretta 2004).
In order to investigate the chemical content of POPa and POPb, we have exploited the spectroscopic results by Feltzing, Primas & Johnson (2009). Our photometric catalog includes seven stars studied by Feltzing, Primas & Johnson (2009). Five of them belong to the HBa and are Na-poor ([Na/H]). The other two are Na-rich ([Na/H]) and are HBb members. The two groups of Na-rich and Na-poor stars both have the same mean metallicity [Fe/H]. In panel (b1) of Fig. 3 we plotted these HB stars as triangles with the corresponding ID number adopted by Feltzing, Primas & Johnson (2009): orange triangles are for Na-poor stars, cyan triangles show the Na-rich ones.
4 Multi-wavelength view of multiple populations
In the previous section we used the vs. pseudo-CMD and the - vs. - two-color diagram, where multiple sequences are clearly distinguishable, in order to select the members of the two stellar populations along the MS, the SGB, the RGB, and the HB of NGC 6352. We can now combine all different bands in order to study the behavior (e.g. color differences) of the two populations in all possible CMDs we can construct with our data. An example is shown in Fig. 4. Note that POPa stars are redder than POPb ones in the vs. - CMD, while they are bluer in the vs. - CMD, as in the case of 47 Tuc (Milone et al., 2012c). The two upper panels of Fig. 5 show the vs. fiducial lines for the RGBs (top panels) and MSs (middle panels) of the two populations, where X=F275W, F336W, F438W, F606W, F625W, and F658N.
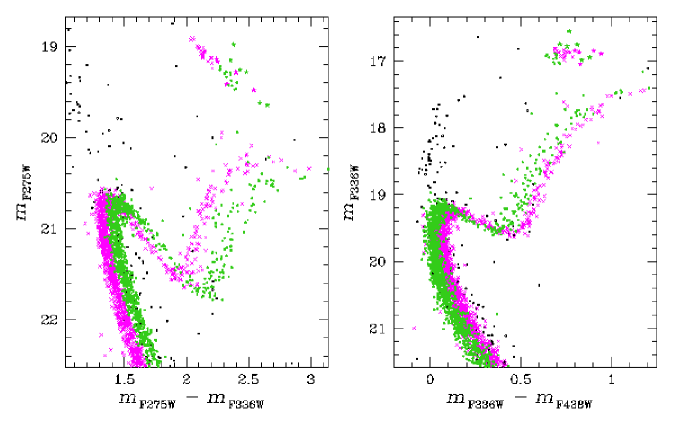
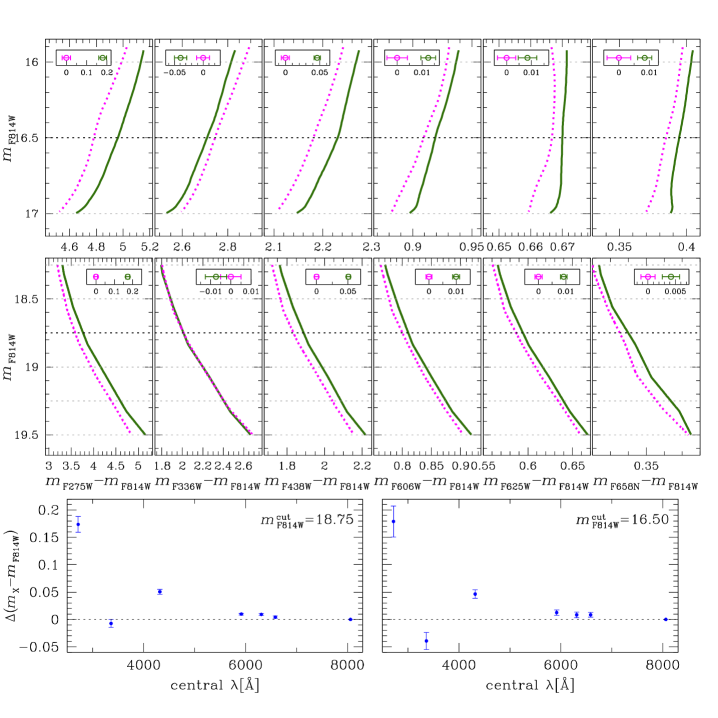
POPa is redder than POPb in most of the CMDs of Fig. 5, in close analogy with what is observed in most GCs (Bellini et al. 2010; Milone et al. 2012a, c, 2013). In visual and ultraviolet the color separation between POPa and POPb increases with the color baseline, and is maximum for . The fiducial of the two populations are almost coincident in -, where POPa is slightly bluer than POPb.
The procedure used to determine each fiducial line is based on the naive estimator (Silverman, 1986). First, we defined a series of magnitude intervals with a given width (). Magnitude intervals are defined over a grid of points separated by step of fixed magnitude (). We calculated the median magnitude and color of stars within each magnitude interval . These median points have been smoothed using the smoothing technique of boxcar averaging, in which each point of a vector is replaced with the average of the adjacent points. Finally, the smoothed median points were interpolated with a cubic spline.
The choice of is the result of a compromise. On one hand, we require small magnitude intervals to account for the detailed structure of the fiducial line. On the other hand, we need a large width to include in the magnitude interval a large number of stars for a statistically significant measurement of the median color and magnitude. We used different values of for stars with different luminosity. Specifically, we assumed for RGB stars with , for SGB stars with , and for MS stars with . In all the cases we used .
In order to estimate the error associated to the colors () and magnitudes () of each observed fiducial we used the following procedure. For each stellar population selected in Fig. 3 we assigned a subsample of artificial stars (ASs) and randomly extracted a star from it by following the recipe in Milone et al. (2009). The AS subsample consists of all the ASs with similar magnitudes (within 0.3 magnitudes) and radial distances (less than 100 pixels from the observed star). This method produces a catalog of simulated stars with almost the same luminosity and radial distribution of the observed catalog. We applied the procedure described above to estimate the fiducial line of the sample of AS stars, and calculated the difference between the fiducial of the ASs and the real stars. We repeated this step 100 times. The color error associated to each point of the observed fiducial is calculated as the percentile of this distribution.
5 The helium abundance of the two stellar populations
The helium abundance of a stellar population is a fundamental ingredient to understand its evolution, and to shed light on the chemical-enrichment and the star-formation history in a GC. In addition, accurate helium determination is crucial to estimate several parameters of the host star cluster, like age, mass, and mass function.
A direct spectroscopic determination of the He content in GCs is only feasible in rare cases and for a tiny subset of stars (e.g., Behr 2003; Villanova, Piotto & Gratton 2009; Dupree, Strader & Smith 2011; Pasquini et al. 2011; Marino et al. 2014). On the other hand, the method based on multi-wavelength photometry of multiple sequences that we developed can be applied to all clusters and provides a reliable estimate of the He abundance differences among the different populations and can reach internal errors smaller then spectroscopic methods (see Milone et al. 2012c; Paper II and references therein). In the few cases where helium has been inferred from both spectroscopy of HB stars and photometry, the results from the two techniques are in fairly agreement. In the case of NGC 2808, Marino et al. (2014) derived an helium abundance (internal plus systematic uncertainty) from spectroscopy of HB stars slightly bluer than the RR Lyrae instability strip. This result is consistent with the helium abundance inferred from the analysis of multiple MSs, where the middle MS (which would be associated to the stars analyzed by Marino and collaborators), has (Piotto et al. 2007; Milone et al. 2012b). Similarly in the case of NGC 6397, both photometry (di Criscienzo, D’Antona & Ventura 2010; Milone et al. 2012a) and spectroscopy (Mucciarelli et al. 2014) conclude that second-population stars are slightly enhanced in by dex. In the case of M 4, Villanova et al. (2012) found that the second population is enhanced in helium by 0.04-0.05 dex with respect to the first one. This result is in apparent disagreement with results by Nardiello et al. (2015) who inferred an helium difference of dex between the two MSs of this clusters. However, it should be noted that the discrepancy could be due to NLTE that affect the helium line at (see e.g. Marino et al. 2014, Sect. 4 for the case of NGC 2808).
Helium has been also inferred in RGB stars from near-infrared chromospheric transition of He I at 10 830 in NGC 2808 and Centauri. The spectra suggest helium abundances of 0.22 and 0.39-0.44 () for the two analyzed stars in Centauri (Dupree & Avrett 2013), while Na-rich and Na-poor stars of NGC 2808 analyzed by Pasquini et al. (2011) differ in helium by 0.17, with the sodium-rich star being also helium rich. Such helium variation are larger than those obtained from the analysis of multiple sequences in the CMD, that are for NGC 2808 (D’Antona et al. 2005; Piotto et al. 2007; Milone et al. 2012b) and for Centauri (King et al. 2012).
Figure 5 illustrates the procedure to infer the helium content of the stellar populations in NGC 6352. Upper panels show a collection of vs. fiducial lines, where XF275W, F336W, F438W, F606W, F625W and F658N. We have used green and magenta continuous lines to plot the fiducials along the RGB (top panels) and the MS (middle panels) of the two populations. We have calculated the color difference between the green and the magenta fiducials at the reference magnitudes indicated by the black dashed lines at =18.75 for the MS, and =16.50 for the RGB.
Results are shown in the lower panels of Fig. 5. We found that () has negative values only for X=F336W. When the other filters are used, the color separation between the two RGBs and MSs is maximum for X= and decreases towards redder wavelengths of the X filter.
In order to estimate the effective temperatures () and gravities () of MS and RGB stars with = we used the isochrones by Dotter et al. (2008) that best match the CMD.
| 19.50 | 0.3000.028 | -0.0160.017 | 0.0490.011 | 0.0120.003 | 0.0050.004 | 0.0010.004 |
|---|---|---|---|---|---|---|
| 19.25 | 0.2340.026 | -0.0090.012 | 0.0450.007 | 0.0110.002 | 0.0060.003 | 0.0050.003 |
| 19.00 | 0.2040.019 | -0.0030.009 | 0.0480.006 | 0.0120.002 | 0.0090.002 | 0.0050.003 |
| 18.75 | 0.1740.014 | -0.0070.007 | 0.0510.005 | 0.0100.002 | 0.0090.002 | 0.0040.002 |
| 18.50 | 0.1280.011 | -0.0110.006 | 0.0450.004 | 0.0070.002 | 0.0050.002 | 0.0010.002 |
| 18.25 | 0.1110.008 | -0.0080.004 | 0.0380.003 | 0.0080.001 | 0.0050.001 | 0.0010.002 |
| 17.00 | 0.1680.038 | -0.0560.030 | 0.0520.018 | 0.0160.008 | 0.0160.008 | 0.0220.009 |
| 16.50 | 0.1790.028 | -0.0390.016 | 0.0460.008 | 0.0130.005 | 0.0080.005 | 0.0090.005 |
| 16.00 | 0.1580.030 | -0.0330.020 | 0.0440.008 | 0.0110.005 | 0.0100.007 | 0.0100.006 |
Note that we are mainly interested in relative ages rather than in absolute ones. Indeed, as demonstrated in next section, accurate relative ages are feasible using our dataset. Here, we just need reference models to calculate the color differences of the two populations. As discussed in Section 6, the best match with observations could be obtained using isochrones with [Fe/H]=, in fair agreement with the value inferred from high-resolution spectroscopy by Carretta & Gratton (1997), [/Fe]=0.4, and an age of 13.1 Gyr [adopting , an , Harris 1996, 2010 edition]. We assumed for POPa, and different helium abundances with ranging from 0.256 to 0.330, in steps of 0.001, for POPb. Since there are no measurements of C, N, O abundance for NGC 6352 stars, we assumed for POPa and POPb the same C, N, O content as the two main stellar populations of 47 Tuc. Specifically, we used for POPa [C/Fe]=-0.20, [N/Fe]=0.20, [O/Fe]=0.40, and assumed that POPb stars are depleted in carbon and oxygen by 0.20 and 0.15 dex, respectively and nitrogen enhanced by 0.7 dex with respect to POPa stars.
We used the ATLAS12 code (Kurucz 1993; Sbordone et al. 2004) to calculate atmospheric models for the MS and RGB stars with =, while synthetic spectra have been generated with SYNTHE (Kurucz & Avrett 1981) with a resolution of =600 from 2000 to 10000Å.
Synthetic spectra of POPa and POPb stars have been integrated over the transmission curves of the WFC3/UVIS and the ACS/WFC filters used in this paper in order to determine synthetic colors. The colors from synthetic spectra with different have been compared with observations in order to estimate the helium abundance of POPb.
The best fit between observed and theoretical colors at 18.75 can be obtained assuming POPb enhanced in helium by Y=0.033 dex. We have repeated this procedure for 18.25, 18.50, 19.00, 19.25, and 19.50 for the MS, and 16.00, 16.50 and 17.00 for the RGB. The results are listed in Table 1. The values of , log(), and Y that provide the best fit to the observed color differences are listed in Table 2 for each value of . On average, we have Y=0.0290.006, where the error represent the 68.27th percentile of the distribution of the sorted residuals from the mean value. To estimate Y we only used visual bands (F606W, F625W, F658N, and F814W), because they are not affected by light-elements variations. For this reason, the final result is not conditioned by the assumptions on the C, N, and O abundances. In the case where C, N, and O abundances were known, the final value of , obtained using all the photometric bands, would not change. As a test, we repeated the procedure described above by assuming different values of C, N, and O: we found the same result.
| 19.50 | 3673 | 3677 | 2.51 | 2.53 | 0.018 |
| 19.25 | 3678 | 3684 | 2.64 | 2.69 | 0.023 |
| 19.00 | 3687 | 3692 | 2.86 | 2.91 | 0.030 |
| 18.75 | 3693 | 3698 | 3.06 | 3.10 | 0.033 |
| 18.50 | 3698 | 3702 | 3.23 | 3.26 | 0.024 |
| 18.25 | 3700 | 3705 | 3.37 | 3.40 | 0.031 |
| 17.00 | 3766 | 3767 | 4.25 | 4.26 | 0.042 |
| 16.50 | 3764 | 3766 | 4.29 | 4.30 | 0.026 |
| 16.00 | 3754 | 3756 | 4.40 | 4.41 | 0.030 |
| 0.0290.006 |
6 Relative ages of the two stellar populations
The relative ages of the multiple stellar populations hosted by GCs is an important issue to understand how GCs formed. We can speculate that the phenomenon of multiple stellar populations in GCs is due to the presence of different generations of stars, formed in different epochs: a first stellar generation (FG) characterized by primordial helium and chemical composition similar to that of field stars with the same metallicity, and a helium-enhanced second generation (SG), characterized by stars depleted in C and O and enhanced in N and Na, born from material processed at high temperature by FG stars. If we exclude the “anomalous” GCs, such as Cen (Norris & Da Costa 1995), M 22 (Marino et al. 2011), and M 2 (Yong et al. 2014, Paper II), stars of different populations in “normal” GCs show negligible differences in metallicity (Carretta et al. 2009). Because of this, we can exclude supernova ejecta as possible polluters of the material from which SG stars formed.
Current scenarios for the formation of multiple stellar populations in GCs predict different timescales. The AGB scenario (D’Antona et al. 2002) predicts that envelopes of intermediate mass AGB stars are the cause of pollution. In models aimed at reproducing the observed chemical patterns in “normal” globular clusters with AGB ejecta, the second generation star formation epoch extends between about 40 and 90–100 Myr (D’Ercole et al., 2010, 2012). Another suggested mechanism is the formation of stars from material ejected by Fast-Rotating Massive Stars (FRMS) during the phase of core H-burning (Decressin et al. 2007) or massive binaries (Bastian et al. 2013; Salaris & Cassisi 2014). In these cases, the timescale for the formation of the second generation must be of the order of a few Myrs or even less (Bastian et al. 2013; Salaris & Cassisi 2014; D’Antona et al. 2014).
In this work we present a method to set upper limits on the difference in age between the two populations of NGC 6352. For the first time, we estimate the relative age of two stellar populations in a normal GC, i.e. with no internal variation in [Fe/H]. Note that we are interested in measuring relative ages. The corresponding absolute ages should be only regarded as indicative (depending on the adopted distance modulus and reddening, as well as the reference model).
We consider a set of isochrones characterized by [Fe/H]= and [/Fe]=0.4, that are the values that best fit all the stars in the versus , as explained in Sect. 5.
We also used the versus CMD for computing the relative ages between the two populations, because in these filters the effect of light elements variation is not significant (Sbordone et al. 2011; Milone et al. 2012c). The MS turn-off is the classical age indicator of a simple stellar population. For this reason, we considered a region of the CMD around the MS turn-off of the two populations [panel (a) of Fig. 6]. We obtained fiducials and the associated errors in color and magnitudes (colored regions between dashed lines) for POPa (green) and POPb (magenta) using the same procedure described in Sect. 4.
In order to compute the relative age between the two populations, we treated POPa and POPb as simple stellar populations and measured their ages independently. The age of each population is estimated by comparing the observed versus CMD with a grid of synthetic CMDs with the same [Fe/H], [/Fe] and , and ages that run from 12000 Myr to 15000 Myr, in step of 50 Myr.
For each isochrone a synthetic CMD was built in this way: we obtained a first guess synthetic CMD by interpolating the isochrone on the observed magnitudes, in such a way that to each magnitude in the catalog of real stars is associated a color on the isochrone As second step, we broadened this synthetic CMD by adding to the color and magnitude of each synthetic star a random Gaussian error, with a dispersion equal to the error of the associated real star. The final result is a synthetic CMD, characterized by the same number of stars and a similar luminosity function to that of the observed CMD.
Panels (b) and (c) of Fig. 6 show an example of isochrones and corresponding synthetic CMDs. For each synthetic CMD we computed the fiducial line using the same procedure as for the observed data. For each step in age, we built synthetic simple stellar population CMDs, obtained the fiducial lines and computed the average of all the 100 fiducial lines in order to obtain the final synthetic fiducial line.
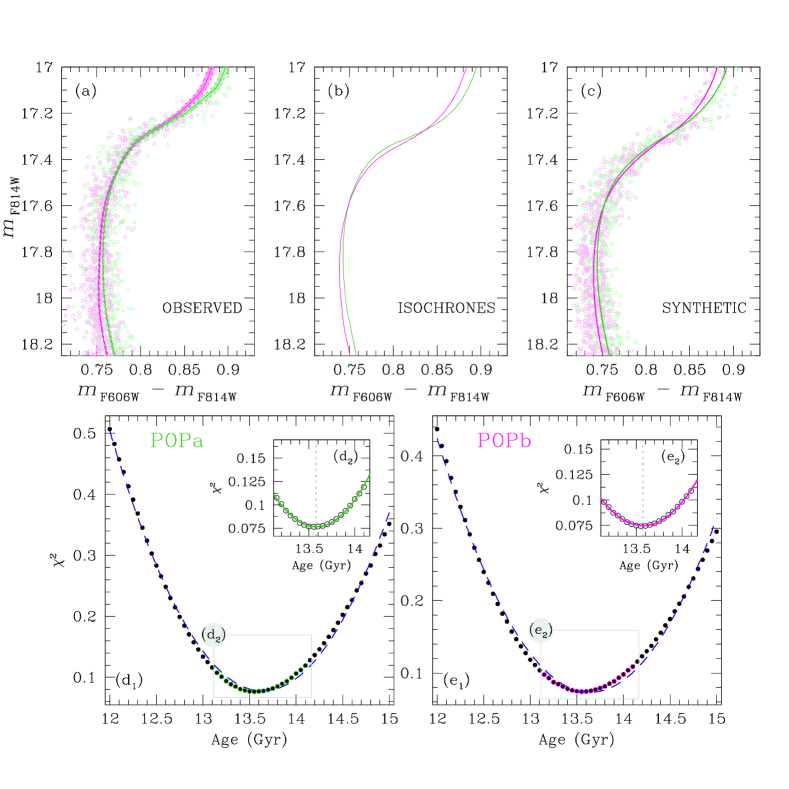
We compared the observed fiducial line of each population with the synthetic ones. This method is more robust than the direct comparison between the observed CMD and the isochrones, because we compared observed and theoretical fiducial lines which were computed in the same way and are affected by the same systematic errors introduced by the method (as, e.g., the error due to the smoothing). For each step in age, we calculated the of the best fit between the synthetic and the observed fiducial, in a magnitude interval . We fitted the as a function of the age with a second-order polynomial, in order to find the age that minimizes the . This fit was performed in two steps: first, we fitted all the points with a parabola to obtain a first-guess value of the age, , that minimizes the [panels (d1) and (e1) of Fig. 6]. Then we considered only the points inside an interval between Myr and Myr and fitted a new second-order polynomial [panels (d2) and (e2)] to find the best value that minimizes the .
We independently run this procedure for POPa and POPb. For POPa we used a set of isochrones calculated for [Fe/H], [/Fe] and , while for POPb we used isochrones with the same metallicity and -enhancement, but enhanced in helium by (i.e. with ) as obtained in Section 5. The best fit gives an age of Myr for POPa and Myr for POPb. We want to emphasize the fact that absolute ages are not significant in this context, and that we are interested only to relative ages. For this reason, hereafter we provide only relative ages. The age error is given by , where is the error due to photometric errors and is the error on the fit of the values.
The error due to photometry has been computed by performing the same analysis as described above and shifting the observed fiducial line in color by a quantity equal to and in magnitude by a quantity equal to . To estimate , we used the bootstrap re-sampling of the data to generate 1000 samples randomly drawn from the original data sets; for each sample, we calculated the age that minimize the as above described. Finally we computed the mean age and its standard deviation, and adopted the latter as the uncertainty in the fit. In conclusion, the two populations have a difference in age Myr.
Figure 6 shows the whole procedure: in panel (a) we plot the CMDs of POPa and POPb (light green and magenta) and their fiducial lines. In panel (b) the best-fit isochrones are plotted for each population; these are the isochrones for which the corresponding synthetic fiducials, shown in panel (c) with the synthetic CMDs, give the minimum . Panels (d) and (e) show the procedure adopted for the fit of the for POPa and POPb respectively. In panels (d1) and (e1) are shown the first guess fits (blue dashed lines), while in panels (d2) and (e2) show the final fits (green and magenta curves for POPa and POPb respectively). The vertical dashed lines represent the value of the age that minimizes the .
We performed the same analysis using CMDs with different color bases: and . These CMDs are characterized by larger photometric errors. We found Myr in the case of the vs. CMD, and Myr in the case of the vs. CMD. The results are consistent with what found using the versus , but errors due to photometric uncertainties are larger. For this reason we decided to carry out further analysis only using the vs. CMD.
We tested whether our results depend on the adopted magnitude interval for the fit. We iterated the procedure described above by changing the starting point of the magnitude interval between and , and the ending point between and , with steps of 0.05 mag. Within 50 Myr, we found no difference in the average age. Such age difference is consistent with zero within our measurement errors.
We tested our results using a different dataset of isochrones, to prove that results are independent from adopted models. We considered BaSTI isochrones (Pietrinferni et al. 2004, 2009) and we performed the same analysis described above. We obtained a difference in age between the two populations of Myr, in agreement with the results obtained previously.
There is some dispersion among the abundance measurements of NGC 6352 in the literature (see Feltzing, Primas & Johnson 2009 and discussion therein). Therefore, we re-iterated the same analysis using another set of isochrones with different [Fe/H] and [/Fe]. Following the spectroscopic results by Feltzing, Primas & Johnson (2009), we considered a set of isochrones with [Fe/H]= and [/Fe]=+0.2 and performed the same procedure as described above. We found for the two populations a slightly different relative age ( Myr). We thus confirm that the two populations have a difference in age within 110 Myr and that the adopted values of [Fe/H] and [/Fe] do not change our conclusions.
In addition to the photometric error, we also considered the uncertainty in , that in the previous section we estimated to be 0.006 dex (see Table 2). In order to estimate how this error affects the measure of , we iterated the same procedure previously described, using for POPa the same set of isochrones, and for POPb two additional sets of isochrones with the same [Fe/H]= and [/Fe]=+0.4 as for POPa, but with two different helium enhancements: and . We found that an error of 0.006 dex in translates into an uncertainty in of Myr.
The AGB and FRMS models predict that the stars of SG have the same [Fe/H] and [/Fe] of stars of FG, as observed in many GCs. Moreover the spectroscopic results by Feltzing, Primas & Johnson (2009) confirm that in NGC 6352 the stars of the two populations should have the same metallicity (within 0.02 dex). In any case, we also considered the cases in which POPb has different [Fe/H] or [/Fe] with respect to POPa, to study the impact of these variations on . As first test, we considered the case in which POPb has metallicity = , consistent with the results by Feltzing, Primas & Johnson (2009). We performed the procedure described above using for POPa a set of isochrones with [Fe/H]=, [/Fe]=0.4 and primordial helium, and for POPb [Fe/H]=, [/Fe]=0.4, and . We found that the relative age between the two populations is Myr. In the same way, we considered for POPb a set of isochrones with the same parameters, except the metallicity that we set at [Fe/H]=. In this case we found Myr Therefore, a variation on the metallicity of the second population of [Fe/H] dex translates in a variation on of Myr.
We then considered the impact of the -enhancement variations on the estimate of . Similarly to what was done already for the variations in metallicity, we considered a set of isochrones for POPa with [Fe/H]=, [/Fe]=0.4 and , and for POPb the same [Fe/H], enhanced in helium by and with respect to POPa. We found that a variation of [/Fe] dex leads to a variation on of Myr.
It is possible that POPa and POPb have different C+N+O abundances. Unfortunately, we are not able to directly verify the effects of C+N+O abundances variations on the estimate of . Marino et al. (2012a) presented a [Fe/H]-independent relation between the C+N+O variations and the age of a population . If the POPb is CNO-enhanced with respect the POPa, then POPb is younger compared to the case in which both populations have the same CNO abundances, and therefore is larger. However we note that the and magnitude and color on which our analysis is based are the least affected by C, N, O variations.
In Table 3 we provide a summary of all the uncertainties on introduced by the variation of the considered parameters.
| Parameter | Variation | |
| Photometry | Myr | |
| Myr | ||
| Fe/H | Myr | |
| Fe | Myr | |
| C+N+O | ||
7 Conclusions
In this paper we have presented an analysis of the CMDs and two-color diagrams from WFC3/UVIS F275W, F336W and F438W, and ACS/WFC F625W, F658N, F606W and F814W photometry.
We identified two stellar populations (named POPa and POPb), that, with appropriate combinations of magnitudes and colors, we could clearly distinguish on most of the evolutionary sequences of the CMD, from the MS, to the SGB, RGB, AGB, and HB.
Using a multi-color analysis method we have already applied to half a dozen of other GCs, we estimated a between the two populations.
We also developed a new procedure for evaluating the difference in age between the two populations hosted by NGC 6352. We considered the filter combinations that are the least affected by light-element variations. We studied the case in which POPa and POPb have the same [Fe/H], as inferred from high-resolution spectroscopy by Feltzing, Primas & Johnson (2009), but POPb has helium abundance enhanced by . We found that the two populations have a difference in age between the POPa and POPb of Myr, where the error includes the photometric error and the error on the fit. The error in leads to an error on the relative age of Myr, and a total error of 120 Myr. This is the best relative ages between the two populations we can estimate assuming that the two populations have the same [Fe/H] and [/Fe].
In the case that POPb has a different [Fe/H] content of 0.02 dex (as suggested by high-resolution spectroscopy by Feltzing, Primas & Johnson 2009), the relative ages would change by Myr. For a difference in [/Fe] of dex, we found a variation of Myr. As shown by Marino et al. (2012a), if POPb is CNO-enhanced then it must be younger since the turn-off brightness is the same. Differences in metallicity between two populations hosted by a normal GC, however, are not predicted by “AGB” and “FRMS” models of formation of multiple stellar populations and are also not observed for this cluster.
In literature, there are numerous works on the relative age of multiple stellar populations hosted by anomalous GCs for which a spread in metallicity is measured. Surely, the most controversial case is represented by Centauri. Sollima et al. (2008) identified four coeval populations with different metallicities and helium contents, while Villanova et al. (2014) identified a large spread in age for each population and found that the most metal-rich population also is the oldest one, concluding that Centauri is the result of a merger of two different progenitors. Marino et al. (2012b) found that the populations of M 22, characterized by different metallicities, are almost coeval within Myr. Lee et al. (2013) found that the GC NGC 2419 hosts two populations characterized by a large difference in [Fe/H], and with a relative age of about 2 Gyr. Roh et al. (2011) compared models and CMDs of NGC 288 to put constraints on the second stellar population hosted by this GC. They found that, in order to properly reproduce the observed CMDs, the second generation must be moderately metal enhanced by 0.16 dex, helium-enhanced by 0.03 dex, and younger by 1.5 Gyr than the first stellar generation.
The work we present in this paper is different from previous studies on the relative ages of multiple stellar populations in GCs, in the sense that this is the first attempt to measure relative ages within a multiple population GC with no observed signature of [M/H] dispersion. Assuming no difference in [Fe/H], [/Fe], and C+N+O content, the two populations of NGC6352 have a spread in age Myr. A combination of small differences in [Fe/H] and [/Fe] of 0.02 dex would rise the total uncertainty on the relative age to 280 Myr (within which the two populations are still coeval).
Acknowledgements
DN is supported by a grant “Borsa di studio per l’estero, bando 2013” awarded by “Fondazione Ing. Aldo Gini” in Padova (Italy). SC, SO, and GP acknowledge partial support by PRIN-INAF 2014. SO and GP acknowledge partial support by Progetto di Ateneo (Università di Padova) 2014. APM acknowledges support by the Australian Research Council through Discovery Early Career Researcher Award DE150101816.
References
- Anderson et al. (2008) Anderson J. et al., 2008, AJ, 135, 2114
- Bastian et al. (2013) Bastian N., Lamers H. J. G. L. M., de Mink S. E., Longmore S. N., Goodwin S. P., Gieles M., 2013, MNRAS, 436, 2398
- Behr (2003) Behr B. B., 2003, ApJS, 149, 67
- Bellini et al. (2010) Bellini A., Bedin L. R., Piotto G., Milone A. P., Marino A. F., Villanova S., 2010, AJ, 140, 631
- Carretta et al. (2009) Carretta E., Bragaglia A., Gratton R., D’Orazi V., Lucatello S., 2009, A&A, 508, 695
- Carretta & Gratton (1997) Carretta E., Gratton R. G., 1997, A&AS, 121, 95
- D’Antona et al. (2005) D’Antona F., Bellazzini M., Caloi V., Pecci F. F., Galleti S., Rood R. T., 2005, ApJ, 631, 868
- D’Antona et al. (2002) D’Antona F., Caloi V., Montalbán J., Ventura P., Gratton R., 2002, A&A, 395, 69
- D’Antona et al. (2014) D’Antona F., Ventura P., Decressin T., Vesperini E., D’Ercole A., 2014, MNRAS, 443, 3302
- Decressin et al. (2007) Decressin T., Meynet G., Charbonnel C., Prantzos N., Ekström S., 2007, A&A, 464, 1029
- D’Ercole et al. (2012) D’Ercole A., D’Antona F., Carini R., Vesperini E., Ventura P., 2012, MNRAS, 423, 1521
- D’Ercole et al. (2010) D’Ercole A., D’Antona F., Ventura P., Vesperini E., McMillan S. L. W., 2010, MNRAS, 407, 854
- di Criscienzo, D’Antona & Ventura (2010) di Criscienzo M., D’Antona F., Ventura P., 2010, A&A, 511, A70
- Dotter et al. (2008) Dotter A., Chaboyer B., Jevremović D., Kostov V., Baron E., Ferguson J. W., 2008, ApJS, 178, 89
- Dupree & Avrett (2013) Dupree A. K., Avrett E. H., 2013, ApJ, 773, L28
- Dupree, Strader & Smith (2011) Dupree A. K., Strader J., Smith G. H., 2011, ApJ, 728, 155
- Feltzing, Primas & Johnson (2009) Feltzing S., Primas F., Johnson R. A., 2009, A&A, 493, 913
- Gratton, Sneden & Carretta (2004) Gratton R., Sneden C., Carretta E., 2004, ARA&A, 42, 385
- Harris (1996) Harris W. E., 1996, AJ, 112, 1487
- King et al. (2012) King I. R. et al., 2012, AJ, 144, 5
- Kraft et al. (1993) Kraft R. P., Sneden C., Langer G. E., Shetrone M. D., 1993, AJ, 106, 1490
- Kurucz (1993) Kurucz R. L., 1993, SYNTHE spectrum synthesis programs and line data
- Kurucz & Avrett (1981) Kurucz R. L., Avrett E. H., 1981, SAO Special Report, 391
- Lee et al. (2013) Lee Y.-W. et al., 2013, ApJ, 778, L13
- Marino et al. (2012a) Marino A. F. et al., 2012a, ApJ, 746, 14
- Marino et al. (2014) Marino A. F. et al., 2014, MNRAS, 437, 1609
- Marino et al. (2012b) Marino A. F. et al., 2012b, A&A, 541, A15
- Marino et al. (2011) Marino A. F. et al., 2011, A&A, 532, A8
- Marino et al. (2008) Marino A. F., Villanova S., Piotto G., Milone A. P., Momany Y., Bedin L. R., Medling A. M., 2008, A&A, 490, 625
- Marks & Kroupa (2010) Marks M., Kroupa P., 2010, MNRAS, 406, 2000
- Milone et al. (2009) Milone A. P., Bedin L. R., Piotto G., Anderson J., 2009, A&A, 497, 755
- Milone et al. (2013) Milone A. P. et al., 2013, ApJ, 767, 120
- Milone et al. (2012a) Milone A. P., Marino A. F., Piotto G., Bedin L. R., Anderson J., Aparicio A., Cassisi S., Rich R. M., 2012a, ApJ, 745, 27
- Milone et al. (2015) Milone A. P. et al., 2015, MNRAS, 447, 927 (Paper II)
- Milone et al. (2012b) Milone A. P., Piotto G., Bedin L. R., Cassisi S., Anderson J., Marino A. F., Pietrinferni A., Aparicio A., 2012b, A&A, 537, A77
- Milone et al. (2012c) Milone A. P. et al., 2012c, ApJ, 744, 58
- Mucciarelli et al. (2014) Mucciarelli A., Lovisi L., Lanzoni B., Ferraro F. R., 2014, ApJ, 786, 14
- Nardiello et al. (2015) Nardiello D., Milone A. P., Piotto G., Marino A. F., Bellini A., Cassisi S., 2015, A&A, 573, A70
- Norris & Da Costa (1995) Norris J. E., Da Costa G. S., 1995, ApJ, 441, L81
- Pasquini et al. (2011) Pasquini L., Mauas P., Käufl H. U., Cacciari C., 2011, A&A, 531, A35
- Pietrinferni et al. (2004) Pietrinferni A., Cassisi S., Salaris M., Castelli F., 2004, ApJ, 612, 168
- Pietrinferni et al. (2009) Pietrinferni A., Cassisi S., Salaris M., Percival S., Ferguson J. W., 2009, ApJ, 697, 275
- Piotto et al. (2007) Piotto G. et al., 2007, ApJ, 661, L53
- Piotto et al. (2012) Piotto G. et al., 2012, ApJ, 760, 39
- Piotto et al. (2015) Piotto G. et al., 2015, AJ, 149, 91 (Paper I)
- Roh et al. (2011) Roh D.-G., Lee Y.-W., Joo S.-J., Han S.-I., Sohn Y.-J., Lee J.-W., 2011, ApJ, 733, L45
- Salaris & Cassisi (2014) Salaris M., Cassisi S., 2014, A&A, 566, A109
- Sarajedini et al. (2007) Sarajedini A. et al., 2007, AJ, 133, 1658
- Sbordone et al. (2004) Sbordone L., Bonifacio P., Castelli F., Kurucz R. L., 2004, Memorie della Societa Astronomica Italiana Supplementi, 5, 93
- Sbordone et al. (2011) Sbordone L., Salaris M., Weiss A., Cassisi S., 2011, A&A, 534, A9
- Silverman (1986) Silverman B. W., 1986, Density estimation for statistics and data analysis
- Sollima et al. (2008) Sollima A., Ferraro F. R., Pancino E., Bellazzini M., 2008, Mem. Soc. Astron. Italiana, 79, 342
- Villanova et al. (2014) Villanova S., Geisler D., Gratton R. G., Cassisi S., 2014, ApJ, 791, 107
- Villanova et al. (2012) Villanova S., Geisler D., Piotto G., Gratton R. G., 2012, ApJ, 748, 62
- Villanova, Piotto & Gratton (2009) Villanova S., Piotto G., Gratton R. G., 2009, A&A, 499, 755
- Yong & Grundahl (2008) Yong D., Grundahl F., 2008, ApJ, 672, L29
- Yong et al. (2014) Yong D. et al., 2014, MNRAS, 441, 3396