Star formation rates in isolated galaxies selected from the Two-Micron All-Sky Survey
Abstract
We have considered the star formation properties of 1616 isolated galaxies from the 2MASS XSC selected sample (2MIG) with the FUV GALEX magnitudes. This sample was then compared with corresponding properties of isolated galaxies from the Local Orphan Galaxies catalogue (LOG) and paired galaxies.
We found that different selection algorithms define different populations of isolated galaxies. The population of the LOG catalogue, selected from non-clustered galaxies in the Local Supercluster volume, mostly consists of low-mass spiral and late type galaxies. The upper limit in isolated and paired galaxies does not exceed the value of dex(-9.4). This is probably common for galaxies of differing activity and environment (at least at z0.06). The fractions of quenched galaxies are nearly twice as high in the paired galaxy sample as in the 2MIG isolated galaxy sample. From the behaviour of vs. relations we deduced that the characteristic value influencing evolutionary processes is the galaxy mass. However the environmental influence is notable: paired massive galaxies with log11.5 have higher than isolated galaxies. Our results suggest that the environment helps to trigger the star formation in the highest mass galaxies. We found that the fraction of AGN in the paired sample is only a little higher than in our isolated galaxy sample. We assume that AGN phenomenon is probably defined by secular galaxy evolution.
keywords:
Galaxies: general, evolution, star formation, active1 Introduction
Recent observational and theoretical results have shown that a peak of the star formation rate () appears between z 2-3, decreasing to the present epoch (Bouwens et al. 2011, Burgarella et al. 2013, Behroozi et al. 2013 and references therein). This is likely due to the fact that evolution of bimodality in colour distribution is clearly observed, showing that the fraction of red massive (i.e. early type) galaxies with quenched star formation is higher at z 0 than in the earlier epochs. Star formation rate also depends on the environmental density, assuming that quenching of star formation is more efficient in high density regions (Cucciati et al. 2006, Scoville et al. 2013, Tal et al. 2014).
Meanwhile, the dominant factor of quenching is different for the high mass (central) and low mass (satellite) galaxies. According to findings by Peng et al. (2010, 2012), the former galaxies preferred the self-regulated “mass quenching”, while quenching in latter galaxies occurred mainly due to environmental and/or merging influence (see also Tinker et al. 2013, Tal et al. 2014, Wetzel et al. 2014). However, the physical mechanisms of internal “mass quenching” are still under discussion. It would appear that active galactive nuclei (AGN) feedback is the dominant regime for internal mass quenching. Occurring in high mass galaxies, it consists in kinematic outflows (winds) from the accretion disk surrounding the black hole. This removes the cold gas from the galaxies, terminating the star formation. The theoretical underpinnings of the importance of this process are described by Khalatyan et al. (2008), Dubois et al. (2013) and others. The observational evidence is summarized in Fabian (2012), see also a statistical study by Lemaux et al. (2013). It is also noted that radio feedback observed in radio-loud AGN plays an important role in the host galaxy star formation quenching, see for example Croton et al. (2006). For example, Schawinski et al. (2014) argues in a that AGN feedback is a key factor accompanying spiral galaxy merging for quenched elliptical galaxy formation. Apparently this process could explain a formation of isolated/void early type galaxies, where an influence of environment is minimal (Croton & Farrar 2008). It is thought that AGN feedback influence could also be positive, triggering star formation on shorter timescales (Zinn et al. 2013, Zubovas 2013). In addition to minor and major mergings, the processes of ram pressure stripping, harassment and strangulation facilitate environmental quenching. Relatively slow strangulation, where a galaxy loses its gas due to tidal effects produced by the gravitational potential of the group/cluster seems to be a more effective quenching mechanism than others (van den Bosch et al. 2008, Taranu et al. 2014).
An effective method for the study of environmental impact upon galaxy evolution is to compare the properties of galaxies from dense environments with corresponding properties of isolated galaxies, i.e. objects that have not been appreciably affected by an external influence of their environments for at least a few Gyr (see Verley et al. 2007, Karachentseva et al. 2010). This has been confirmed by comparison between modelling results and observations, revealing that properties of isolated galaxies have been mainly influenced by internal processes. Hirschmann et al. (2013) showed that only 45% of isolated galaxies have experienced at least one merger event in the past (most of the mergers are minor, with mass ratios between 1:4 and 1:10). More results and discussions on the small satellites search and their influence on isolated galaxy properties can be found in works by Verley et al. (2007), Karachentseva et al. (2011), Argudo-Fernandez et al. (2013) and Melnyk et al. (2014).
We note that the isolated galaxies are objects selected in projection on the sky or in velocity (3D) space with basic criteria of ”no significant companions” in a given volume (examples of the different approaches can be found in the works by Karachentseva 1973, Varela et al. 2004, Allam et al. 2005, Elyiv et al. 2009, Karachentseva et al. 2010, Karachentseva et al. 2010a, Hernandez-Toledo et al. 2010, Karachentsev et al. 2011).
This is the main difference between isolated galaxies and “non-clustered” or “field” galaxies. These are objects located outside of groups and clusters (de Vaucouleurs 1971, Turner & Gott 1977, Makarov & Karachentsev 2011, Karachentsev et al. 2012), in addition to void galaxies, selected as objects residing in low density regions (Rojas et al. 2004, Sorrentino et al. 2006, Patiri et al. 2006, von Benda-Beckmann & Muller 2008, Hoyle et al. 2012, Kreckel et al. 2012, Elyiv et al. 2013).
The most discussed sample of isolated galaxies is the Catalogue of Isolated Galaxies (Karachentseva 1973, KIG). 111The catalogue is known as KIG in Russian transcription but the abbreviation CIG is also widely used. The catalogue includes 1050 galaxies with and , i.e. 4% in the CGCG catalogue (Zwicky et al. 1961-1968). The largest contribution to the analysis of the KIG properties was done by the AMIGA team, with their most important results in Verley et al. (2007), Lisenfeld et al. (2007, 2011), Durbala et al. (2008), Leon et al. (2008), Sabater et al. (2008, 2012), Fernandez Lorenzo et al. (2012) and Argudo-Fernandez et al. (2013).
In Karachentseva et al. (2010) we applied slightly modified Karachentseva (1973) isolation criteria to the Two Micron All-Sky Survey Extended Source Catalog (2MASS XSC; Jarrett et al. 2000) to compile the sample of near-infrared isolated galaxies (2MIG; see details in the next section). The properties of galaxies from the 2MIG catalogue have been investigated in several works. Karachentseva et al. (2011) estimated the orbital masses and mass-to-luminosity ratios of isolated galaxies with faint companions. It was shown that these companions have a weak influence on the dynamic isolation of the 2MIG galaxies. Kudrya et al. (2011) considered the statistical relations between different observational characteristics while Kudrya & Karachentseva (2012) constructed the Tully-Fisher relations for the 2MIG galaxies. Coziol et al. (2011) made an extensive analysis of AGN impact in the 2MIG sample, concluding that this AGN phenomenon is closely connected with the internal factor of galaxy evolution. Pulatova et al. (2015) reached a similar conclusion, making a multiwavelength analysis of 36 2MIG galaxies displaying AGN. Anderson et al. (2013) investigated a large sample of X-ray selected 2MIGs observed with ROSAT, reporting an extended emission presence around a significant part of the isolated galaxy sample. Melnyk et al. (2014) considered the near-infrared and optical colours of the 2MIG galaxies, comparing them with corresponding colours of galaxies located in denser regions. It was found that in general, 2MIG galaxies have a bluer colour than galaxies in pairs/groups, except the most compact pairs which are a little bluer than the 2MIGs, possibly due to recent merging events.
In this paper we also consider the Local Orphan Galaxies catalogue (LOG; Karachentsev et al. 2011), which was compiled from the field (non-clustered) galaxies within the Local Supercluster volume by applying the isolation criteria used by Karachentseva (1973). Applying the KIG isolation criterion to the flux-limited CGCG galaxy catalogue, Karachentseva (1973) selected 4% isolated galaxies. The use of the slightly modified KIG criterion to the 2MASS XSC catalogue (also flux-limited) giving 6% isolated galaxies. Essentially, we assume that isolated galaxies exist but are not numerous. When compiling the LOG catalogue (volume-limited) we took these percentages into account and fixed the 5% level as typical for isolated galaxies.
Karachentsev et al. (2013) studied the star formation properties of the LOG galaxies and found that the specific star formation rate () upper limit does not exceed the value of log = -9.4 []. This agrees with the corresponding upper limits for the galaxies from the Local Universe located in different environments (Karachetsev & Kaisina 2013) and for galaxies of different activity types in the Markarian sense (Karachentseva et al. 2014).
The current paper is a continuation of our previous investigations of basic properties of the 2MIG isolated galaxy sample, focusing upon the properties. We aim to develop a better understanding of the level of the star formation in the Local Universe. We define this as and vs. stellar mass and other relations for the 2MIGs and compare them with corresponding relations for the LOG isolated galaxy population, compiled from a different primary sample with different selection conditions. We also study the environmental influence on star formation quenching/triggering, comparing the 2MIG properties with those of galaxies from the wide/compact pairs.
In Section 2 we present the isolation criteria for the 2MIG and LOG samples selection and describe data used in the paper. In Section 3 we discuss the star formation properties of the 2MIG and LOG isolated galaxies. The results of a comparison of the basic relations and AGN contamination for isolated and paired galaxies are given in Section 4. In Section 5 we give a summary of our results and the main conclusions.
2 The data
2.1 The 2MIG catalogue
The 2MIG entire sky catalogue of isolated galaxies (Karachentseva et al. 2010) was selected from 1.6 million objects of the 2MASS XSC (Jarrett et al. 2000). Selection of objects was performed twice:
(i) automatically according to the original criteria of isolation by Karachentseva (1973) adapted to the 2MASS data:
| (1) |
and
| (2) |
where subscripts “1” and “i” refer to the fixed galaxy and its neighbours, respectively. Essentially, a galaxy with a standard angular diameter is considered to be isolated if its angular separation from all its neighbours with “significant” angular diameters inside interval (2) is equal to or exceeds 30.
(ii) visual inspecting of the images (DSS1,2222Digital Sky Survey: http://archive.eso.org/dss/dss and SDSS333Sloan Digital Sky Survey: http://www.sdss.org) of all isolated candidates to identify visible neighbours. Visual inspection allowed us to physically eliminate multiple systems with blue neighbours missed in the automatic selection (see details in Karachentseva et al. 2010). Finally, the 2MIG catalogue consists of 3227 galaxies brighter than = 12 mag and with angular diameters 30′′. We found approximately 6% of isolated galaxies among the 51572 extended sources of the 2MASS XSC survey.
In total, 2869 from the 3227 2MIG galaxies have radial velocities according to the NED444NASA/IPAC Extragalactic Database:
http://ned.ipac.caltech.edu and HyperLeda555Database for physics of galaxies: http://leda.univ-lyon1.fr/ (Paturel et al. 2003).
databases. We removed 23 galaxies from the 2MIG list due to the presence of significant companions in their
neighbourhood, or otherwise their protometry was contaminated by a projected star: 2MIG90, 174, 243, 320666In this work
2MIG320=NGC1050 is still a part of our sample since we found a significant satellite when the text of the paper was finalized., 586, 1137, 1172, 1548, 1809, 1819, 1822, 1949,
1970, 1988, 2242, 2243, 2249, 2285, 2585, 2976, 2989, 3143, 3193, 3201. Therefore, in this paper we consider only 1616 isolated galaxies
having FUV magnitudes (see next subsection). The morphological types of galaxies in the paper correspond to the digital scale:
-2 – E, 0 – S0, 1 – S0a/Sa, 2 – Sab, 3 – Sb, 4 – Sbc, 5 – Sc, 6 – Scd, 7 – Sd, 8 – Sdm, 9 – Im, 10 – Ir. We note that
near 7% of the catalogue galaxies have different morphologies in comparison to the types noted in primary 2MIG catalogue
(Karachentseva et al. 2010). These morphological types were revised
according to SDSS DR10 images and the classification used by Coziol et al. (2011), see also Melnyk et al. (2014).
2.2 The LOG catalogue
The isolated galaxies for the LOG list were selected from the primary catalogue of 11000 galaxies within the volume of the Local Supercluster 3500 km/s at the Galactic latitudes . At first, only galaxies from the primary galaxy catalogue of the virialized groups were selected. For that, Makarov & Karachentsev (2011) used a modified percolation method. This takes into account the individual characteristics of galaxies and the following conditions:
| (3) |
where is the velocity difference between two galaxies, is the corresponding projected distance, is the gravitational constant and is the total mass of the pair. Each galaxy mass was calculated using condition , is the 2MASS band luminosity while =6 is the empirical coefficient. The condition (3) means that a total energy of the physical pair must be negative and supplemented by condition (4), according to which the pair of components should remain within the sphere of ’zero-velocity’:
| (4) |
where is the Hubble constant. All the pairs satisfying conditions (3) and (4) with a common main component were combined into a group. Therefore, a primary sample of 11000 galaxies was divided into “clusterized” galaxies, i.e. 54% are located in virialized groups, and “non-clusterized” galaxies. The candidates for isolated galaxies were chosen by application of the clusterization algorithm to all galaxies with empirical coefficient 40=240. If, at this strong condition, a galaxy still remained “non-clustered” it was considered as a candidate to the isolated one (see more details in Karachentsev et al. 2011). Among 990 isolated candidates, the true isolated galaxies were chosen by application of the Karachentseva (1973) selection criteria, i.e. visual inspection of all targets and their environments. As a result, the LOG catalogue consists of 520 isolated galaxies, 3 of which were excluded as non-isolated (Karachentsev et al. 2013). In this paper we consider 428 LOG galaxies with measurements (see subsection 2.3).
|
 |
 |
2.3 The photometry and formulas
The current 2MIG and LOG samples consist of 1616 and 428 galaxies, respectively. These samples were observed with the GALEX
telescope777Galaxy Evolution Explorer: http://www.galex.caltech.edu/ in far ultraviolet
(, = 1539 Å, FWHM = 269 Å) wavelength. The photometry was taken
from the GALEX pipeline All-Sky catalogue888http://galex.stsci.edu/GR6/;
http://galex.stsci.edu/GalexView/,
while the photometry for the nearest large diameter galaxies were taken from Gil de Paz et al. (2007),
Karachentsev, Makarov & Kaisina (2013) and Karachentsev et al. (2013).
Since UV wavelengths are direct tracers of young, massive stars and FUV flux is one the most reliable indicators of the
(Lee et al. 2009), the global rate of star formation in a galaxy, , was calculated according to Kennicutt et al. (1998;
see also Salim et al. 2007, Lee at al. 2009):
| (5) |
where is expressed in erg s-1 Hz-1.
It is known that mid-infrared (IR) emission is an indirect tracer of . This is due to re-emmission starlight on small-grain dust
(for details see review by Calzetti 2012). We took into account the IR impact into using the WISE999Wide field Infrared Survey
Explorer:
http://irsa.ipac.caltech.edu/applications/wise/
W4 (22 m) mid-IR band from the pipeline
catalogue. At first we calculated calibrated by Jarrett et al. (2013):
| (6) |
We then defined the total (FUV+IR) star formation rate, as in Jarrett et al. (2013):
| (7) |
Since the stellar population of galaxies has an average mass-to-luminosity ratio in the -band M/L1 (Bell et al. 2003, see also Jarrett et al. 2013), the stellar masses of galaxies were derived from luminosity. A similar approach was also applied in previous works by Karachentsev, Makarov & Kaisina (2013) Karachentsev & Kaisina (2013), Karachentsev et al. (2013) and Karachentseva et al. (2014) with which we compare our results101010In the listed papers the -band galaxy magnitudes were derived from -band corresponding magnitudes. This was due to underestimation of magnitudes for very local big size objects in the 2MASX catalogue. However, the total magnitude estimation gives a slightly larger masses than using -band. We therefore keep in mind that calculation of the masses using -band calibration includes larger masses for the 2MIG galaxies in 0.1-0.2dex. In other words, from Fig. 2, it follows that if the stellar masses for the LOG galaxies were calculated from total, their masses would be shifted further to the low end of the mass function.. In this work we used the total -band magnitudes from 2MASX catalogue, the absolute magnitude of Sun is 3.32 (Jarrett et al. 2013).
The specific star formation rate is a per mass unit, expressed in :
| (8) |
 |
 |
Galactic extinction for and bands was calculated using values according to the Schlegel et al. (1998) maps and the Cardelli et al. (1989) extinction law where =3.1. Internal absorption in galaxies was taken into account with values of 0.085 and 1.93 for and bands respectively. The coefficients were taken from Karachentsev, Makarov & Kaisina (2013) and the value of – the internal galaxy extinction in -band taken from the Hyperleda. The WISE W4 band was neither corrected for neither Galactic nor internal extinctions.
The hydrogen mass of the galaxy was calculated using the formula from Roberts & Haynes (1994):
| (9) |
where is expressed in solar masses, in Mpc, is a galaxy radial velocity corrected for the motion of the Local Group centroid with apex parameters taken from Karachentsev & Makarov (1996) and =72 km s. The flux in Jy km was calculated as log=0.4, where is a magnitude corrected for galaxy inclination taken from the Hyperleda. The data was available only for 663 2MIG galaxies (41%) and 389 LOGs (91%) of the samples with FUV data.
The evolutionary state of the galaxy was characterized by the dimensionless parameters (Past) and (Future) proposed by Karachentsev & Kaisin (2007):
| (10) |
| (11) |
It should be noted that the parameter represents taken over the entire age of the Universe, = 13.7 Gyr. The parameter corresponds to the notion of gas depletion time, expressed in units of . The coefficient 1.85 at takes into account the contribution of helium and molecular hydrogen to the total mass of the gas (Fukugita & Peebles 2004).
Throughout the paper, the 2MASX and the WISE W1 (3.4 m), W2 (4.6 m), W3 (12 m) and W4 (22 m) magnitudes are in the Vega system, except cases where the AB magnitude system is specified. The GALEX magnitudes are always in the AB system.
3 Star formation properties of isolated galaxies from the 2MIG and LOG samples
3.1 Types and masses
| Sample | log, [M⊙/yr] | log, [M⊙/yr] | log, [yr-1] | log, [yr-1] | |||||
|---|---|---|---|---|---|---|---|---|---|
| N | MeanSD | MedianQ | MeanSD | MedianQ | MeanSD | MedianQ | MeanSD | MedianQ | |
| All | 1616 | -0.380.71 | 0.21 | -11.260.80 | -11.13 | -0.040.61 | 0.08 | -10.920.65 | -10.78 |
| E | 470 | -1.040.71 | -1.08 | -12.050.70 | -12.15 | -0.510.68 | -0.52 | -11.510.68 | -11.65 |
| M | 969 | -0.100.50 | -0.01 | -11.040.53 | -10.97 | 0.190.43 | 0.23 | -10.750.44 | -10.69 |
| L | 177 | -0.140.53 | -0.06 | -10.420.55 | -10.40 | -0.040.51 | 0.02 | -10.320.47 | -10.34 |
| Q | 341 | -1.420.47 | -1.41 | -12.490.33 | -12.50 | -0.790.55 | -0.82 | -11.860.49 | -11.95 |
| nQ | 1275 | -0.100.46 | -0.05 | -10.940.52 | -10.93 | 0.160.44 | 0.21 | -10.670.43 | -10.65 |
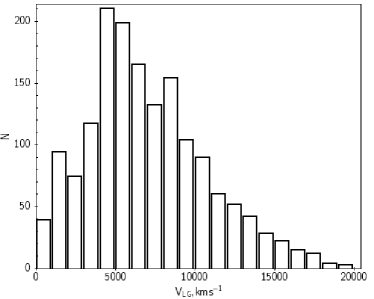
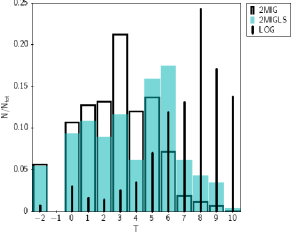
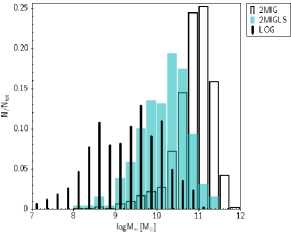
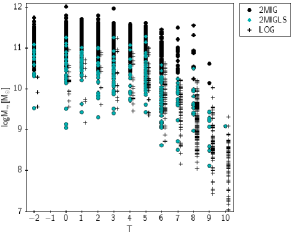
In this section we describe the basic sample distributions of the 2MIG galaxies in comparison with the LOG isolated galaxy catalogue. These were selected from totally different galaxy samples applying different selection algorithms (see subsections 2.1 and 2.2.). Fig. 1 presents the radial velocity distribution of the 2MIG sample. Note that the LOG sample is limited by the Local Supercluster (LS) volume 3500 km/s. Fig. 2 compares the 2MIG’s and LOG’s morphological type and stellar mass distributions (on the left and middle panels, respectively) and dependence of stellar mass on galaxy morphological type (on the right). We also show in Fig. 2 the same dependences for the 2MIG sample in the same volume as the LOG samples (2MIG LS). As can be seen, the galaxies in the LOG catalogue have significantly latter morphological types than the 2MIG galaxies. They are up to two-orders of magnitude less massive than the 2MIG galaxies even within the same morphological type.
We see that different selection algorithms applied to 2D and 3D primary samples define different populations of isolated galaxies. The population of the LOG galaxies mostly consists of low mass spiral and late type galaxies which are preferably located in globally low density regions, in particular in voids (Elyiv et al. 2013). The population of the 2MIGs, in contrast, is totally different: it consists of normal mass, companion-less galaxies of predomintantly early type spirals. These are located in local regions of low density. From Fig. 2, follows that galaxies in the volume limited 2MIG LS sample are significantly massive that the LOG galaxies. Moreover, we have only 16 coincident 2MIG LS-LOG galaxies (6% from the 2MIG LS sample).
3.2 Star formation rates and neutral hydrogen fraction
 |
 |
 |
 |
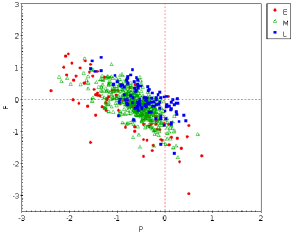 |
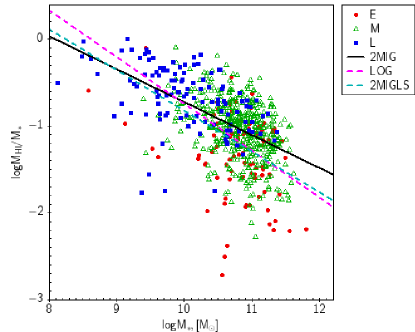
Fig. 3 (left panel) shows the fraction of neutral hydrogen as a function of stellar mass. The fraction of neutral hydrogen increases with decreasing galaxy mass. The lines represent the linear regressions for three samples 2MIG, LOG and 2MIG LS. We see that all slopes are similar, however the relation for the 2MIG sample is flatter because of a smaller fraction of galaxies with high fraction of neutral hydrogen and high fraction of galaxies with moderate and higher stellar masses. The slope for the 2MIG LS sample is a somewhat steeper. The E, M and L morphological type division has the effect of separating the total morphological scale into 3 groups: early type galaxies (E) -2 – 1, spiral “middle” types (M) 2–5 and late types (L) 6–10. In total, 20%, 47% and 66% of our E, M and L galaxies, respectively, are detected in HI meaning that these galaxies are still have significant gas reservoirs. Note, that only 663 2MIG galaxies and 389 LOG galaxies in the Hyperleda have HI measurements, 41% and 91% from the total numbers, respectively.
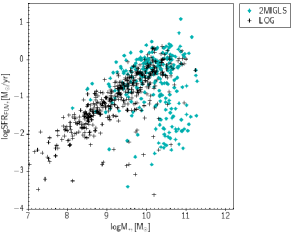
On the right panel of Fig. 3 we plotted the star formation rate (FUV) as a function of hydrogen mass for the 2MIG galaxies. The line represents the well-known Schmidt-Kennicutt law with slope =3/2 (Kennicutt 1998). We see that galaxies of all types are located very symmetrically, however the scatter for early type galaxies are larger. The existence of early type galaxies with high and small hydrogen mass may tell us that their UV light may originate not only from the young stars.
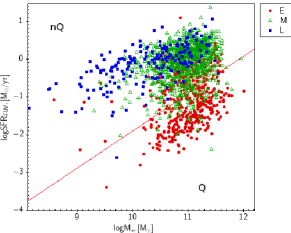
Fig. 4 presents the star formation rate as a function of stellar mass for the 2MIG LS and LOG samples (left panel) and full 2MIG sample with E, M and L united morphological type division (middle panel). The right panel the same, excepting that total star formation rate calculated by formula (7). This was done using a linear combination of and . From the comparison of the LOG and 2MIG LS samples we conclude that the LOG population “completes” log vs. logM∗ main sequence to the low mass end. In each figure we clearly see the separation between two concentrations: the main sequence and so called “quenched” or “red and dead” galaxies. We will refer to these concentrations as to non-quenched (nQ) and quenched (Q) galaxies in order to have a non-visual classification. The border between these two regions may be roughly defined as (AB)=6.6 and is marked by the red line in Figs. 4 and 8. The nQ concentration consists of mainly M and L galaxies (85%), however the Q concentration is formed predominantly by E galaxies (82%), according to our visually defined types. In total, 95% of our M+L galaxies are located on the main sequence and, correspondingly, only 5% of them are quenched. Meanwhile, 60% of E type galaxies are located in the Q region while the rest, 40%, are main sequence, i.e. still show signs of star formation. This is confirmed by the fact that at least 33% of E type galaxies in nQ region are detected in HI (49% of all nQ galaxies have HI detections), while only 10% of E type galaxies in the Q region still have neutral hydrogen (11% of all Q galaxies have HI detections). According to Schawinski et al. (2014) this evidences the fact that star formation of elliptical galaxies was quenched rapidly by rapid removal of the gas, contrary to spiral/late type galaxies. In this case, star formation halted far slower due to gradual gas loses driven by secular and/or environmental processes.
3.3 vs.
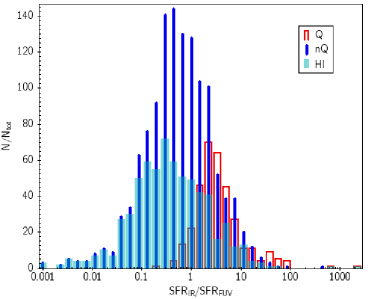
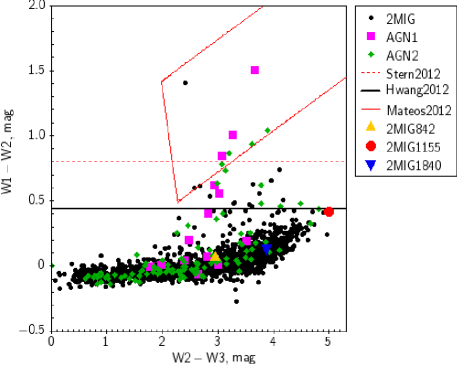
Table 1 represents the mean and median values of log, log, log and log for the full 2MIG sample and its varying sub-samples. It follows from Table 1 that the ratio between calculated from and using (7), and is somewhat different for E, M, L, Q and nQ types: 3.4, 1.9, 1.3, 4.3 and 1.8 times, respectively. The distributions of ratio / for Q, nQ and HI-detected galaxies are shown in Fig. 5. Apparently, our Q (i.e also E) galaxies have higher ratios of / than the other types. Normally, the ellipticals do not contain much dust, except for giant elliptical galaxies as a result of mergers. However, the mid-IR emission in early type galaxies can contain a large contribution (an order of magnitude stronger) from intermediate-age and older stellar populations than from the young stars (see references in Salim et al. 2012, Calzetti et al. 2012 and Jarrett et al. 2013). In Table 2 we show some characteristics of galaxies from the 2MIG sample with the highest ratios of /50. We see that only a few galaxies have SDSS spectra. However, 2MIG417 and 2MIG1573 have AGN according to the NED. Moreover, these galaxies have high W1-W2 (WISE) IR colours that allow them to be considered as having bright IR AGN (see subsection 4.2 for the details). 2MIG1155 is a very local galaxy with an enormously high /2689 ratio. The WISE W4 magnitude (0.482) agrees with Hershel 24 m MIPs measurement (5.2 Jy, Bendo, Galliano & Madden 2012). The galaxy also contains a small fraction of neutral hydrogen. We assume that 2MIG1155 could be a starburst due to the value of =-9.58 yr-1 and by taking into account its location on colour-colour plot in Fig.12 (starburst region, Jarrett et al. 2011). In general, all galaxies listed in Table 2 are located in or near that region: see for example the localization of 2MIG1840 and 2MIG842 in Fig. 12 (second and third galaxy with the highest levels of /).
We also note that 2MIG2024 is probably a starforming galaxy in outgoing merging with a moderate =-10.19 yr-1. This is also confirmed by its SDSS spectrum. 2MIG1142, 2MIG1443, 2MIG1840 and 2MIG1987 have signs of disturbance and/or visible small satellites. These could have weak influence on main galaxy properties (Karachentseva et al. 2011, Melnyk et al. 2014).
With current data, we are not able to assert the starforming/starburst origin of high IR emission in all early type galaxies, neither may we exclude the AGN origin of IR emission due once again to insufficient data. We have assumed that the values are more reliable for the spiral galaxies since they normally contain dusty, i.e. starforming, regions, contrary to the early type galaxies.
We therefore present both values of log/log and log/log throughout the paper which show, in general, the same tendencies as in the graphs.
| 2MIG | Name | T | log | log, [] | / | AGN | AGNW1-W2 | Comment |
|---|---|---|---|---|---|---|---|---|
| 87 | MCG-02-03-004 | 0 | – | 0.29 | 99 | – | 0.07 | n3 |
| 417 | MCG-02-09-040 | 0 | – | 0.51 | 96 | Sy2, NED | 0.62 | n |
| 428 | 2MASXJ03304719-6747056 | 0 | – | -0.21 | 92 | – | 0.11 | n |
| 722 | ESO159-019 | 0 | – | -0.07 | 54 | – | 0.17 | n |
| 842 | ESO206-013 | 3 | – | 0.17 | 430 | – | 0.06 | n |
| 1142 | MCG-03-22-002 | 1 | – | -0.15 | 55 | – | 0.05 | disturbed? |
| 1155 | ESO495-021 | -2 | -1.26 | -0.05 | 2689 | – | 0.42 | compact, starburst? |
| 1443 | CGCG266-050 | 0 | – | 0.44 | 96 | n | 0.15 | dusty, disturbed?, 2 sat?4 |
| 1573 | 2MASXJ11240275-2823155 | 3 | – | 0.32 | 74 | AGN, NED | 1.51 | n |
| 1840 | IC0860 | 0 | -2.72 | 0.72 | 812 | n | 0.14 | 1 small sat + 2 sat? |
| 1987 | UGC09307 | 2 | – | 0.47 | 62 | TO1 | 0.23 | 1 small sat |
| 2024 | CGCG273-026 | 1 | – | 1.14 | 58 | SF2 | 0.25 | major merging |
| 2412 | UGC10926 | 2 | – | 0.26 | 50 | – | 0.13 | 1 small sat projection |
1Transition object, located upon the border of a starburst galaxy and AGN, according to Coziol et al. (2011)
2Starforming galaxy according to the SDSS.
3 “–” means no data, “n” means no AGN or no special comment on appearance of the object.
4 “sat?” Small satellite without radial velocity (projected on the sky).
3.4 Specific star formation rates
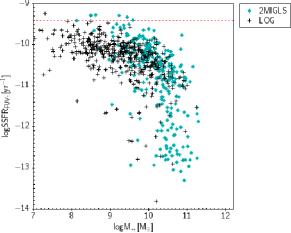
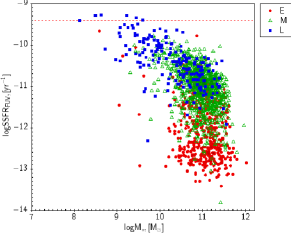
Fig. 6 presents the specific star formation rate, calculated by formula (8), as a function of stellar mass for the same samples as in Fig. 4. We see that only 5 galaxies have a little larger log than -9.4. All of these objects are very local galaxies with 600 km/s: 2MIG405=NGC1311, 2MIG646=NGC1744, 2MIG1699=UGC07321, 2MIG1724=NGC4395111111Pulatova et al. (2015) argued about a presence of the significant companions in the neighbourhood of NGC4395 that preclude it from being considered isolated.. In addition, 2MIG1741=UGC07699 the catalogue magnitude could be underestimated due to a large diameter (2.5 arcmin). It is interesting that not one of these galaxies is a member of the LOG catalogue. We see that the threshold of log for 2MIG galaxies is near dex(-9.4) [-yr-1]. This agrees with results obtained by Karachentsev & Kaisina (2013) and Karachentsev et al. (2013) for the local normal galaxies.
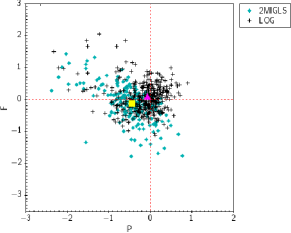
Fig. 7 shows Future vs. Past diagnostic diagram for the LOG and 2MIG LS samples (left panel) and for the full 2MIG sample (right panel). In Table 3 we compared the mean with standard deviation () and median in the quartile range () values of these parameters for the full 2MIG sample and its sub-samples.
According to formulas (10-11) P and F parameters are dimensionless. The result is that the galaxy with coordinates =0 and =0 is able to reproduce its stellar mass during the Hubble time at the currently observed star formation rate. It follows that, the reserves of gas are sufficient to support the observed during a second Hubble time. It follows from the left panel of Fig. 7 (see also Karachentsev et al. 2013) that only half of the LOGs’ gas reserves are dissipated. In general, the value of the parameter for the 2MIG LS galaxies is lower than one for the LOGs. As a result, the average current star formation rate is able to reproduce only a part (1/2) of their stellar mass over a time . Thus, in past epochs the star formation rate of the 2MIG galaxies was somewhat higher. In particular, L-type galaxies have almost the same amount of gas as LOGs during present epochs. However the gas fraction in M and E type galaxies is much smaller and will be consumed over less time than .
| Sample | P | F | |||
|---|---|---|---|---|---|
| N | Mean | Median | Mean | Median | |
| All | 663 | -0.620.47 | -0.58 | -0.140.54 | -0.12 |
| E | 92 | -0.830.71 | -0.67 | -0.270.81 | -0.22 |
| M | 455 | -0.630.40 | -0.60 | -0.150.47 | -0.13 |
| L | 116 | -0.430.42 | -0.41 | 0.010.47 | -0.06 |
| Q | 38 | -1.410.72 | -1.59 | 0.090.92 | 0.31 |
| nQ | 625 | -0.570.41 | -0.81 | -0.150.50 | -0.13 |
4 Isolated galaxies vs. paired galaxies
The star forming properties of the 2MIG galaxies were compared with those of compact pairs’ members from the same lists used in Melnyk et al. (2014). By this comparison we would like to define the environmental influence (if any exists) on the properties of galaxies located in denser environments contrasted with isolated ones. Here we briefly describe the selection procedure applied for the galaxy pairs searching.
Initially, we extracted from the 2MASS XSC catalogue galaxies with 12 and according to the 2MIG selection criteria, obtaining the same primary volume-limited sample. Then, we found the closest neighbour for every galaxy from the sample, according to the angular separation between galaxies. We took only 2200 of the most tightly spaced pairs and correlated the positions of their galaxies with objects from the NED and Hyperleda databases. Finally, we rejected from the consideration: 1) all pairs without radial velocities for at least one pair member, 2) pairs with velocity differences of 1000 km/s. We then took into account only pair members having magnitude. Our final sample contained 1482 paired members. We considered pairs with 1000 km/s and linear projected distance 240 kpc (the full sample; Pairs), the most compact pairs (CP) having 150 km/s and 50 kpc (median values are km/s and kpc) while the wider pairs (WP) with 150 km/s or 50 kpc (median values are km/s and kpc). Here it is noted that we did not apply any isolation criteria for selected “pairs”, our formal criterion suggests that members of “pairs” are closer to each other than to any other galaxy. We consider paired galaxies located in high density regions in comparison with 2MIG galaxies. However, a visual inspection revealed that the closest neighbours to the CP (WP) members are located no closer than in 4(2). Note that we did not take into account blue smaller galaxies (with ) which are located near selected galaxies approximately in 1/6 cases. In Melnyk et al. (2014) it was shown that the colour properties of WP121212CP sample from this work corresponds to CP3 sample in Melnyk et al. (2014) but WP sample corresponds to CP1 sample excluding CP3. members are close to galaxies located in groups contrary to CP pairs, the colours of which are very close to the colours of galaxies in isolated pairs and triplets (Karachentsev 1987, Karachentseva et al. 1979, Karachentseva & Karachentsev 2000) which contain many interacting systems.
 |
 |
 |
 |
 |
 |
 |
 |
4.1 Morphology, mass, and comparison
In general, the sample of paired galaxies contains far more E type galaxies than the 2MIG sample (56% vs. 31%), see also discussion in Melnyk et al. (2014). We therefore observe a kind of morphology-density relation (Dressler 1980) with the result that in higher populated regions the fraction of early-type galaxies is higher. A similar relation was previously noted by Karachentsev (1987) for paired vs. isolated galaxies and Vavilova et al. (2009) for galaxies in triplets in comparison with isolated ones. Therefore we see that the most effective quenching occured in high density regions. This was also noted in many other previous works, see for example Cucciati et al. (2006), Scoville et al. (2013), Tal et al. (2014).
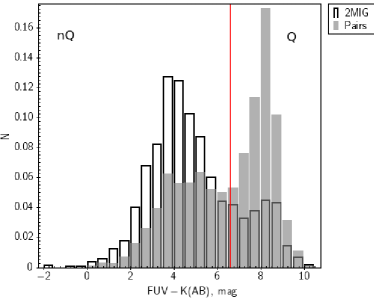
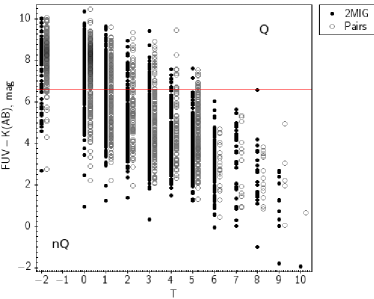
Fig. 8 (left panel) presents the (AB) colour distribution for the 2MIG and paired galaxies, while the right panel represents the coincidence between “colour” types and visually defined types. The red line FUV-K (AB)=6.6 defines a chosen border between so called quenched (Q) and non-quenched (nQ) galaxies (see also Fig. 4). A detailed comparison between visual morphology and Q/nQ types are given in subsection 3.2.
From the comparison of mean star formation characteristics of the 2MIG and paired galaxies (Tables 1 and 4, respectively) we can conclude that paired galaxies have lower values of and for all sub-samples, excluding L types, where the star formation rates of paired galaxies are clearly higher. However, in spite of similar selection criteria described in the previous subsection, paired galaxies appear to be slightly more massive than isolated galaxies (this was reported also in Melnyk et al. 2014). For example, the mean logSD for L-type galaxies of Pairs and 2MIGs are 10.590.53 and 10.270.69, respectively. Therefore, in order to conduct an adequate comparison of and between two samples, we calculated the corresponding values in the narrow ranges of stellar masses (9log10, 10log10.5, 10.5log11, 11log11.5 and 11.5log12) for the Q and nQ galaxy types, separately.
| Sample | N | log | log | log | log |
|---|---|---|---|---|---|
| [] | [yr-1] | [] | [yr-1] | ||
| All | 1482 | -0.800.75 | -11.860.81 | -0.330.69 | -11.390.75 |
| E | 923 | -1.150.59 | -12.290.56 | -0.610.60 | -11.750.59 |
| M | 505 | -0.260.62 | -11.230.61 | -0.110.54 | -10.850.63 |
| L | 54 | 0.230.45 | -10.370.53 | 0.460.48 | -10.140.42 |
| Q | 817 | -1.320.45 | -12.500.28 | -0.750.50 | -11.930.40 |
| nQ | 665 | -0.150.52 | -11.070.51 | 0.200.49 | -10.710.47 |
| 9log, []10 | |||||
|---|---|---|---|---|---|
| Samp.1/2 | log | log | log | log | |
| [] | [yr-1] | [] | [yr-1] | ||
| 2MIG/Pairs | 91/20 | 0.198 | 0.295 | 0.152 | 0.197 |
| 2MIG/CP | 91/16 | 0.602 | 0.627 | 0.738 | 0.773 |
| 2MIG/WP | 91/4 | 0.135 | 0.189 | 0.028 | 0.025 |
| 11.5log, []12 | |||||
| 2MIG/Pairs | 35/30 | 0.001 | 0.002 | 0.003 | 0.005 |
| 2MIG/CP | 35/4 | 0.105 | 0.237 | 0.103 | 0.268 |
| 2MIG/WP | 35/26 | 0.004 | 0.004 | 0.011 | 0.012 |
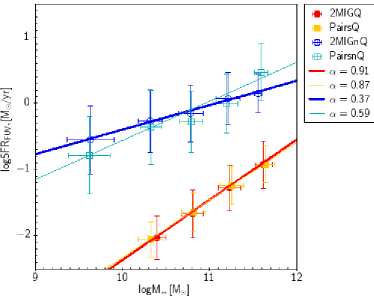
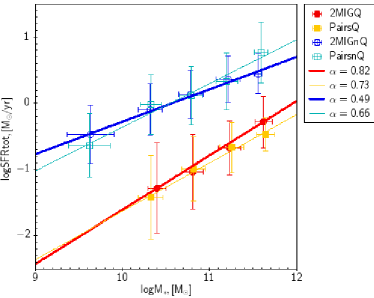
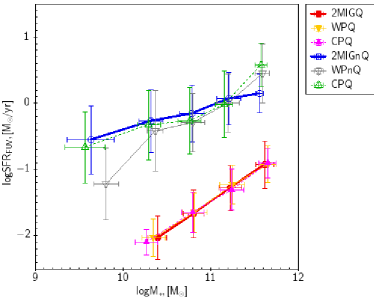
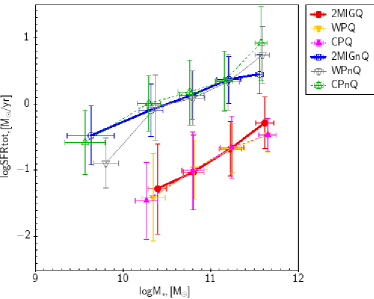
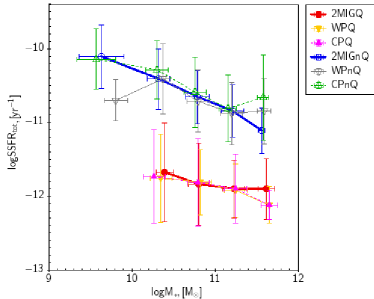
Fig. 9 presents the relation between the star formation rates of log on the left, log on the right and the stellar mass with the mean values with standard 1 deviations. For the main sequence galaxies we see the difference in slopes for the 2MIG and paired galaxies: the gradient for the former sample is smaller than the latter. For comparison, the fits for the Millenium simulations (0z0.3) and SDSS data from Elbaz et al. (2007) have slopes of =0.82 and 0.77, respectively, while the Boissier et al. (2010) model for z=0 fits with slope =0.65. Herewith the low mass nQ isolated galaxies have higher level of than paired galaxies while massive paired galaxies have somewhat higher than isolated galaxies. In Fig. 10 we show the same values as in Fig. 9 for the 2MIGs but we split the sample of paired galaxies into the wide and compact pair members (WP and CP). We see that the values of log and log for nQ galaxies are usually higher for the CP members than for galaxies in the WP sample. This reveals a possible triggering effect due to interaction in the closer pairs.
Table 5 shows the significance of the difference in the low and high mass ends for the nQ galaxies where visual differences in the Figs. 9,10 are prominent. The Student’s t-test probabilities in the columns mean that the sub-samples of the 2MIGs and Pairs/WP/CP drawn from the same parent sample and having the same mean values. The Student’s t-test shows that the differences between and in 11.5log12 mass range are more convincing than at 9log10 masses.
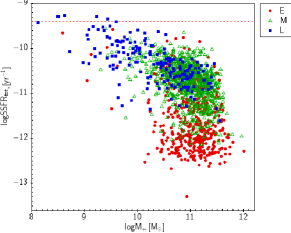
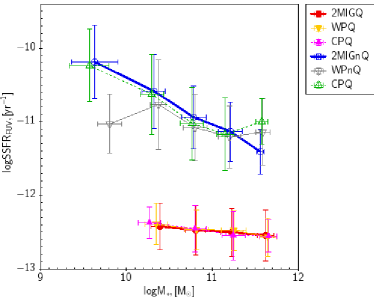
Fig. 11 presents the specific star formation rate vs. stellar mass comparing Q and nQ types of the 2MIG, WP and CP samples in the stellar mass ranges similarly to Fig. 10. It can be seen that the level of in nQ isolated galaxies is somewhat higher than in paired galaxies, supporting the previous results that galaxies located in low density regions have a higher level of specific star formation rate than those from denser regions (Rojas et al. 2004, Patiri et al. 2006, Elyiv et al. 2013). A difference between of galaxies in cluster and field were found also by Haines et al. (2013) for higher redshift galaxies (0.150.2). The authors found that the starforming cluster galaxies have systematically 30% lower than field galaxies at all mass ranges. However, this difference is negligible between galaxies in the cluster outskirts and in the field. Our results are in nominal agreement with Haines’s results in the low mass end. However, our findings suggest that the most massive paired galaxies 11.5log12 have a higher , triggering star formation. Note that our pairs may be located as in clusters as in the field. The level of for quenched galaxies is the same for the isolated and paired objects, showing that there is no environmental influence for these almost empty gas galaxies.
Table 6 represents the slopes of linear regressions for the 2MIG and paired galaxies. Schiminovich et al. (2007) and Salim et al. (2007) gave the =-0.36 and -0.35 for the main sequence and -0.2 for the red sequence. Schawinski et al. (2014) noted about -0.1 -0.2 slope for all SDSS galaxies. From our results it follows that the slope for the nQ 2MIGs is somewhat steeper than the slope for paired galaxies and noted values from Schiminovich et al. (2007) and Salim et al. (2007). Only two galaxies in our pairs have log a little higher than -9.4.
Therefore we suggest that on the lower mass end, galaxies from denser environments have an older stellar population which we can interpret as a sign of an environmental quenching. However, at higher masses, the positive influence of the environment, which triggers starformation, becomes remarkable. It follows from our findings that the main factor of evolutionary processes is mainly defined by the mass-factor, though the environmental influence is notable. It is possible that we are unable to define the difference with better significance due to the smaller environmental effect in comparison with mass-influence. In general, we are in agreement with the results obtained in previous works by other authors, see for example Peng et al. (2010, 2012) and Tal et al. (2014).
4.2 AGN impact
Karachentseva et al. (2014) studied the of the Markarian galaxies, which are active galaxies with different signs of activity (Markarian et al. 1989, Mazzarella & Balzano 1986, Petrosian et al. 2007): quasars, Seyfert galaxies, Wolf-Rayet, Starburst and HII galaxies. The authors found that in Markarian galaxies is a little higher than in isolated galaxies, though the does not exceed a limit of dex(-9.4) [-yr-1], also noted in subsection 3.4 of this paper. In the previous section we found some shortage/excess of (and also ) according to environmental events for low mass/high mass galaxies. Here we would like to examine how it is related to the AGN activity. For this we check and compare the AGN presence in isolated and paired galaxies.
| Sample | N | , (log) | , (log) |
|---|---|---|---|
| 2MIG | |||
| Q | 341 | -0.09 | -0.18 |
| nQ | 1275 | -0.63 | -0.50 |
| Pairs | |||
| Q | 817 | -0.13 | -0.27 |
| nQ | 665 | -0.41 | -0.34 |
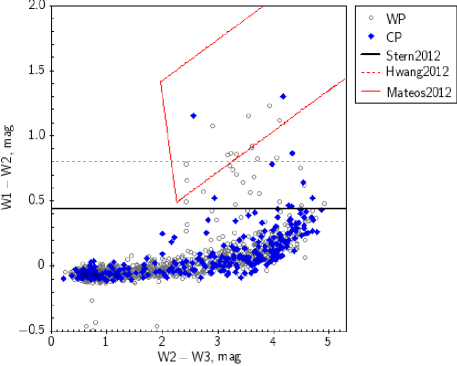
Since we have the WISE magnitudes for almost all of our galaxies, we define the AGN fraction according to W2-W1 vs. W3-W2 colour diagrams, which is effective in selection of bright IR AGN (see for example, Jarrett et al. 2011), the majority of these sources should be also bright in X-rays (Mateos et al. 2012). Fig. 12 presents the WISE colour-colour plots for galaxies from the 2MIG (left panel) and WP/CP samples (right panel). Since near 1/2 of our sample are also SDSS targets, we marked with different colour symbols SDSS-selected AGN type 1 and 2 on the left panel of Fig. 12. The AGN classification was carried out by Coziol et al. (2011), Pulatova et al. (2015) and a few additional AGN sources were found in the NED. Of course this spectroscopic classification is not homogeneous, rather only indicative. We marked with black dots any galaxies which do not contain AGN or where we have no information about AGN presence. In Fig. 12 we also marked with lines different criteria for the selection of the brightest IR AGN from Mateos et al. (2012), Stern et al. (2012) and Hwang et al. (2012).
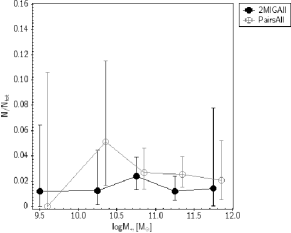
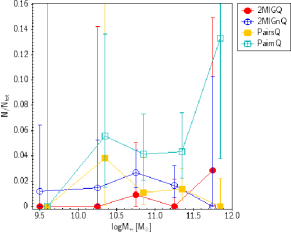
In Fig. 13 we show the fractions of AGN according to the weakest criterion by Hwang et al. (2012; W1-W20.44) for the 2MIG and full paired sample in different mass intervals (on the left) and also separately for Q and nQ sub-samples (on the right). These uncertainties correspond to 95% confidence level () calculated with the Binomial test. We see that the fraction of AGN in paired samples is almost always higher than in an isolated galaxy sample. However, the advantage is not crucial to conclude that the AGN phenomenon is necessarily connected with environmental density. We also did not find any increase in AGN fraction in most tight pairs as shown by Ellison et al. (2011) though we do not have a large statistical sample on pairs with R20 kpc.
Here we are in agreement with findings by Coziol et al. (2011), Sabater et al. (2012), Hernandez-Ibarra et al. (2013) and Pulatova et al. (2015) who studied the nuclear activity in a few samples of isolated galaxies and showed that secular evolution is a main mechanism for AGN triggering, at least in the Local Universe. Here we have to make a reservation that in our sample of the local galaxies we do not have bright X-ray AGN which evolution may be explained by the merging events (see for example Santini et al. 2012).
 |
 |
 |
 |
5 Conclusions
In the paper we have considered the star formation properties of 1616 isolated galaxies from the 2MIG catalogue (Karachentseva et al. 2010) with FUV magnitudes. The star formation rates () and specific star formation rates () of 2MIG galaxies were compared with corresponding properties of isolated galaxies from the LOG catalogue (Karachentsev et al. 2011) and with paired galaxies (WP – wide pairs and CP – the most compact pairs with velocity difference less than 150 km/s and a projected distance less than 50 kpc). We summarize our main findings below:
1. Different selection algorithms applied to different primordial samples define different populations of isolated galaxies. The population of the LOG catalogue, selected from the Local Supercluster non-clustered galaxies, mostly consists of spiral and late type galaxies. These are up to two orders of magnitude less massive than the 2MIG galaxies of corresponding morphology. The 2MIG population, in сontrast, was selected from the 2MASX (Jarrett et al. 2000) within quite bright near-infrared galaxies (12 mag and angular diameters 30′′) consisting of normal mass galaxies, predominantly of early spirals. Late type galaxies of both samples have almost the same amount of gas at present epochs though the gas fraction in spiral and early type galaxies of the 2MIG sample is much smaller and will be consumed over less time than . In general, the vs. and vs. relations of the LOG sample complete 2MIG corresponding relation to lower masses.
2. The upper limit in all considered galaxy samples (i.e. isolated and paired) of the Local Universe (at least at z0.06) does not exceed the value of dex(-9.4). This is probably common for galaxies of differing activity located in different types of environments (Karachentsev et al. 2013, Karachentsev and Kaisina 2013, Karachentseva et al. 2014).
3. The fractions of quenched (Q, with FUV-K (AB) 6.6) galaxies of 10.5log11.5 masses are nearly twice as high in the paired galaxy sample than among the 2MIG isolated galaxies. This suggests that quenching proved more effective in higher density regions in the past (Cucciati et al. 2006, Scoville et al. 2013, Tal et al. 2014). From the behaviour of vs. relations we concluded that the main factor of evolutionary processes is defined by the galaxy mass. However, the environmental influence is notable: the 2MIG’s and pair’s main sequence (non-Quenched with FUV-K (AB) 6.6) galaxies have different gradients: the relation for the former sample is smaller than the latter, i.e. the paired galaxies have somewhat lower and at low masses and higher and for the massive galaxies with log11.5. The Student’s t-test showed that the difference is significant only for the high-mass end. Therefore we suggest, that the environment triggers star formation in the highest mass galaxies. Moreover, the values of and are higher in general for galaxies in the most closely spaced pairs suggesting the outgoing interactions.
4. The existence of a significant fraction of quenched isolated galaxies (21%) reveals that the main quenching mechanism probably does not depend on the environmental density. The similarity of the mean values of the and gradients in vs. (also in vs. ) relations for quenched 2MIG and paired galaxies also support the assumption that the dominant quenching mechanism is similar for galaxies located in all type of environments and depend mainly upon the galaxy mass (possibly the main driving mechanism is AGN feedback Croton & Farrar 2008, see also discussion in Peng et al. 2010 and Schawinski et al. 2014).
5. We found that the fraction of AGN in paired samples is a little higher (but not significantly in the statistical sense) than in our isolated galaxy sample. We suggest that AGN phenomenon is not necessarily connected with environmental density and, most probably, defined by secular galaxy evolution confirming the previous results by Coziol et al. (2011), Sabater et al. (2012), Hernandez-Ibarra et al. (2013), Karachentseva et al. (2014) and Pulatova et al. (2015).
Acknowledgments
We are thankful to Samuel Boissier for his useful comments and suggestions. We are also grateful to Andrew Whimster for the language corrections. This research has made use of the NASA/IPAC Extragalactic Database (NED) which is operated by the Jet Propulsion Laboratory, California Institute of Technology, under contract with the National Aeronautics and Space Administration. We acknowledge the usage of the HyperLeda database (http://leda.univ-lyon1.fr). In our work we have also used SDSS-III data, funding for which has been provided by the Alfred P. Sloan Foundation, the Participating Institutions, the National Science Foundation, and the U.S. Department of Energy Office of Science. The SDSS-III web site is http://www.sdss3.org/. This work was supported by a grant from the Russian Foundation for Basic Researches, 13-02-90407 Ukr-f-a.
References
- (1) Allam S. S., Tucker D. L., Lee B. C., Smith J. A. 2005, AJ, 129, 2062
- (2) Anderson M. E., Bregman J. N., Dai X. 2013, ApJ, 762, id. 106
- (3) Argudo-Fernandez M. et al. 2013, A&A, 560, A9
- (4) Behroozi P.S., Wechsler R. H., Conroy C. 2013, ApJ, 770, 57
- (5) Bell E. F., McIntosh D. H., Katz N., Weinberg M. D. 2003, ApJSS, 149, 289
- (6) Bendo G. J., Galliano F., Madden S. C. 2012, MNRAS, 423, 197
- (7) Bouwens R.J. et al. 2011, Nature, 469, 507
- (8) Boissier S., Buat V., Ilbert O. 2010, A&A 522, A18
- (9) Burgarella D. et al. 2013, A&A, 554, A70
- (10) Calzetti D. 2012, Proceedings of the XXIII Canary Islands Winter School of Astrophysics: ’Secular Evolution of Galaxies’, edited by J. Falcon-Barroso and J.H. Knapen astro-ph/1208.2997
- (11) Cardelli J.A., Clayton G.C., Mathis J.S. 1989, AJ, 345, 245
- (12) Coziol R., Torres-Papaqui J. P, Plauchu-Frayn I., Islas-Islas J. M., Ortega-Minakata R. A., Neri-Larios D. M., Andernach H. 2011, Revista Mexicana de Astronomia y Astrofisica, 47, 361
- (13) Croton et al. D.J. 2006, MNRAS, 365, 11
- (14) Croton D. J., Farrar G.R., 2008, MNRAS, 386, 2285
- (15) Cucciati O. et al. 2006, A&A, 458, 39
- (16) de Vaucouleurs G. 1971, PASP, 83, 113
- (17) Dressler A., 1980, ApJ, 236, 351
- (18) Dubois Y., Gavazzi R., Peirani S., Silk J. 2013, MNRAS, 433, 3297
- (19) Durbala A., Sulentic J. W., Buta R., Verdes-Montenegro L. 2008, MNRAS, 390, 881
- (20) Elbaz D. et al. 2007, A&A, 468, 33
- (21) Ellison S.L., Patton D.R., Mendel J.T., Scudder J.M. 2011, MNRAS, 418, 2043
- (22) Elyiv A., Melnyk O., Vavilova I. 2009, MNRAS, 394, 1409
- (23) Elyiv A., Karachentsev I., Karachentseva V., Melnyk O., Makarov D. Astrophys. Bull. 2013, 68, 1
- (24) Fabian A.C. 2012, ARA&A, 50, 455
- (25) Fernandez Lorenzo M. , Sulentic J. , Verdes-Montenegro L., Ruiz J. E., Sabater J., Sanchez S. 2012, A&A ,540, id.A47
- (26) Fukugita M., Peebles P. J. E. 2004, ApJ, 616, 643
- (27) Gil de Paz A. et al. 2007, ApJSS, 173, 185
- (28) Haines C.P. et al. 2013, A&A, 775, 126
- (29) Hernandez-Ibarra F. J., Dultzin D., Krongold Y., del Olmo A., Perea J., Gonzalez J. 2013, MNRAS, 434, 336
- (30) Hernandez-Toledo H. M., J. A. Vazquez-Mata, L. A. Martinez-Vazquez, Choi Y.-Y., Park C. 2010, AJ, 139, 2525
- (31) Hirschmann M., De Lucia G., Iovino A., Cucciati O. 2013, MNRAS, 433, 1479
- (32) Hoyle F., Vogeley M.S., Pan D., 2012, MNRAS, 426, 3041
- (33) Hwang H.S., Geller M.J., Diaferio A., Rines K.J. 2012, ApJ, 752, 64
- (34) Jarrett T. H., Chester T., Cutri R., Schneider S., Skrutskie M., Huchra J. P. 2000, AJ, 119, 2498
- (35) Jarrett T. H. et al. 2011, ApJ, 735, 112
- (36) Jarrett T. H. et al. 2013, AJ, 145, 6
- (37) Karachentsev I.D., Makarov D. I. 1996, Astronomical Journal, 111, 794
- (38) Karachentsev I.D., Kaisin S.S. 2007, AJ, 133, 1883
- (39) Karachentsev I.D., Makarov D.I., Karachentseva V.E., Melnyk O.V. 2011, Astrophys. Bull., 66, 1
- (40) Karachentsev I.D., Karachentseva V.E., Melnyk O.V., Elyiv A.A., Makarov D.I. 2012, Astrophys. Bull., 67, 353
- (41) Karachentsev I.D., Kaisina E. L., 2013, AJ, 146, 46
- (42) Karachentsev I.D., Makarov D. I. & Kaisina E. I. 2013, AJ, 145, id.101
- (43) Karachentsev, I.D., Karachentseva, V.E., Melnyk, O.V., Courtois, H.M. 2013, Astrophys. Bull., 68, 243
- (44) Karachentseva V.E. 1973, Soobshch. Spets. Astrofiz. Obs., 8, 3
- (45) Karachentseva V. E., Karachentsev I. D., Shcherbanovsky A. L. 1979, Astrof. Issledovaniia, 11, 3
- (46) Karachentseva V.E., Karachentsev I.D. 2000, Astronomy Reports, 44, 501
- (47) Karachentseva V.E., Mitronova S. N., Melnyk O. V., Karachentsev I. D. 2010, Astrophys. Bull., 65, 1
- (48) Karachentseva V.E., Karachentsev I. D., Sharina M. E. 2010a, Astrophysics, 53, 462
- (49) Karachentseva V. E., Karachentsev I. D., Melnyk O. V. 2011, Astrophys. Bull., 66, 389
- (50) Karachentseva V. E., Melnyk O. V., Karachentsev I. D., 2014, Astrophysics, 57, 1
- (51) Khalatyan A., Cattaneo A., Schramm M., Gottlober S., Steinmetz M., Wisotzki L. 2008, MNRAS, 387, 13
- (52) Kennicutt R. C. 1998, ARA&A, 36, 189
- (53) Kreckel K., E. Platen E., Aragon-Calvo M. A., van Gorkom J. H., van de Weygaert R., van der Hulst J. M., Beygu B. 2012, AJ, id.16
- (54) Kudrya Yu. N., Karachentseva V. E., Karachentsev I. D., 2011, Astrophysics, 54, 445
- (55) Kudrya Yu. N., Karachentseva V. E. 2012, Astrophysics, 55, 435
- (56) Lee J.C. et al. 2009, ApJ, 706, 599
- (57) Lemaux B.C. et al. 1311.5228
- (58) Leon S. et al. 2008, A&A, 485, 475
- (59) Lisenfeld U. et al. 2007, A&A 462, 507
- (60) Lisenfeld U. et al. 2011, A&A 534, id.A102
- (61) Makarov D., Karachentsev I. 2011, MNRAS, 412, 2498
- (62) Markarian B. E., Lipovetsky V. A., Stepanian J. A., Erastova L. K., Shapovalova A. I. 1989, Commun. of the Special Astrophys. Obs., 62, 5
- (63) Mateos S. et al. 2012, MNRAS, 426, 3271
- (64) Mazzarella J. M., Balzano V. A. 1986, ApJSS, 62, 751
- (65) Melnyk O., Mitronova S., Karachentseva V. 2014, MNRAS, 438, 548
- (66) Patiri S. G., Prada F., Holtzman J., Klypin A., Betancort-Rijo J. 2006, MNRAS, 372, 1710
- (67) Paturel G., Petit C., Prugniel P., Theureau G., Rousseau J., Brouty M., Dubois P., Cambrésy L., 2003, A&A, 412, 45
- (68) Peng Y.-J. et al. ApJ, 2010, 721, 193
- (69) Peng Y.-J., Lilly S.J., Renzini A., Carollo M. 2012, ApJ, 757, id. 4
- (70) Petrosian A., McLean B., Allen R. J., MacKenty J.W. 2007, ApJSS, 170, 33
- (71) Pulatova N.G., Vavilova I.B., Sawangwit U., Babyk, Iu., Klimanov S. 2015, MNRAS, 447, 2209
- (72) Roberts M. S., Haynes M. P. 1994, ARA&A, 32, 115
- (73) Rojas R. R., Vogeley M. S., Hoyle F., Brinkmann J. 2004, AJ, 617, 50
- (74) Sabater J., Leon S., Verdes-Montenegro L., Lisenfeld U., Sulentic J., Verley S., 2008, A&A, 486, 73
- (75) Sabater J., Verdes-Montenegro L., Leon S., Best P., Sulentic J., 2012, A&A, 545, id.A15
- (76) Salim S. et al. 2007, ApJSS, 173, 267
- (77) Salim S., Fang J.J., Rich R.M., Faber S. M., Thilker D.A. 2012, ApJ, 755, 105
- (78) Santini P. et al. 2012, A&A 540, A109
- (79) Schawinski K. et al. 2014, MNRAS, 440, 889
- (80) Schlegel D.J., Finkbeiner D.P., Davis M. 1998, AJ, 500, 525
- (81) Schiminovich D. et al. 2007, ApJSS, 173, 315
- (82) Scoville N. et al. 2013, ApJSS, 206, 3
- (83) Sorrentino G., Antonuccio-Delogu V., Rifatto A. 2006, A&A 460, 673
- (84) Stern D. et al. 2012, ApJ, 753, 30
- (85) Tal T., 2014, ApJ, 789, 164
- (86) Taranu D.S., Hudson M.J., Balogh M.L., Smith R.J., Power C., Oman K.A., Krane B. 2014, MNRAS, 440, 1934
- (87) Tinker J.L. et al. 2013, ApJ, 778, 93
- (88) Turner E.L., Gott J.R. 1977, ApJ, 197, L89
- (89) Wetzel A.R., Tinker J.L., Conroy C., van den Bosch F.C. 2014, MNRAS, 439, 2687
- (90) van den Bosch F.C., Aquino D., Yang X., Mo H.J., Pasquali A., McIntosh D.H., Weinmann S.M., Kang X. 2008, MNRAS, 387, 79
- (91) Varela J., Moles M., Marquez I., Galletta G., Masegosa J., Bettoni D. 2004, A&A, 420, 873
- (92) Vavilova I. B., Melnyk O. V., Elyiv A. A. 2009, AN, 330, 1004
- (93) Verley S. et al. 2007, A&A, 472, 121
- (94) von Benda-Beckmann A. M. & Muller V. 2008, MNRAS, 384, 1189
- (95) Zinn P.-C., Middelberg E., Norris R.P., Dettmar R.-J. 2013, ApJ, 774, id.66
- (96) Zubovas K., Nayakshin S., King A., Wilkinson M. 2013, MNRAS, 433, 3079
- (97) Zwicky F., Herzog E., Wild P., Karpowicz M., Kowal C. CGCG, 1961, , Pasadena: California Institute of Technology